
Some say bribes grease the wheels of business. But if that is the case, where are the greasiest wheels? This interactive piece from the BBC showcases an interesting story. It maps who has paid bribes and the value thereof. Then it looks at corruption in the different sectors of the country and which is perceived to be the most corrupt.
Aesthetically this is not the finest piece. Some of the most interesting countries to view are in Africa and Southeast Asia, i.e. geographies near the equator. Unfortunately the designers here chose a map projection that emphasises Siberia and Arctic Canada at the expense of those very countries. Also, where did Greenland go? I know that the ice is melting, but I don’t think it’s melted that quickly. Furthermore, if the user clicks the “List” option, he or she is presented only with a list of geographies. None of them are selectable nor do they encode data. So why is the list there?
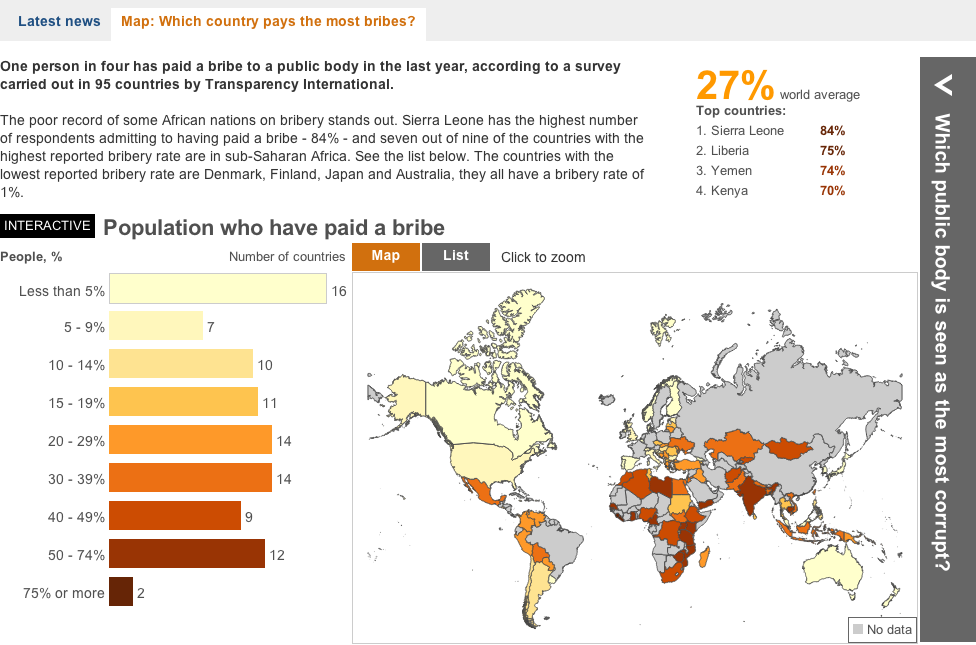
In short, the interface is a bit clunky and strangely designed. Line lengths are too long and it looks ugly. But, there are two interesting things going on here worth noting. First the legend here actually does not just show the range for the choropleth, but it also encodes the number of countries that fall within that range.
Second, by clicking on a particular bin for the legend, the map filters for the selection. I think that from a design perspective, a lighter grey and a lighter stroke outline would have made the filtering a bit more prominent, but the idea is interesting. Unfortunately, I found no way of easily returning to an all-bin view of the map.
A piece for the BBC that misses a few, but also hits a few.
Credit for the piece goes to the BBC graphics team.