Last week we covered the fall of the Berlin Wall and the lasting impact in former East Germany vs. former West Germany. This week we look at a piece from Bloomberg Businessweek that looks more broadly at Eastern Europe.
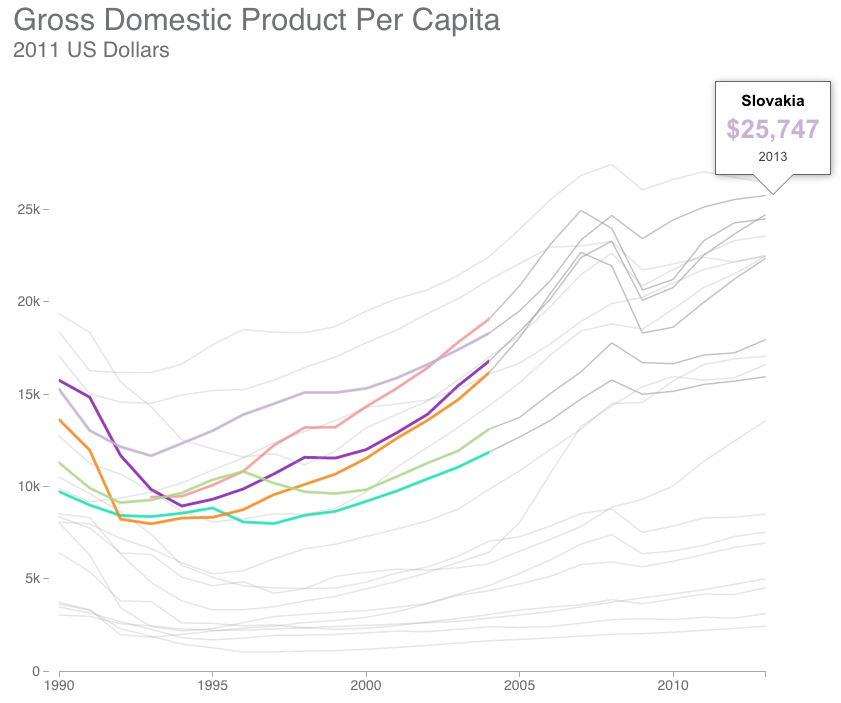
Looking at GDP per capita
The piece scrolls with the charts updating based upon the available text. And within that text are highlighted keywords with which the user can interact to highlight data within the charts.
Credit for the piece goes to Alex McIntyre, Peter Coy, Christopher Cannon, and Blacki Migliozzi.
Author: Brendan Barry
I am a graphic designer who focuses on information design. My day job? Well, they asked me not to say. But to be clear, this blog is my something I do on my own time and does not represent the views of…my employers. I think what I can say is that given my interest in information design—be it in the shape of clear charts, maps, diagrams, or wayfinding systems—I am fortunate that my day job focuses on data visualisation. Outside of work, I try to stay busy with personal design work. Away from the world of design, I have become an amateur genealogist and family historian. You will sometimes see that area of work bleed into my posts.
View all posts by Brendan Barry