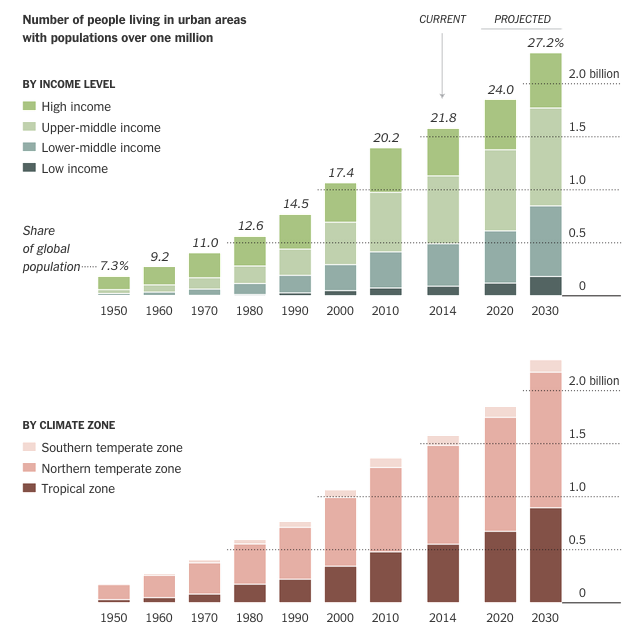
Today’s selection is a little old—dating from July of last year—but is still a nice example of an inline graphic supporting the premise of its accompanying article. The New York Times looks at what was then data published by the United Nations on urban growth out to 2030. The article talks about the growth of megacities in lower income countries and those in the tropical regions. So smack in the middle of the article are two stacked bar charts breaking down urban populations into those two categories.

Personally I would have preferred a series of line charts to better compare the growth—the lack of a common baseline makes it very difficult to compare segments of the bars. But below the stacked bar charts we have a nice table. Those are always good to see. They organise information clearly and make it quick to find what is relevant.
Credit for the piece goes to the New York Times graphics department.
