
I was in London for work two weeks ago and our main office is near Farringdon Station, one of the new hubs of London transport when Crossrail goes live later this decade. Earlier this week, Crossrail’s official name was unveiled: Elizabeth Line. Last year, the Economist had an article about ridership of the London Underground and how cramped it is. (I only rode it once during rush-hour and that was when I was on holiday.) The idea is that the Elizabeth Line will ease congestion for those people trying to cross London east-to-west both within the city and from the outer suburbs. Plus to and from this little airport called Heathrow.
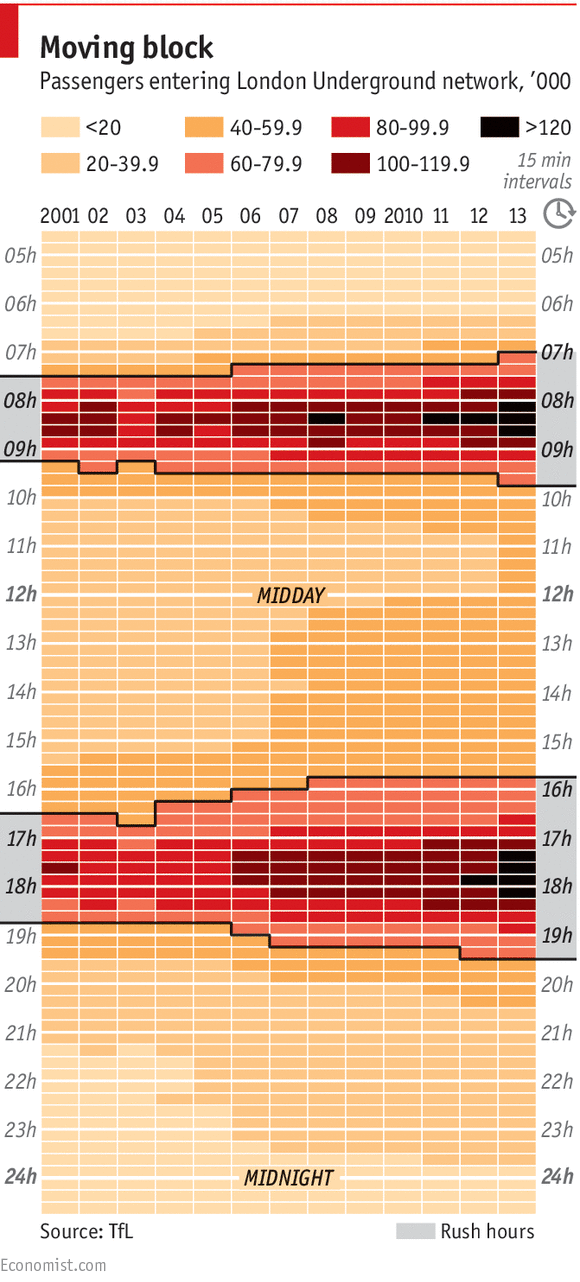
Anyway, the article made use of a really smart heatmap to illustrate the number of riders in 15-minute intervals. It then highlights the traditional “rush hour”. The highlight illustrates that rush hour in London is more like rush-three-hours. Overall a smart piece.
And as bonus points for their designer, look at how they segment out the difference between 15-minutes and hours. Note how it is just a pixel or two greater gap, but that makes it far easier to carry the time chunks into the middle of the chart.
Credit for the piece goes to the Economist’s graphics department.