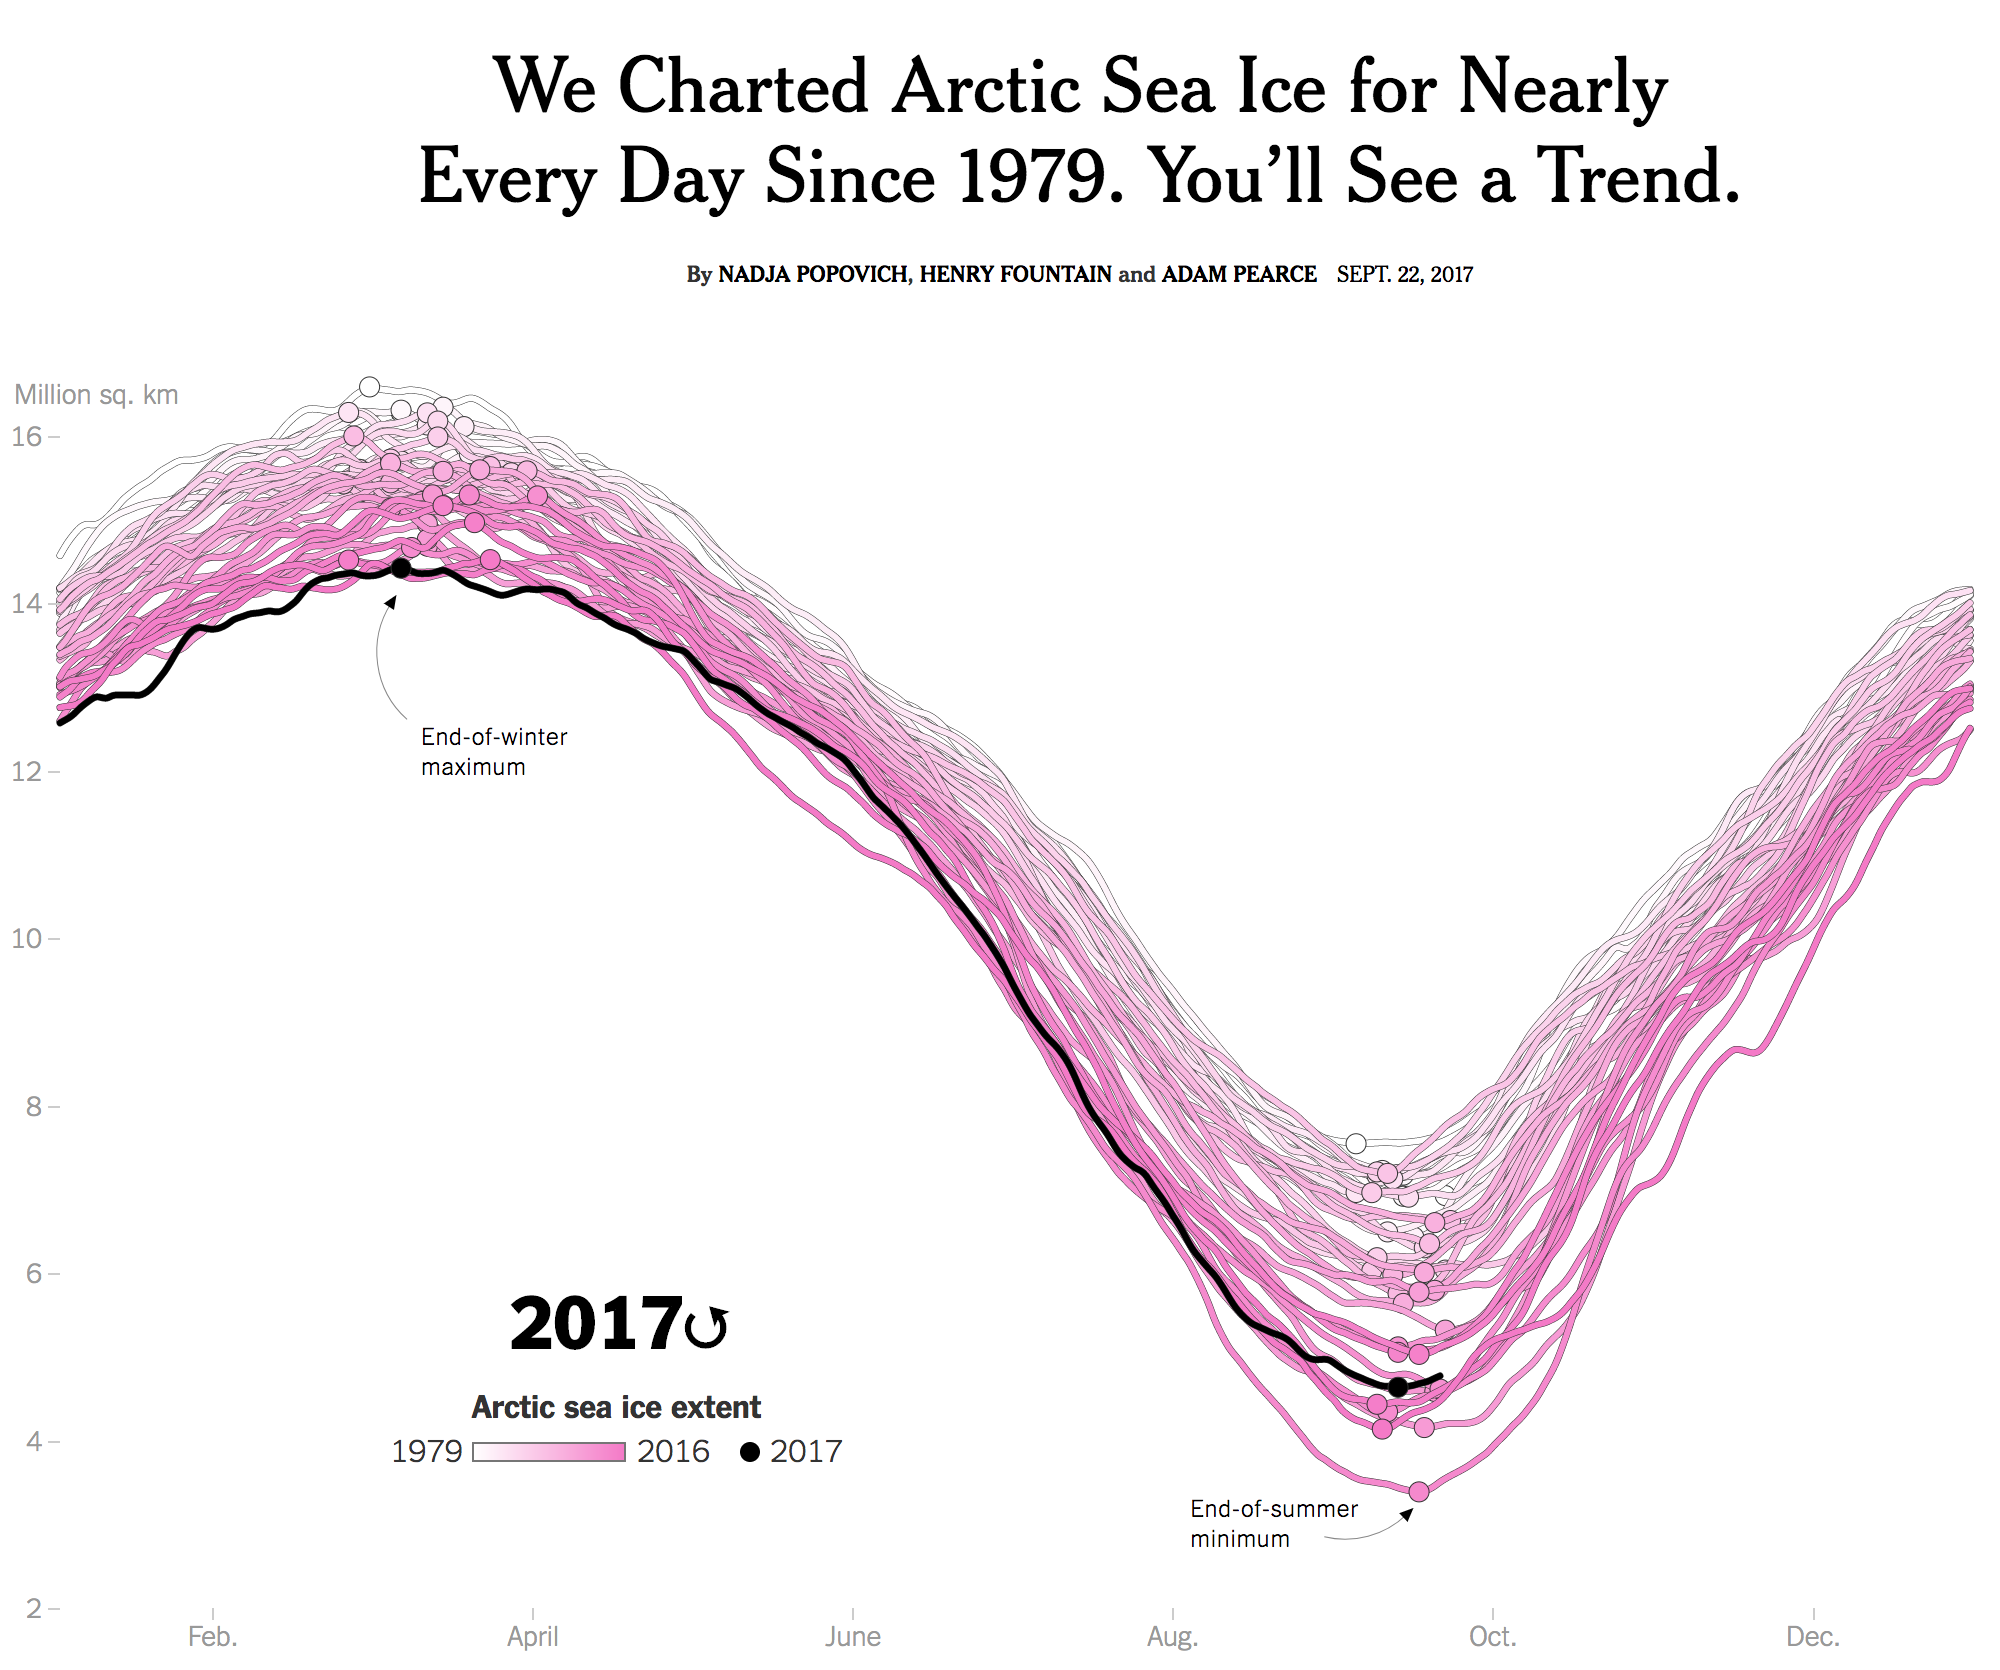
You may recall how over two years ago I posted about a piece from the New York Times that explored the levels of Arctic sea ice. It showed how the winter sea ice of 2015 was the lowest level ever recorded. Well last week the Times updated that piece with new data. And instead of the static graphic we enjoyed last time around, this time the piece began with a nice animation. It really helps you see the pattern, so you should click through and check out the whole piece.
Go hit play and you’ll see the trend
But this isn’t just a visually top heavy piece. No, the remainder of the article continues to explore the state of Arctic sea ice through a number of other charts and maps.
Credit for the piece goes to Nadja Popovich, Henry Fountain, and Adam Pearce.
Author: Brendan Barry
I am a graphic designer who focuses on information design. My day job? Well, they asked me not to say. But to be clear, this blog is my something I do on my own time and does not represent the views of…my employers. I think what I can say is that given my interest in information design—be it in the shape of clear charts, maps, diagrams, or wayfinding systems—I am fortunate that my day job focuses on data visualisation. Outside of work, I try to stay busy with personal design work. Away from the world of design, I have become an amateur genealogist and family historian. You will sometimes see that area of work bleed into my posts.
View all posts by Brendan Barry