
Here in Pennsylvania this week, the state Supreme Court will hear arguments on the legality of congressional districts drawn by Republicans in 2010. The state is rather evenly split between Republicans and Democrats, e.g. Donald Trump won by less than one percentage point or less than 45,000 votes. But 13 of its 18 congressional districts are represented by Republicans, roughly 72%.
This graphic is from the New York Times Upshot and it opens a piece that explores gerrymandering in Pennsylvania. The graphic presents the map today as well as a nonpartisan map and an “extreme” gerrymander. The thing most noticeable to me was that even with the nonpartisan geography, the Democrats are still below what they might expect for a near 50-50 split. Why? One need only look at Philadelphia and Pittsburgh where, using the Times’ language, the Democrats “waste” votes with enormous margins, leaving the suburban and rural parts of the state open for Republican gains.
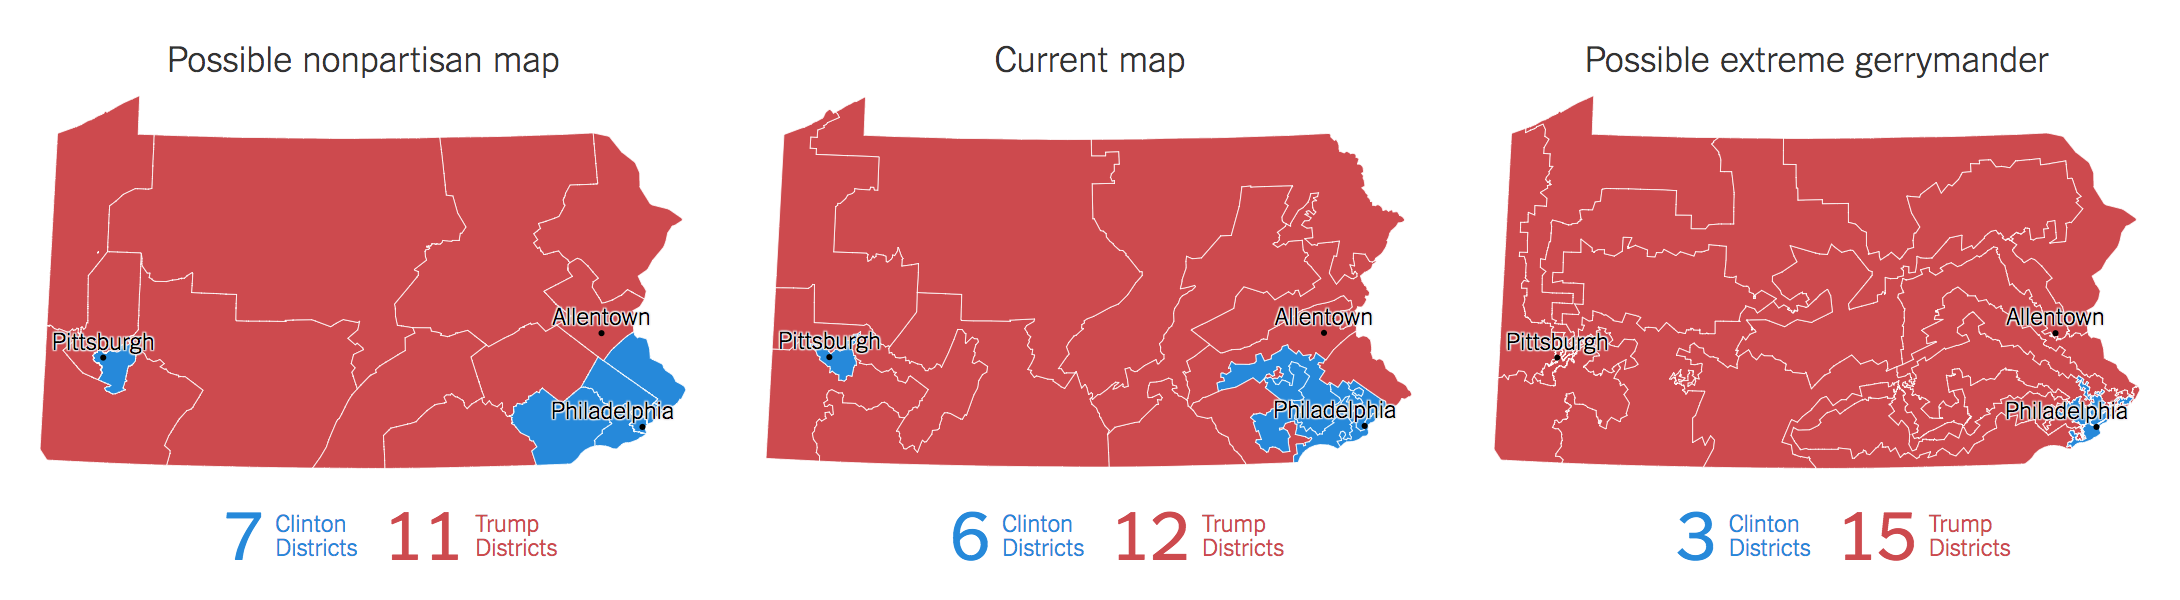
Credit for the piece goes to Quoctrung Bui and Nate Cohn.
5 thoughts on “Gerrymandering Pennsylvania”