
Last week we talked a lot about trade—and we will get back to it. But the World Cup is now in full swing and I want to take a look at a couple of things this week. But to begin, the Economist published an article about the difficulty of predicting the outcome of World Cups. It looks at the quirks of random events alongside more quantitative things like ranking systems and their differences.
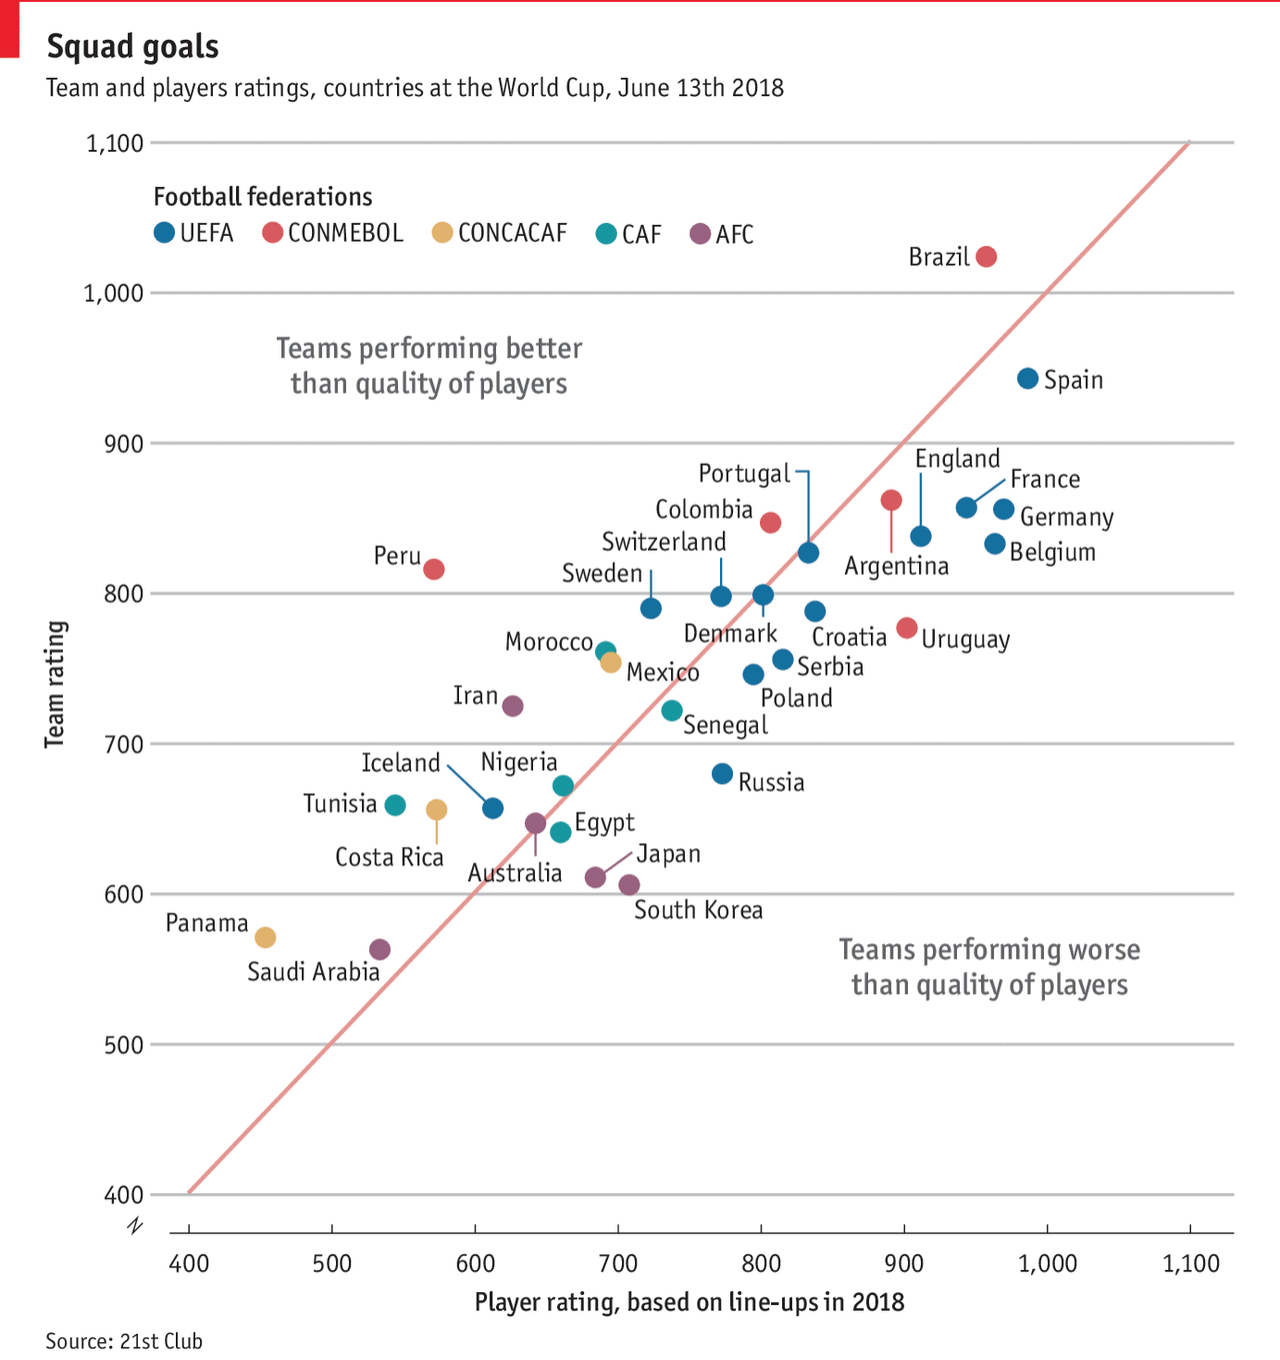
But one graphic in particular caught my attention. It explore the difference between the ranking in individual players versus the teams as a whole. In short, some teams are valued more highly than their constituent players and others vice versa. The graphic is fairly straightforward in that it plots the team value on the y-axis and the players’ on the x.
Personally? I would never bet against Germany. Or Brazil.
But if your author is lucky, he’s going to enjoy the England–Tunisia match this afternoon for lunch—rooting for England, of course. Though thanks to some online tools that’s not the only team I’m rooting for this year. But more on that later this week.
Credit for the piece goes to the Economist graphics department.