
Tomorrow is Election Day here in the United States and this morning I wanted to look at a piece I’ve had in mind on doing from City Lab. I held off because it looks at the election and what better time to do it than right before the election.
Specifically, the article looks at the density of the different congressional districts across the United States. Whilst education level appears to be the most predictive attribute of today’s political climate—broadly speaking those with higher levels of formal education support the Democrats and those with lower or without tend to support President Trump—the growing urban–rural divide also works. But what about the in-between? The suburbs? The exurbs? And how do we then classify the congressional districts that include those lands.
For that purpose City Lab created its City Lab Congressional Density Index. Very simplistically it scores districts based on their mixture of low- to medium- to high-density neighbourhoods. But visually, which is where this blog is concerned, we get maps with six bins from pure urban to pure rural and all the mixtures in-between. This cartogram will show you.
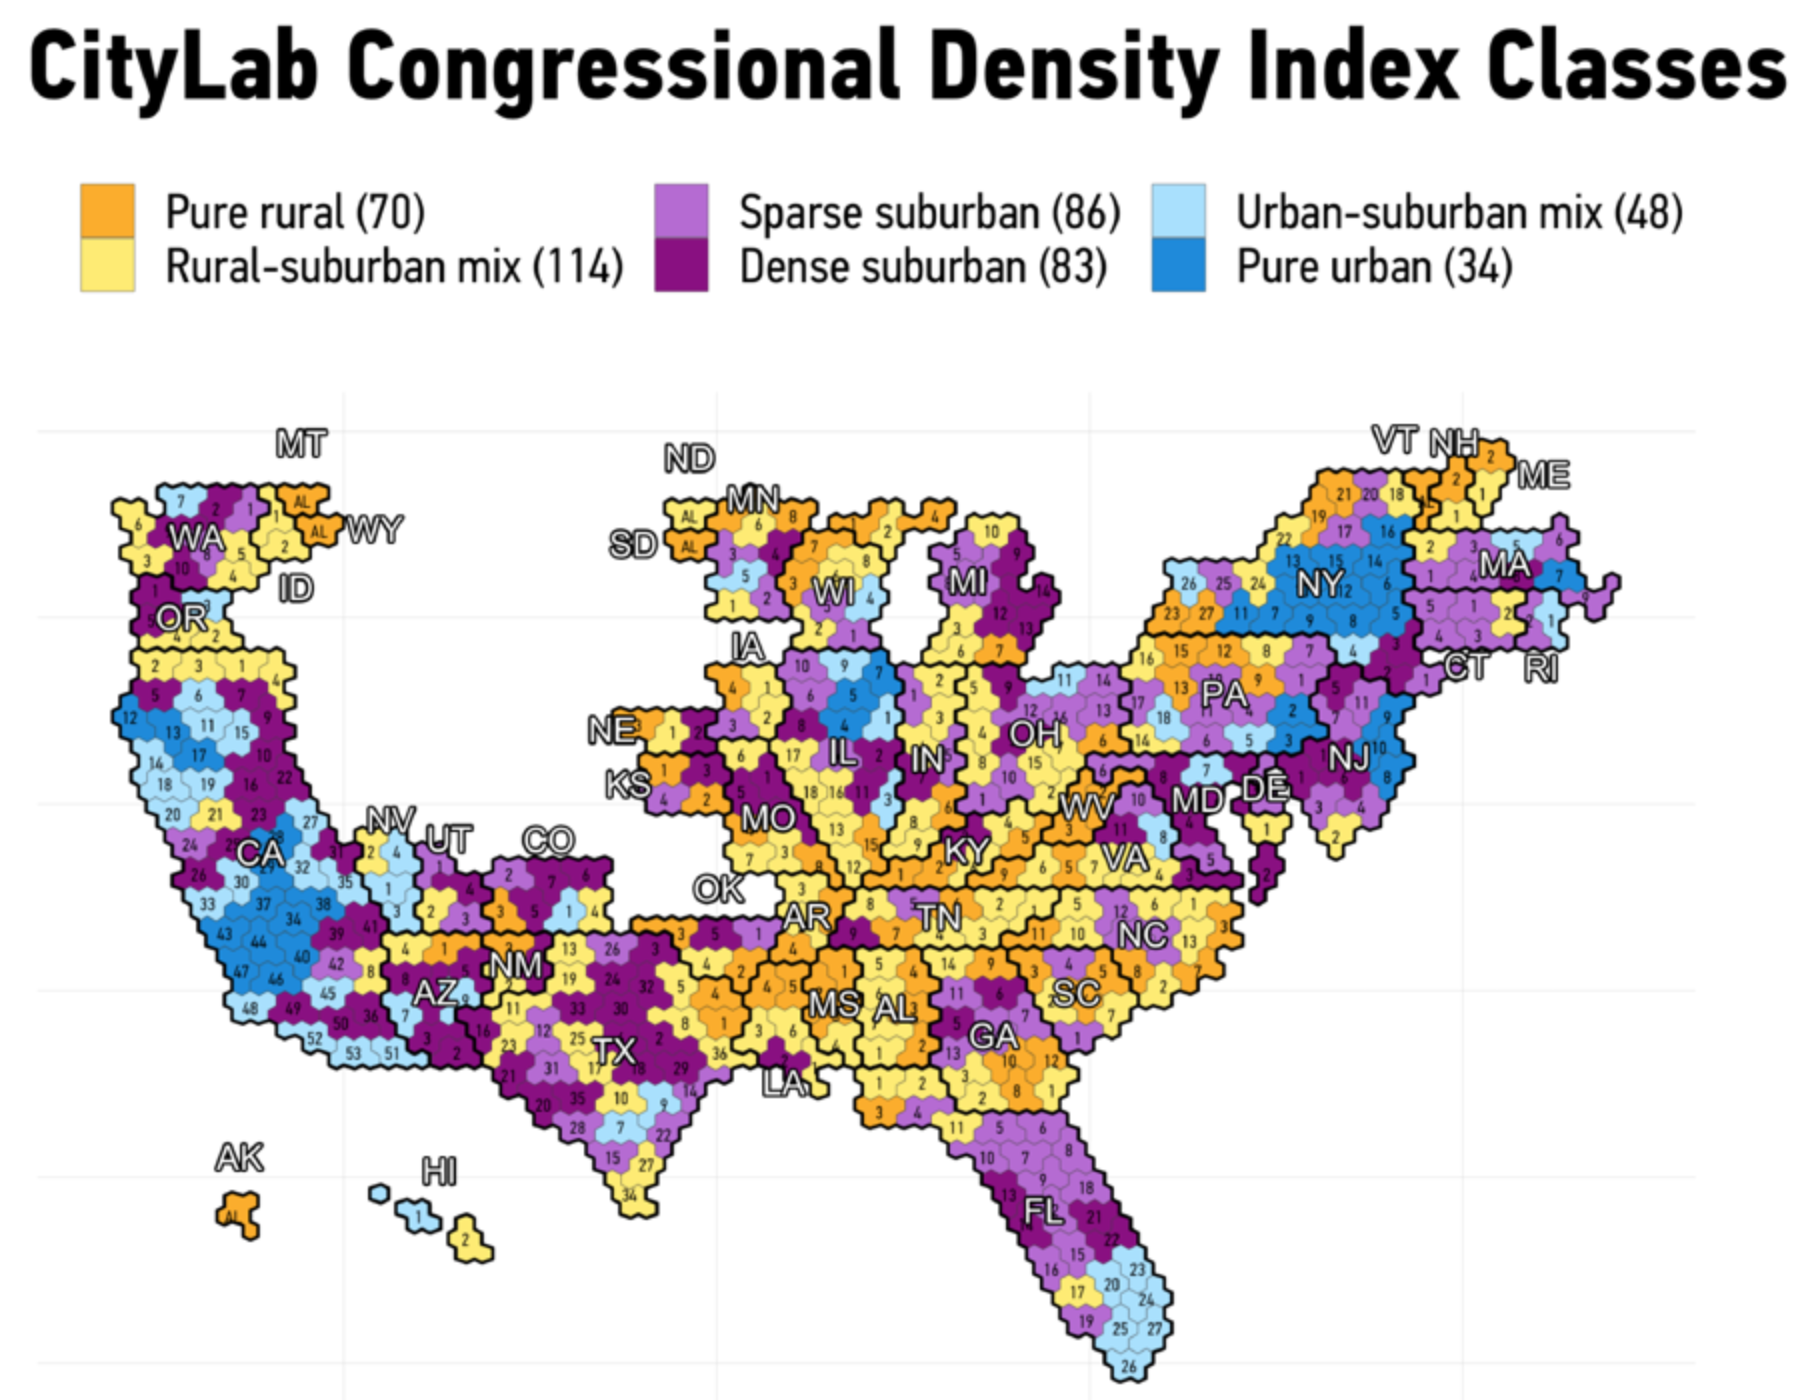
Now, there are a couple of things I probably would have done differently in terms of the visualisation. But the more I look at this, one of those things would not be to design the hexagons to all fit together nicely. Instead, you get this giant gap right where the plains states begin west of the Mississippi River stretching through the Rockies over to California. If you think about it, however, that is a fairly accurate description of the population distribution of the United States. With a few exceptions, e.g. Denver, there are not many people living in that space. Four geographically enormous states—North Dakota, South Dakota, Montana, and Wyoming—have only one congressional district. Idaho has two. Nebraska three. And then Iowa and Kansas four. So why shouldn’t a map of the United States display the plains and Rocky Mountain interior as a giant people hole?
Like I said, initially I took umbrage at that design decision, but the more I thought about it, the more it made sense. But there are a few others with which I quibble. The labelling here is a big one. First, we have the district labels. They are small, because they have to be to fit within the five hexagons that define the districts’ shapes. But every label is black. Unfortunately, that makes it difficult to read the labels on the darker colours, most notably the dark purple. I probably would have switched out the black labels in those instances for white ones.
But then the state labels are white with black outlines, which makes it difficult to read on either dark or light backgrounds. The designer made the right decision in making the labels larger than the districts, but they need to be legible. For example, the labels of Alaska and Hawaii need not be white with black outlines. They could just be set in black type to be legible. Conversely, Florida’s, sitting atop darker purple districts, could be made white.
The piece makes use of more standard geographic map divided into congressional districts—the type you will see a lot tomorrow night. And it makes use of bar charts to describe the demographics of the various density types. I like the decision there to use a new colour to fill in the bars. They use a dark green because it can cut across each of the six types.
Credit for the piece goes to David H. Montgomery.
One thought on “Congressional District Population Density”