
Yesterday we looked at how China and the European Union are planning their tariff/trade war retaliation to target Trump voters. Today let’s take a look at how those voters are doing as this article from Bloom does.
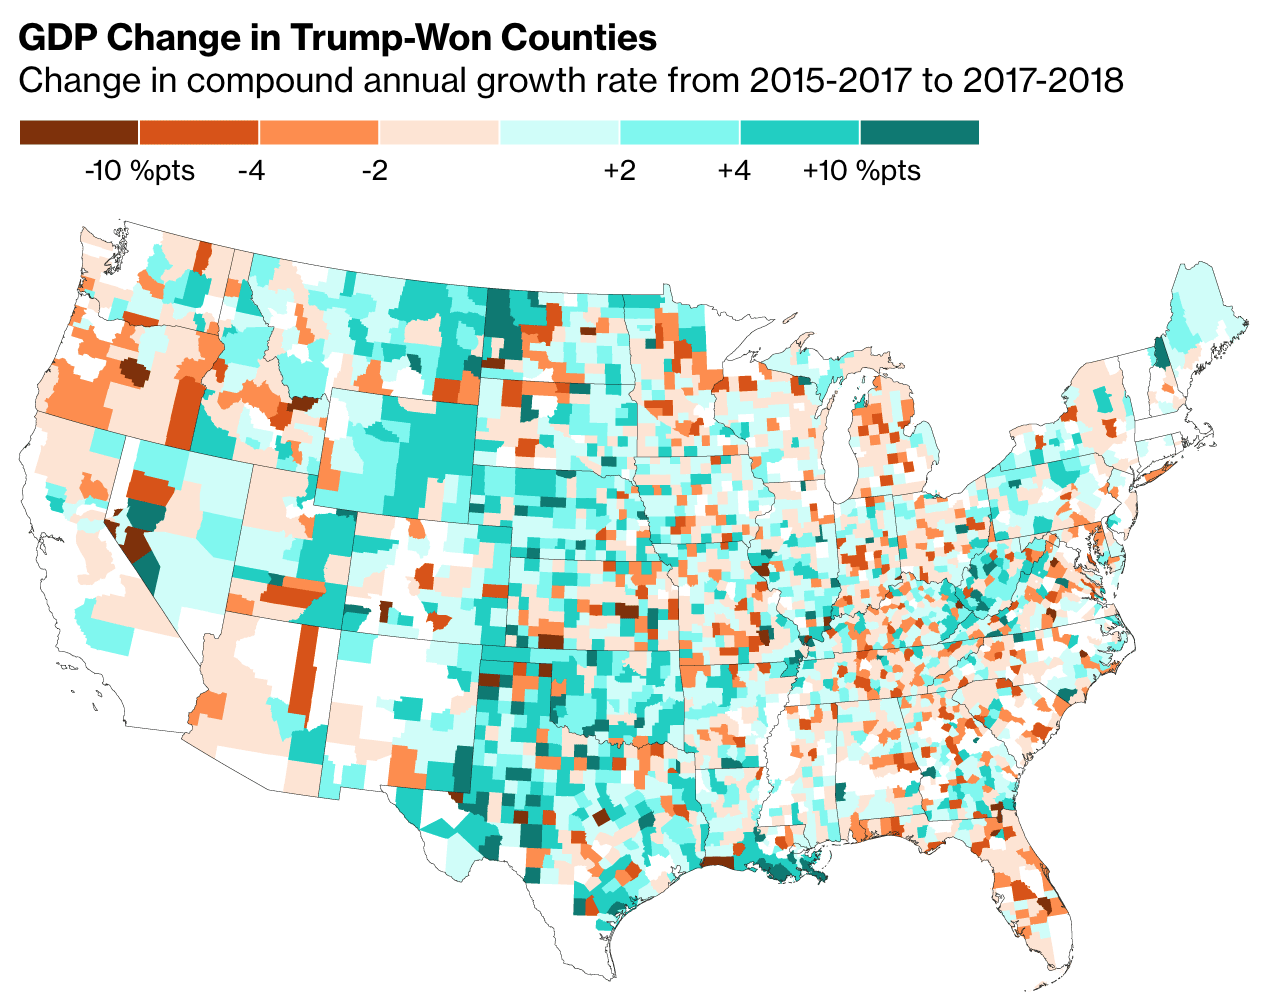
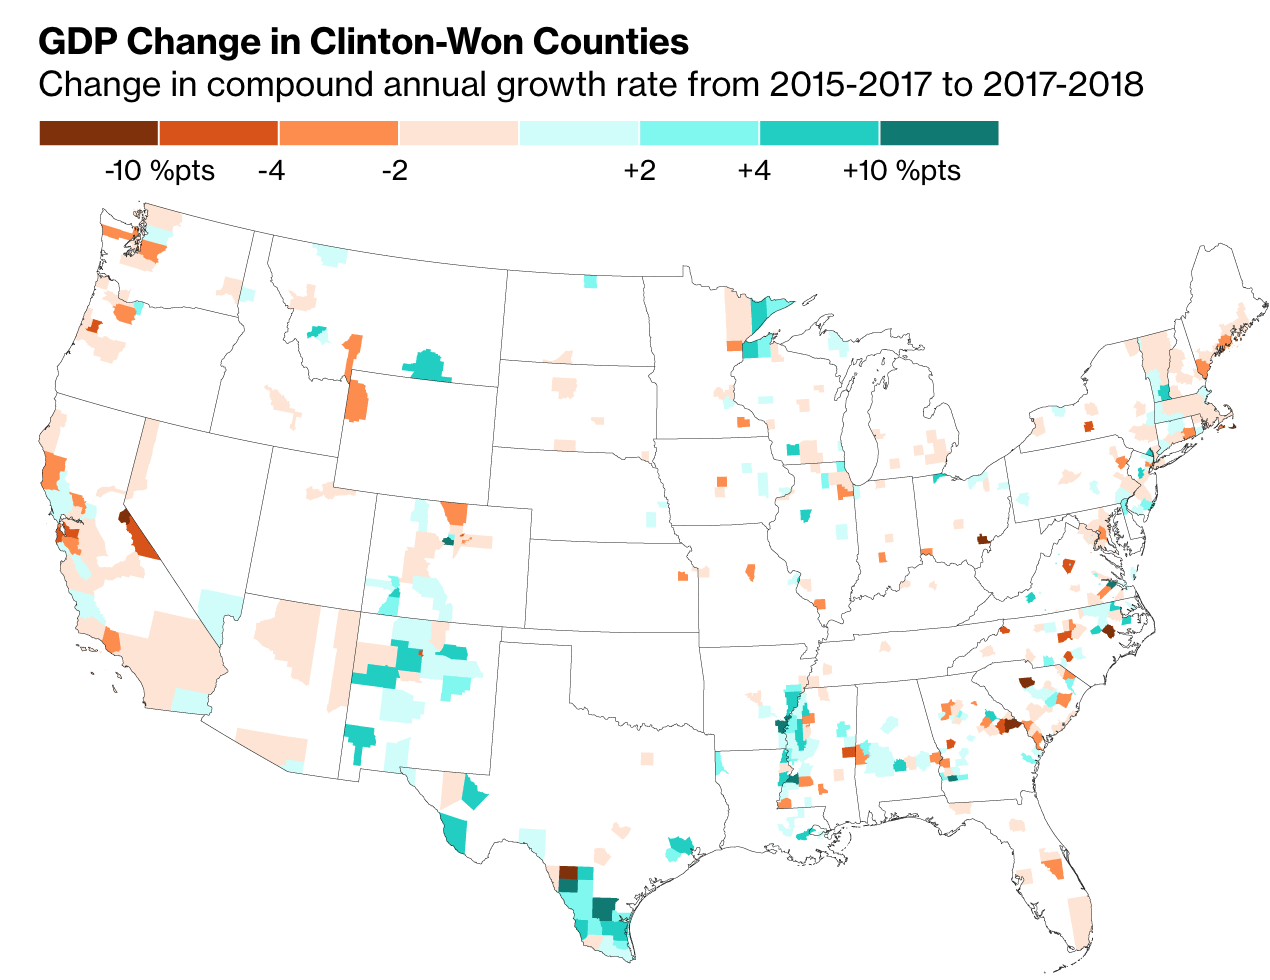
The article is not terribly complicated. We have four choropleth maps at the county level. Two of the maps isolate Trump-won counties and the other two are Clinton-won. For each candidate we have a GDP growth and an employment growth map.
In the Trump-won maps, the Clinton-won counties are white, and vice versa. Naturally, because the Democratic vote is greatest in the large cities, which, especially on the East Coast, are in tiny counties, you see a lot less colour in the Clinton maps.
Design wise, I should point out the obvious that green-to-red maps are not usually ideal. But the designers did a nice job of tweaking these specific colours so that when tested, these burnt oranges and green-blues do provide contrast.
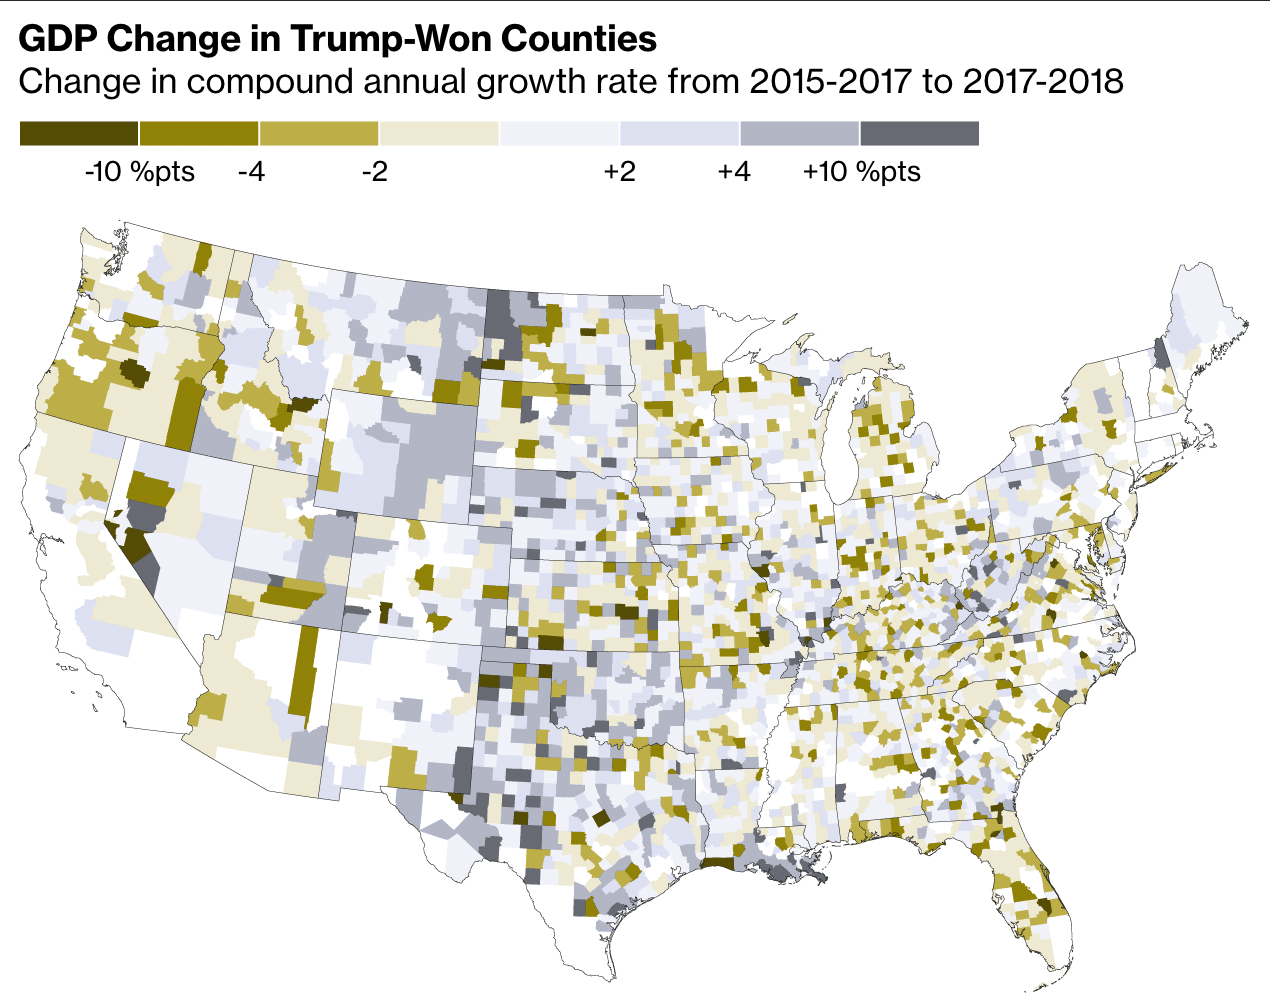
But I am really curious to see this data plotted out in a scatter plot. Of course the big counties in the desert southwest are noticeable. But what about Philadelphia County? Cook County? Kings County? A scatter plot would make them equally tiny dots. Well, hopefully not tiny. But then when you compare GDP growth and employment growth and benchmark them against the US average, we might see some interesting patterns emerge that are otherwise masked behind the hugeness of western counties.
But lastly. And always. Where. Are .Alaska. And. Hawaii? (Of course the hugeness problem is of a different scale in Hawaii. Their county equivalents are larger than states combined.)
Credit for the piece goes to the Bloomberg graphics department.