
This past weekend I continued looking at the spread of COVID-19 across the United States. But in addition to my usual maps of Pennsylvania, New Jersey, Delaware, Virginia, and Illinois, I also looked at the number of cases across the United States adjusted for population. I then looked at the five aforementioned states in terms of new cases to see if the curve is flattening. Finally, I looked at the number of hospital beds per 1000 people vs the number of cases per 1000 people.
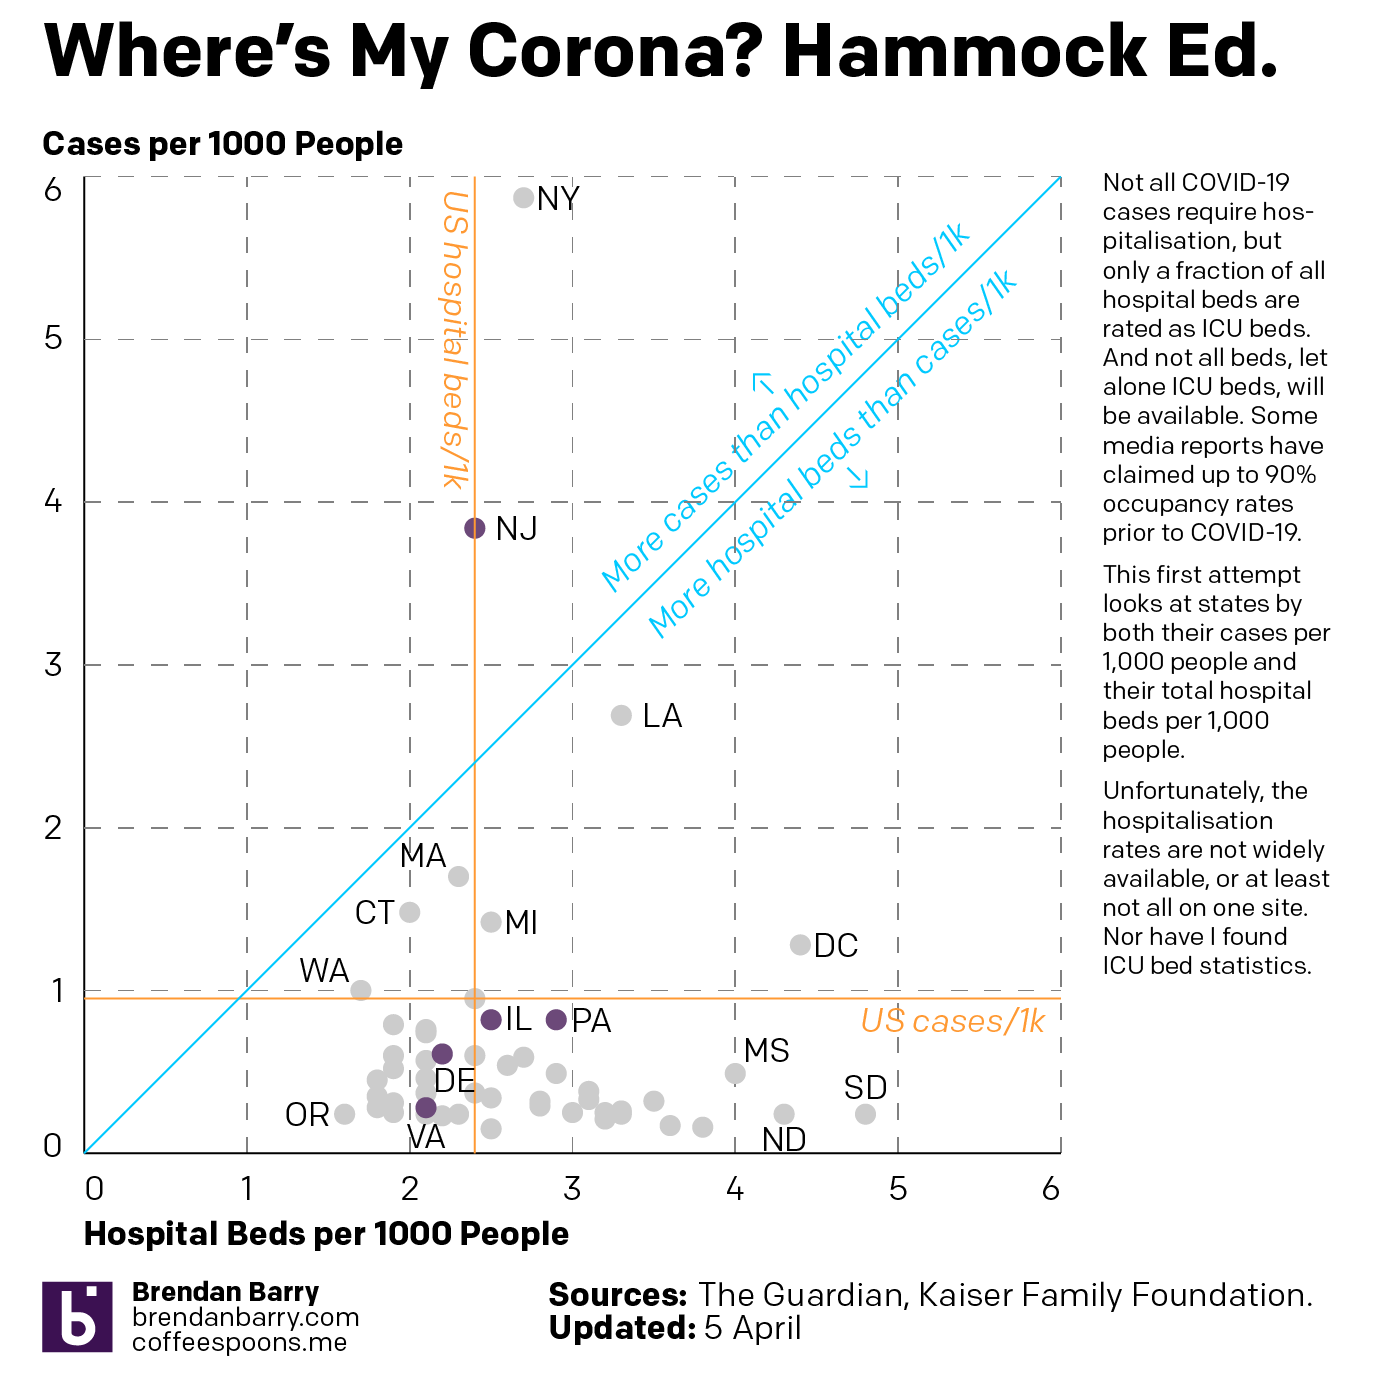
The latter in particular I wanted to be an examination of hospitalisation rates vs ICU beds, which are a small fraction of total hospital beds. But as I could not find that data, I made do with overall cases and overall beds.
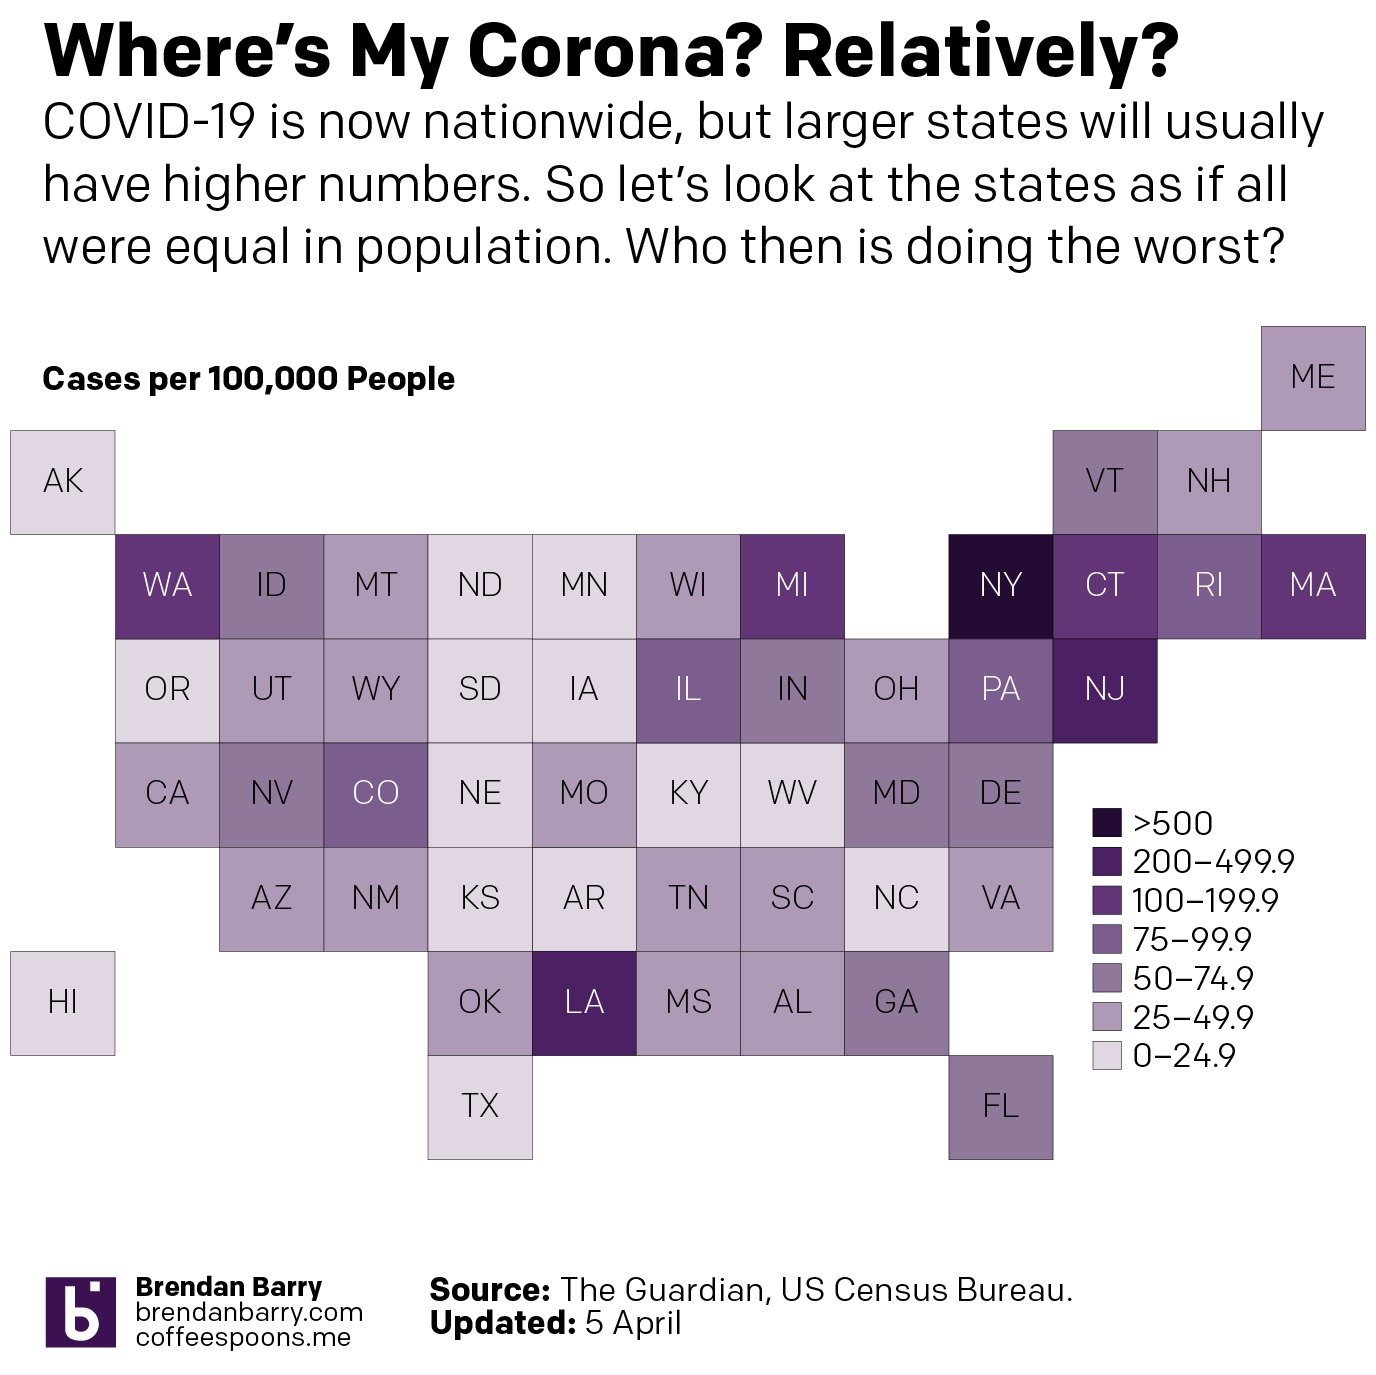
So first let’s look at the cases across the U.S. What you can see is that whilst New York and New Jersey do have some of the worst of the impact, Washington is still not great and Louisiana and Michigan are also suffering.
And then when we look at the states by their cases per 1000 people and their hospital beds per 1000 people, we see that the states often claimed to be overwhelmed, New York, New Jersey, and Washington are all well over the blue line, which indicates an equal number of beds and cases per 1000 people, or near it. Because it is important to remember that not all beds are the type needed for COVID-19 victims, who often require the more fully kitted out ICU beds. Additionally, not all cases are severe enough to warrant hospitalisation.
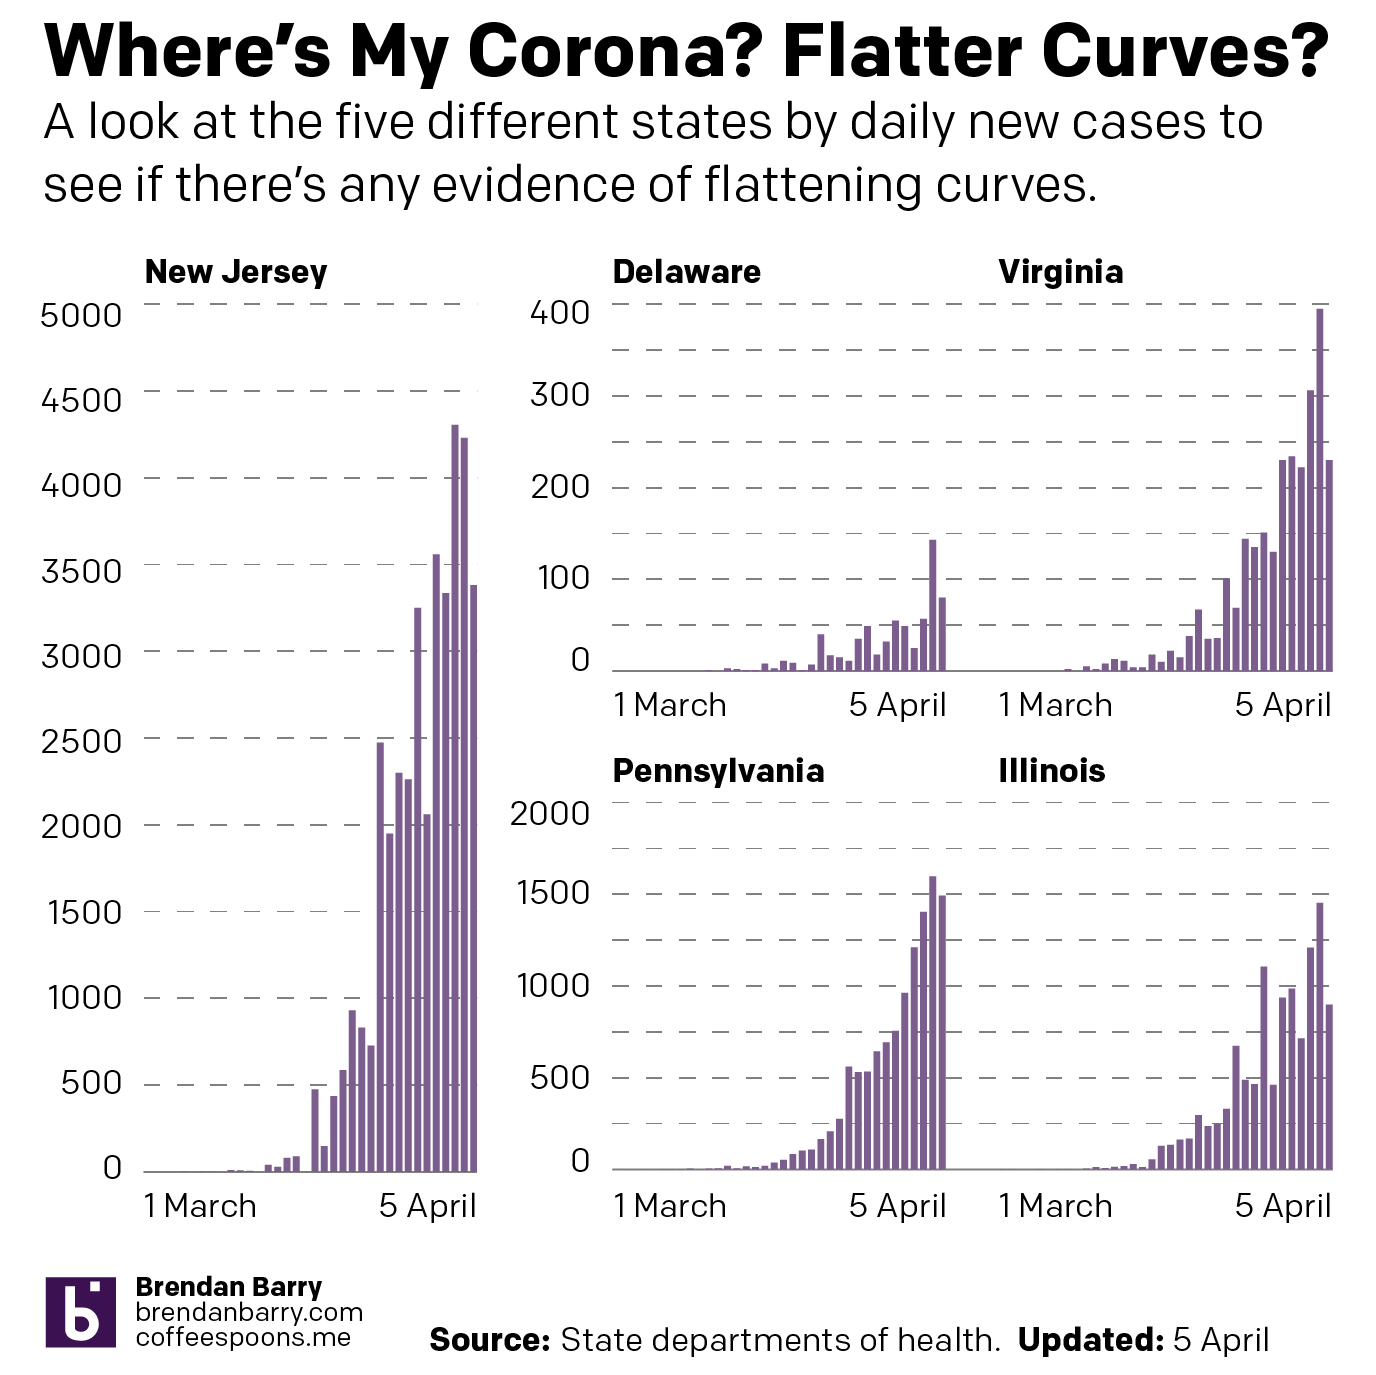
Then from the broader national view, we can look at the states of interest. Here, those of you who have been following my social media posts, you can see fewer dark purples in these maps. That’s because I have adopted a new palette that has sacrificed granularity at the lower end of the scale and added it at the top, a particular need in New Jersey and the Philadelphia and Chicago metro areas. And finally we look at the daily new cases to see if that curve is flattening.
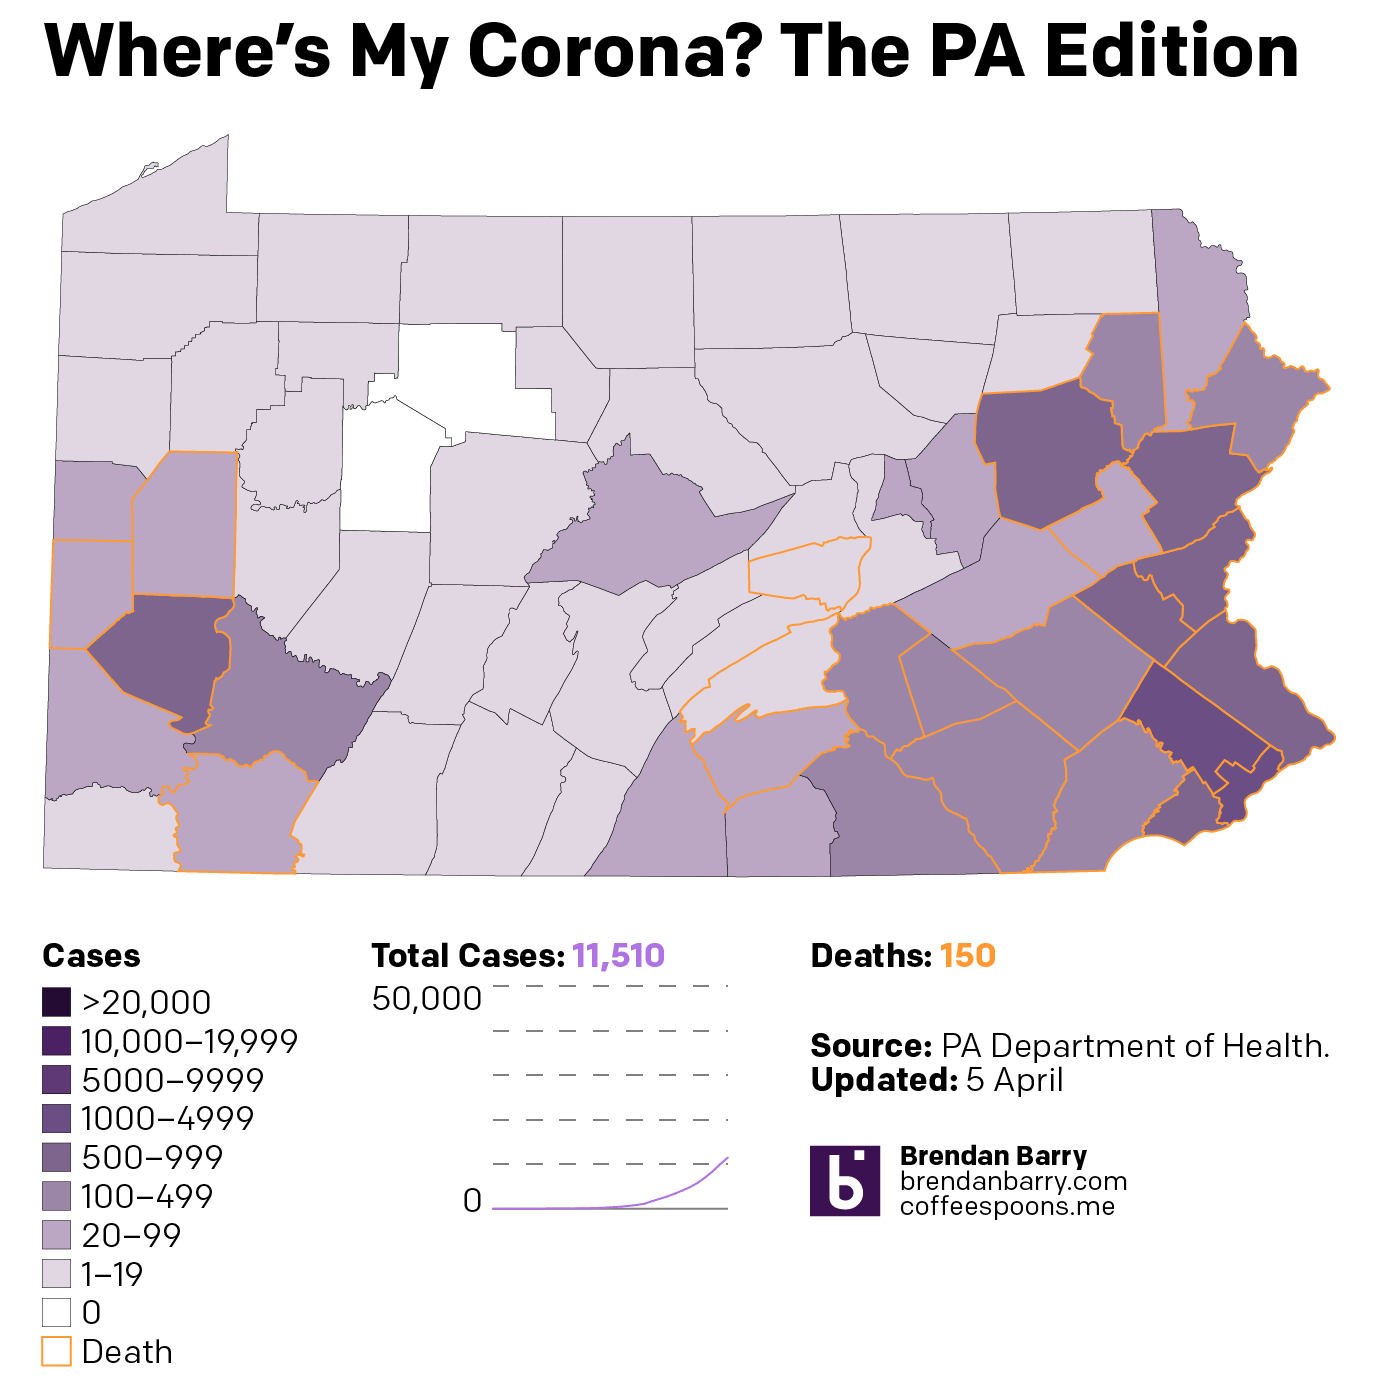
Pennsylvania now has almost every county infected. But unlike Illinois, which has a similar infection rate but more unaffected counties, Pennsylvania has fewer cases in its big city, Philadelphia, and has more cases in the smaller cities and towns.
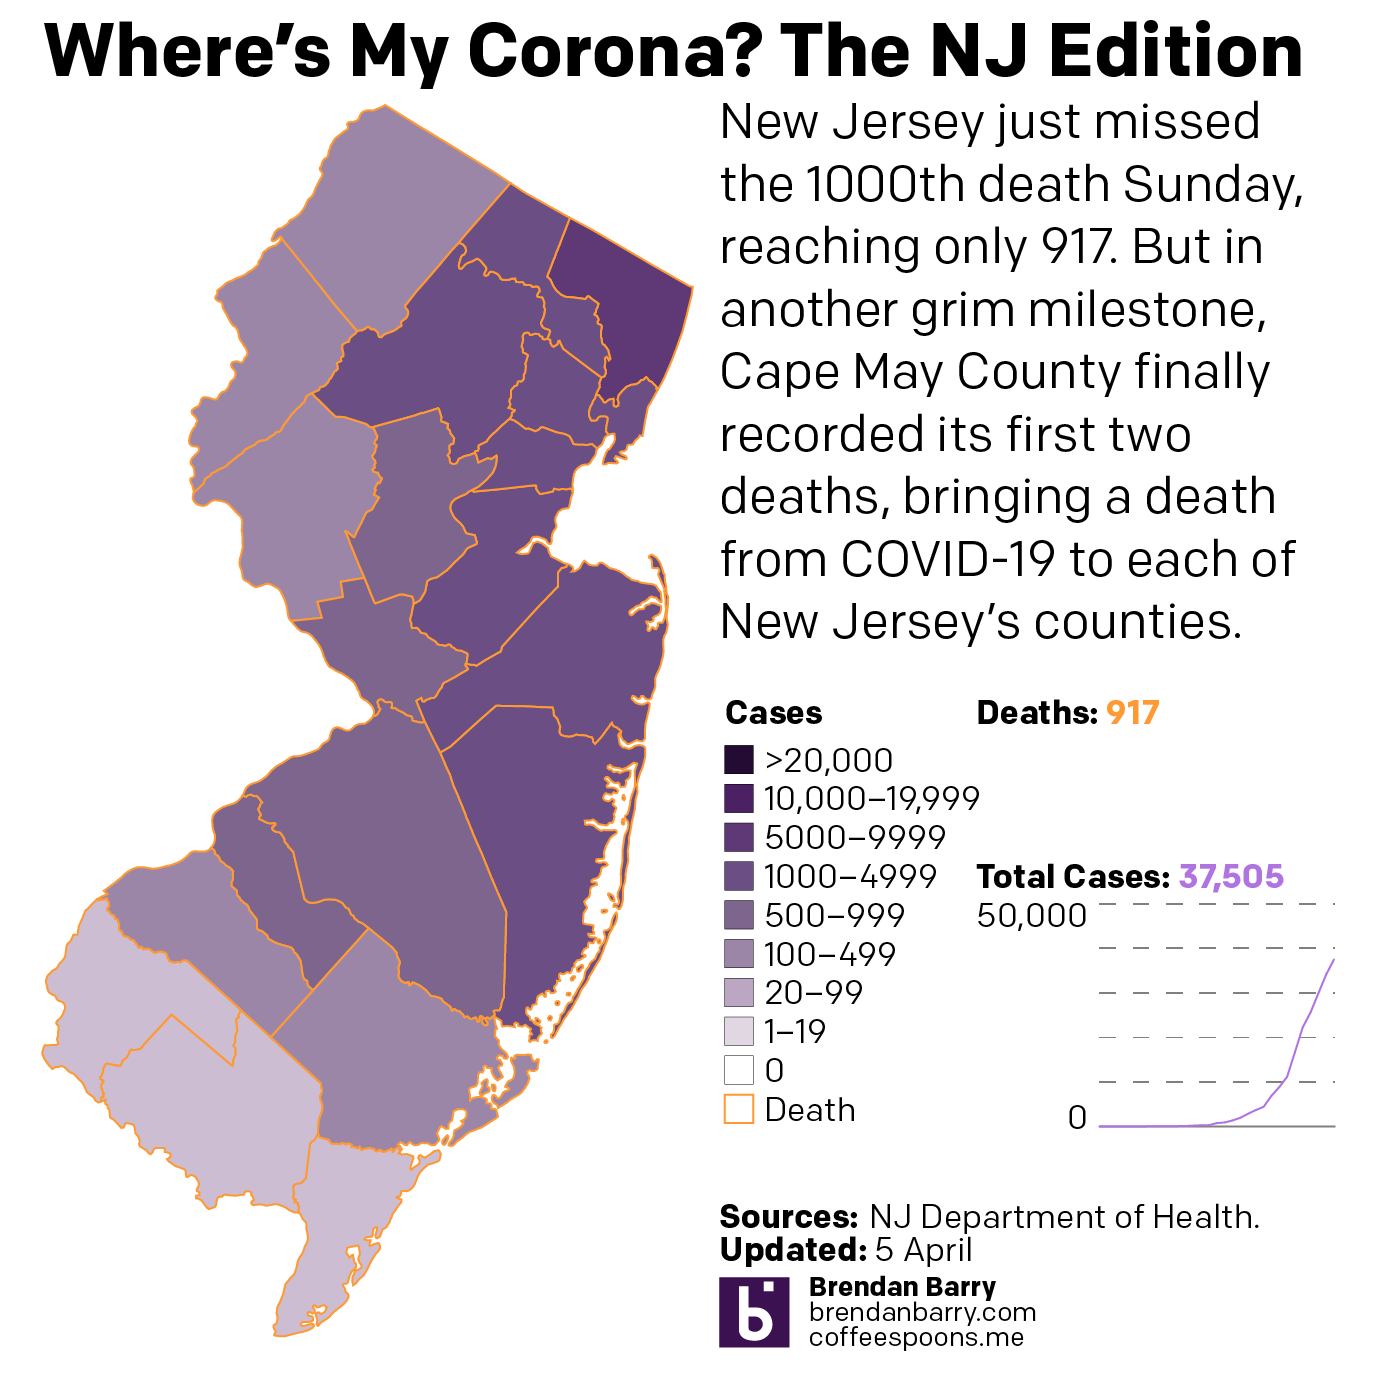
New Jersey is just a disaster. Deaths are now reported in every county—so I can probably remove those orange outlines. The only potential good news is that new cases for the second day in a row were fewer than the day before. It could be a blip. But it could also be a signal that the peak of infection has or is nearing. That said, hospitalisations and deaths are lagging indicators and could take two weeks to follow the positive test results. So in the best case scenario that this is a peak, New Jersey is far from out of the woods.
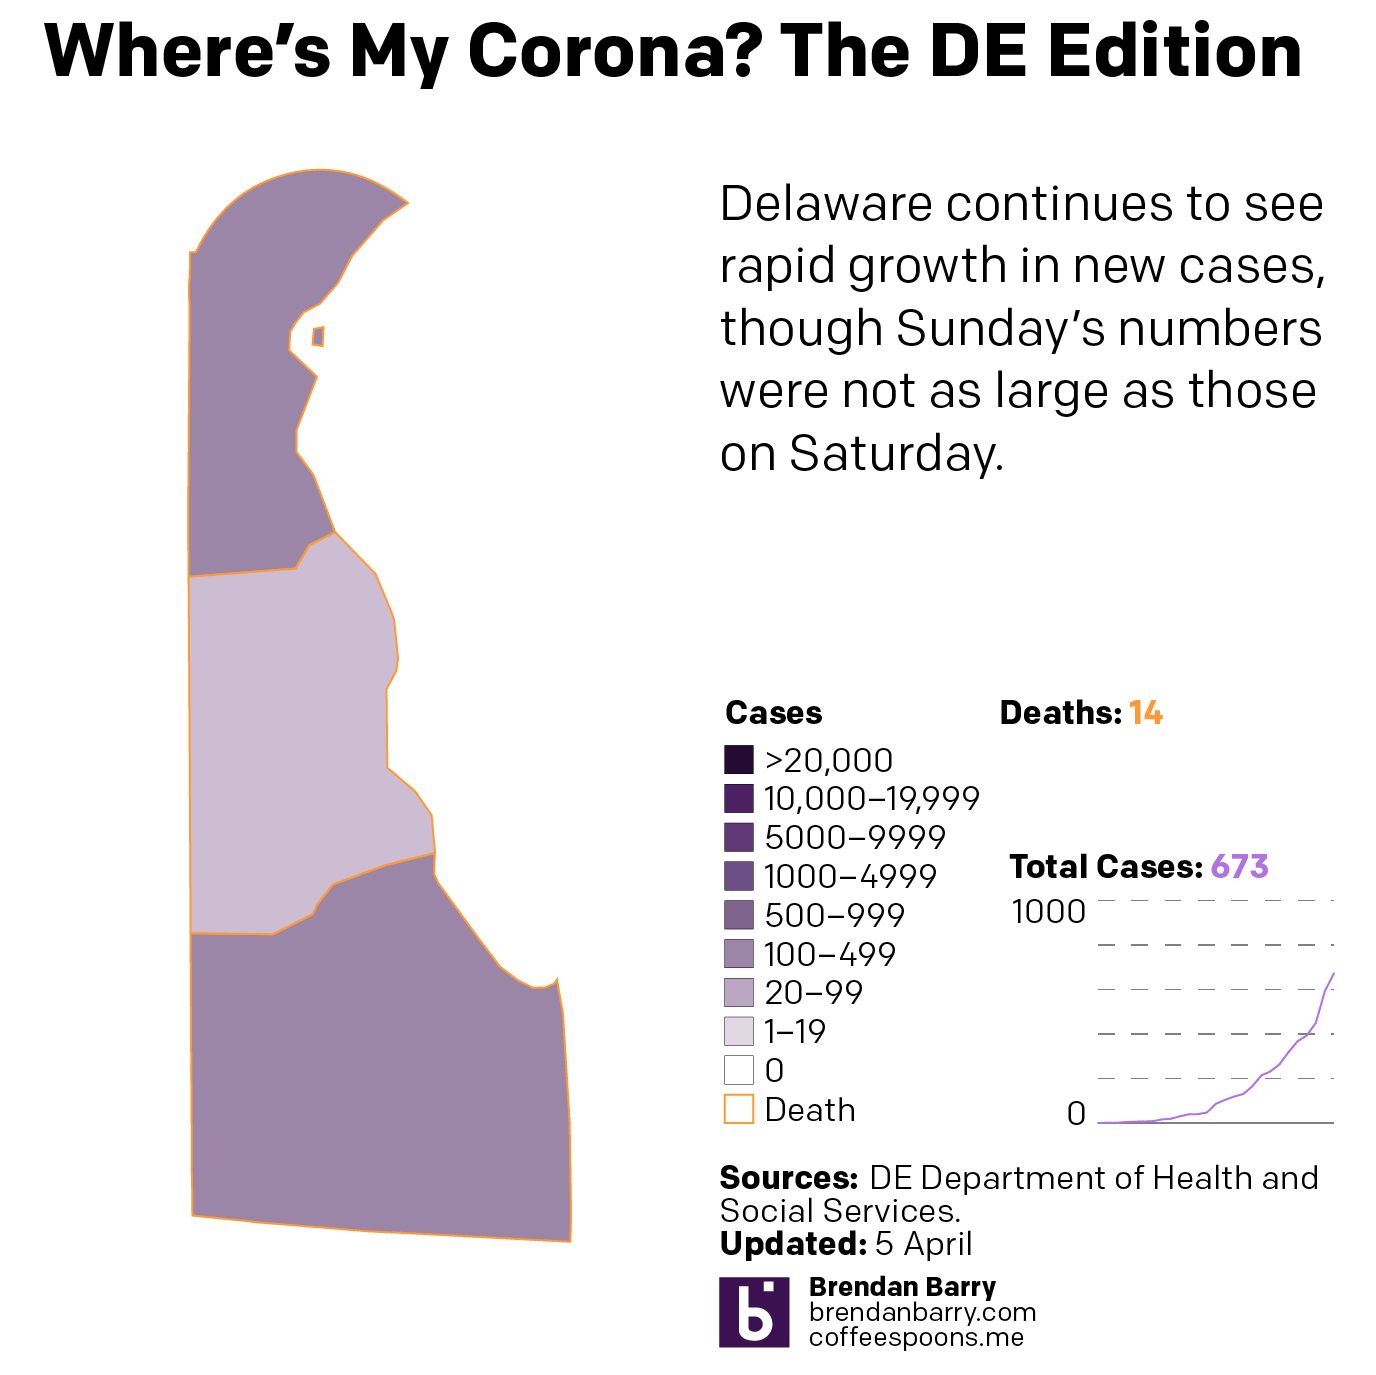
Delaware is the smallest state I look at—and one of the smallest in the union overall—but its cases are worryingly increasing rapidly, although like every state I examine in detail it had fewer new cases Sunday than Saturday.
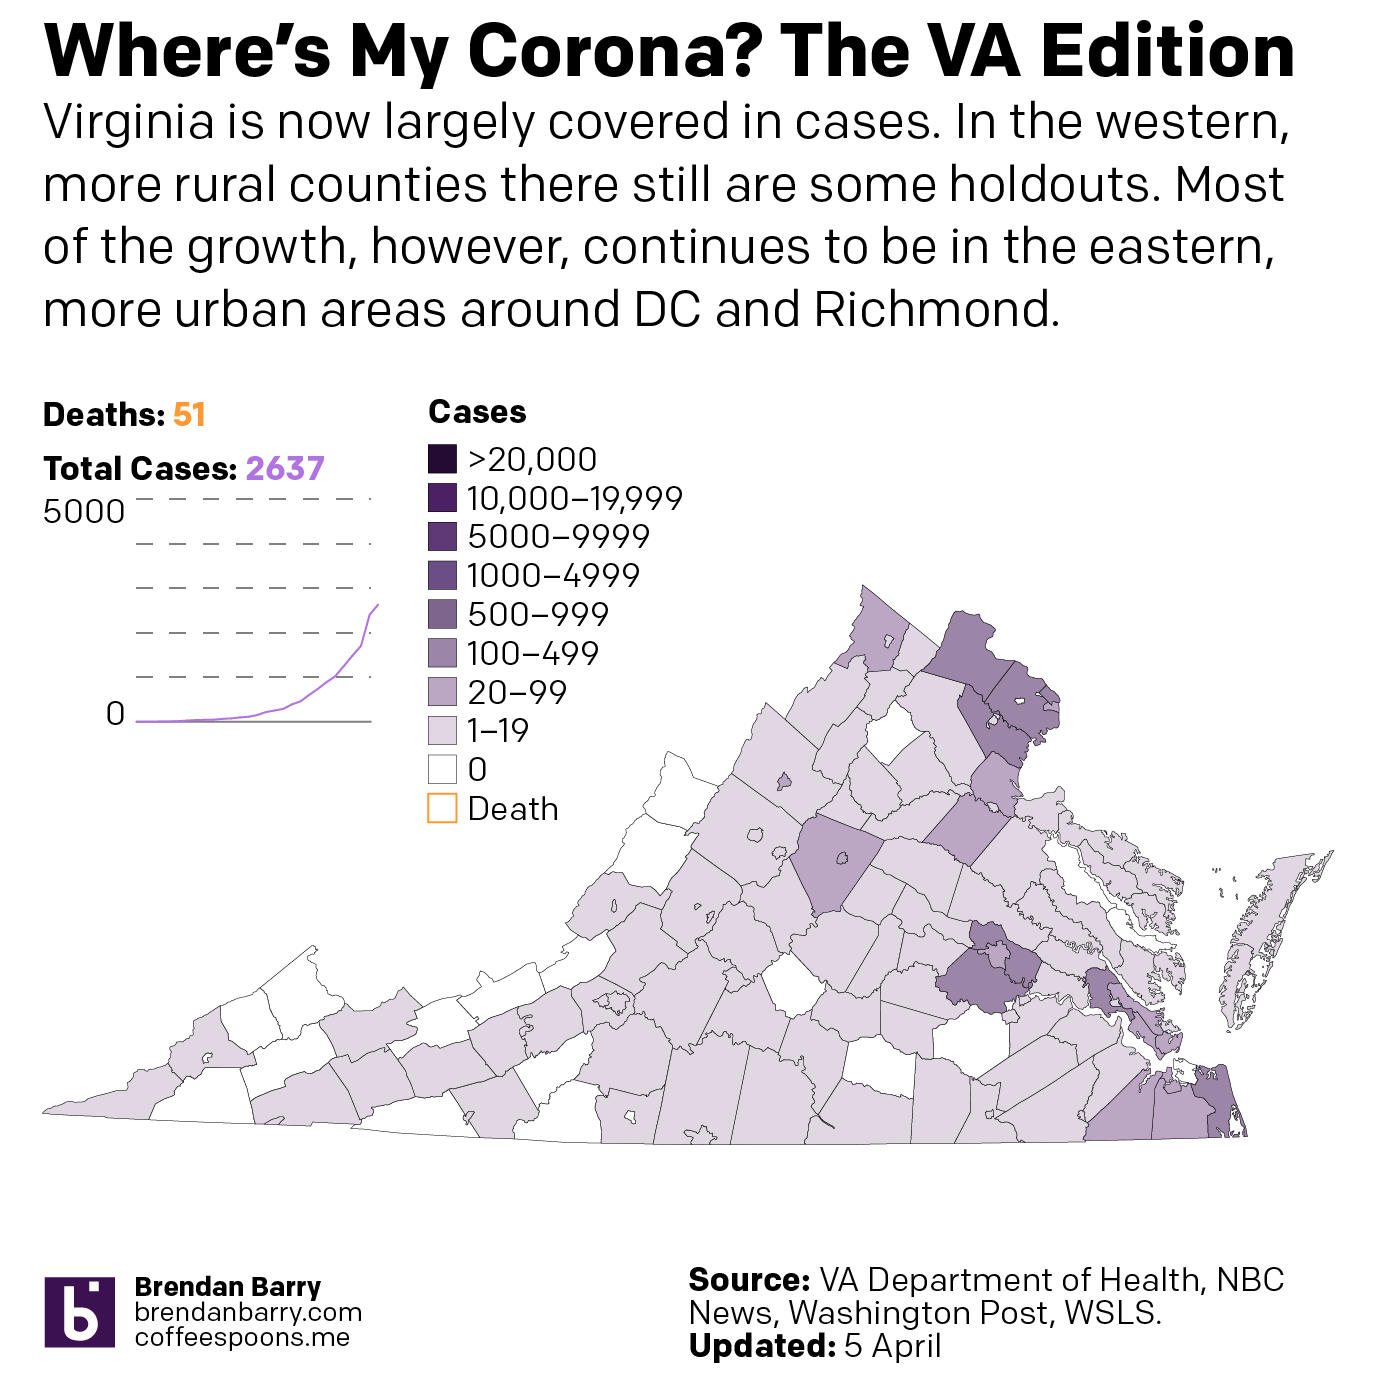
Virginia is in a better spot overall than the other four states. You can see that in the national map above. And most of Virginia’s cases are concentrated in the DC and Richmond areas as well as the cities along the peninsulas jutting into the Chesapeake.
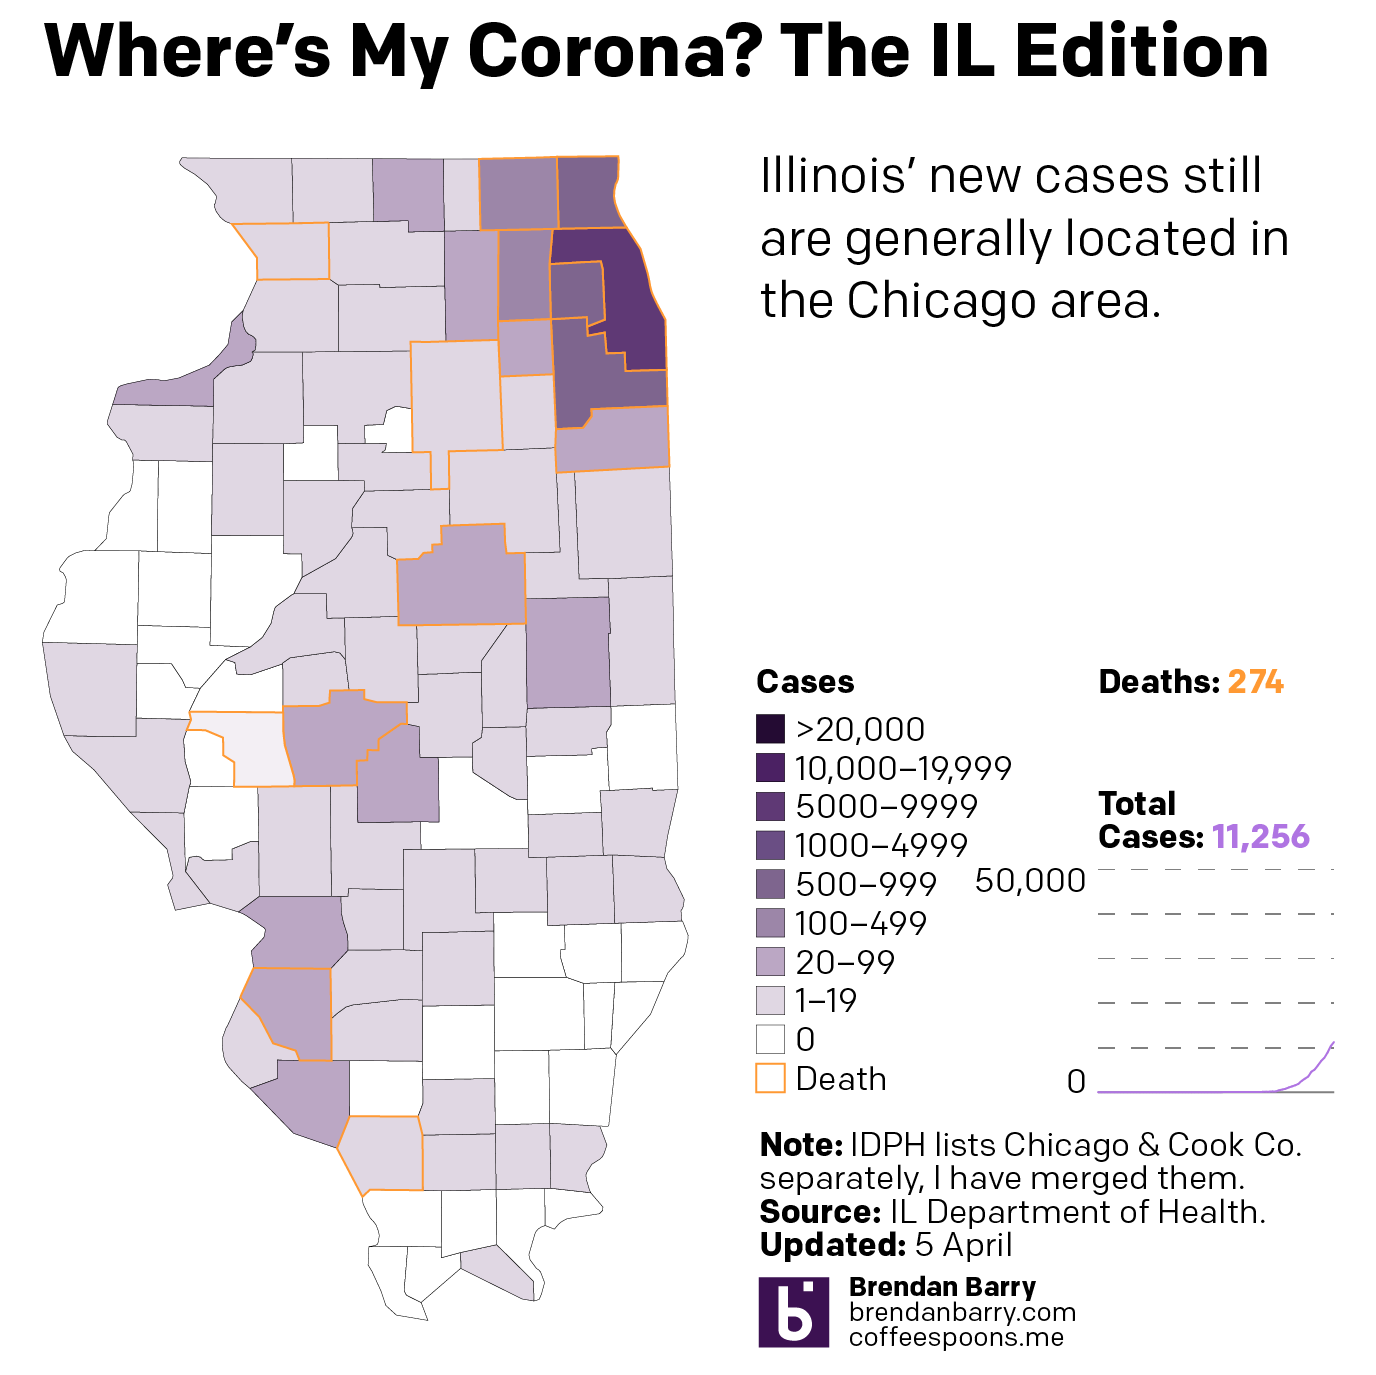
Illinois is, as noted above, similar to Pennsylvania in terms of infections. In terms of deaths, however, it is doubling Pennsylvania’s numbers. And most of its cases are located in and around Chicago. Big chunks of downstate Illinois are unaffected or lightly affected compared to the Commonwealth.
Finally, as I noted in New Jersey, could these lower numbers Sunday than Saturday be meaningful? Possibly. But in all five states? Highly unlikely. Regardless, we can look at the number of daily new cases and see if that curve of infection is flattening. We should wait several days before beginning to make that assessment. But one can hope.
All of this is to say that things are bad and likely will continue to get worse. But I will keep looking at the data daily and presenting it to the public to keep them informed.
Credit for this piece is mine.