
Weekend data means, usually, lower numbers than weekdays. And with the exception of Delaware that’s what we have today. Some drops, like Illinois, are more dramatic than others, like New Jersey. And so we look at the seven-day trend.
And that tells a slightly different story. On the one hand we have states like Virginia and Illinois that appear to be continuing upward. The rise in Illinois has been slow and steady, but the average is approaching nearly 2000 new cases per day. In Virgina, the rise was more abrupt and the question is whether this peak has crested in recent days or if come the middle of next week it will resume rising.
In New Jersey and Delaware we see two states with does declines after some sudden spurts of new cases. Jersey had risen to nearly 500 new cases less than two weeks ago, but that’s now back down to fewer than 350. And in Delaware, while today’s number is greater than yesterday’s, the trend is still downard after being at over 100 new cases per day two weeks ago.
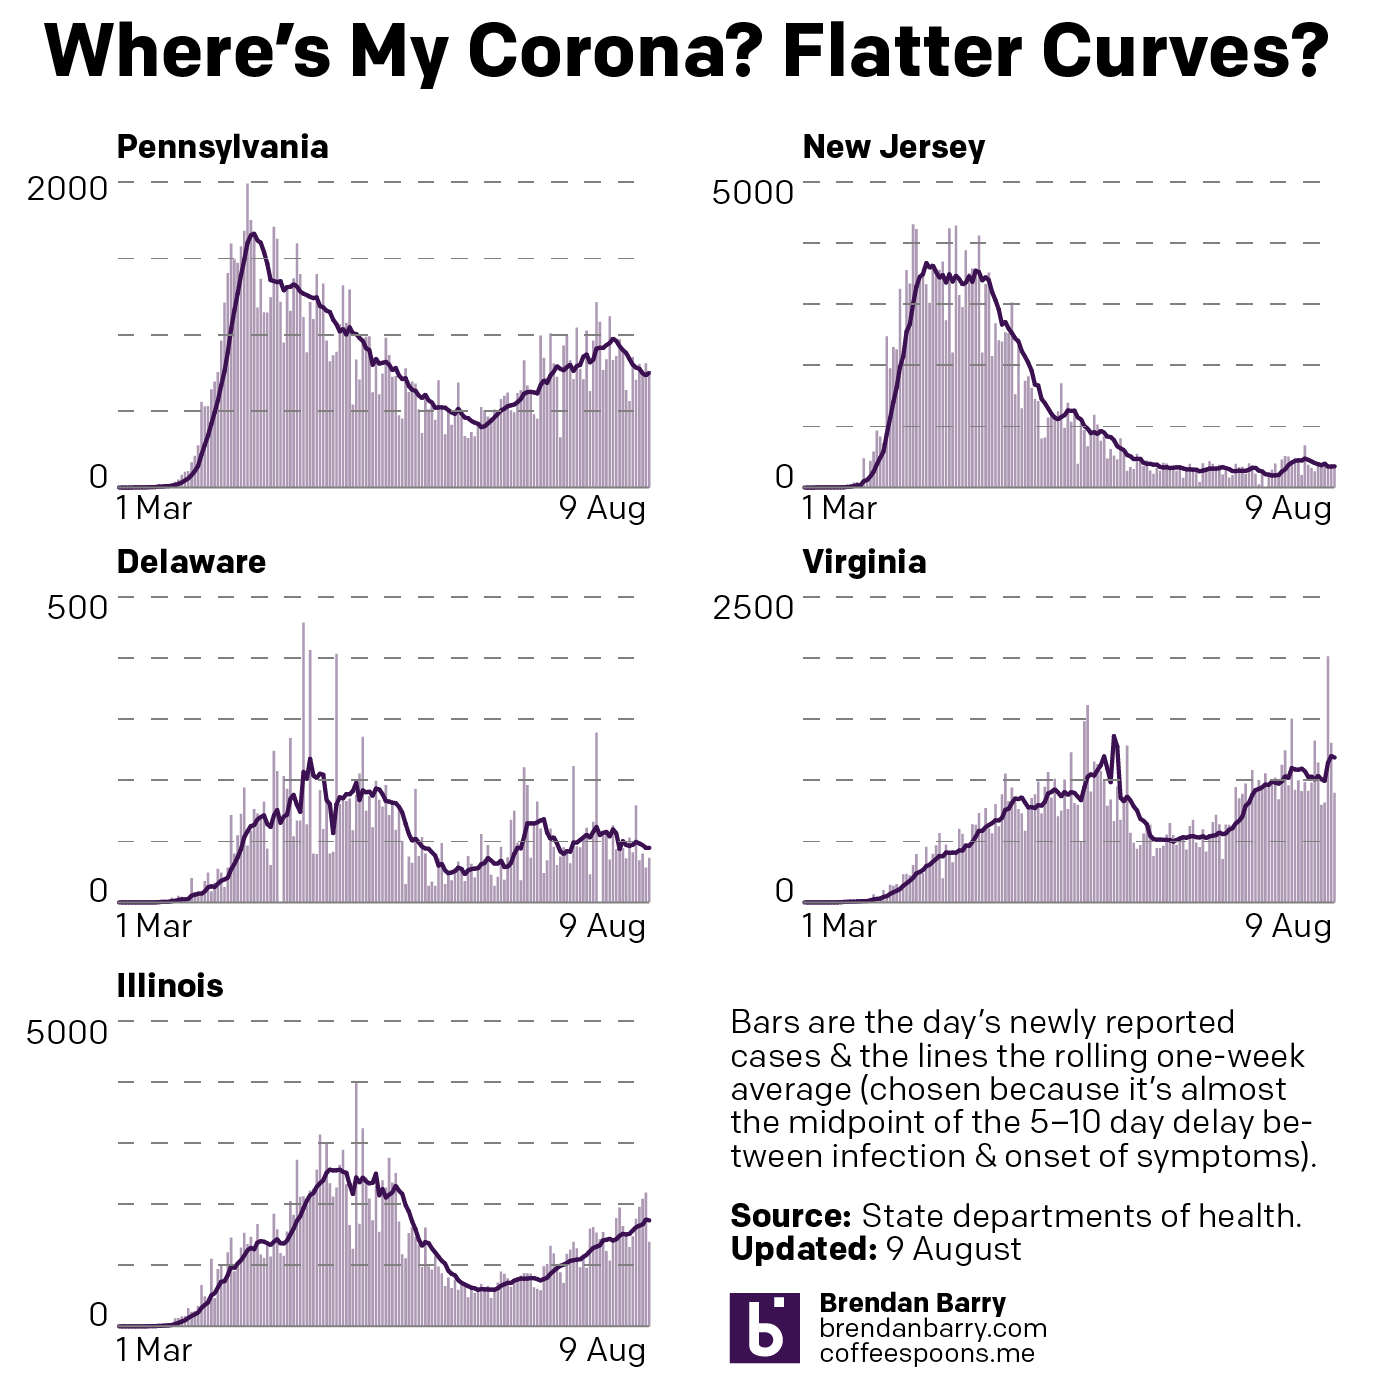
Then we have Pennsylvania. At one point doing it had done so well in controlling the outbreak to bend the curve to fewer than 500 new cases per day at one point. Then as the state began to reopen, cases began to rise again in the west and now the east. But over the last week that statewide average began to fall. But in the last two days that fall appears to have potentially bottomed out. So come the middle of next week, the question will be does the downward trend continue or has the state hit a new valley before another rise?
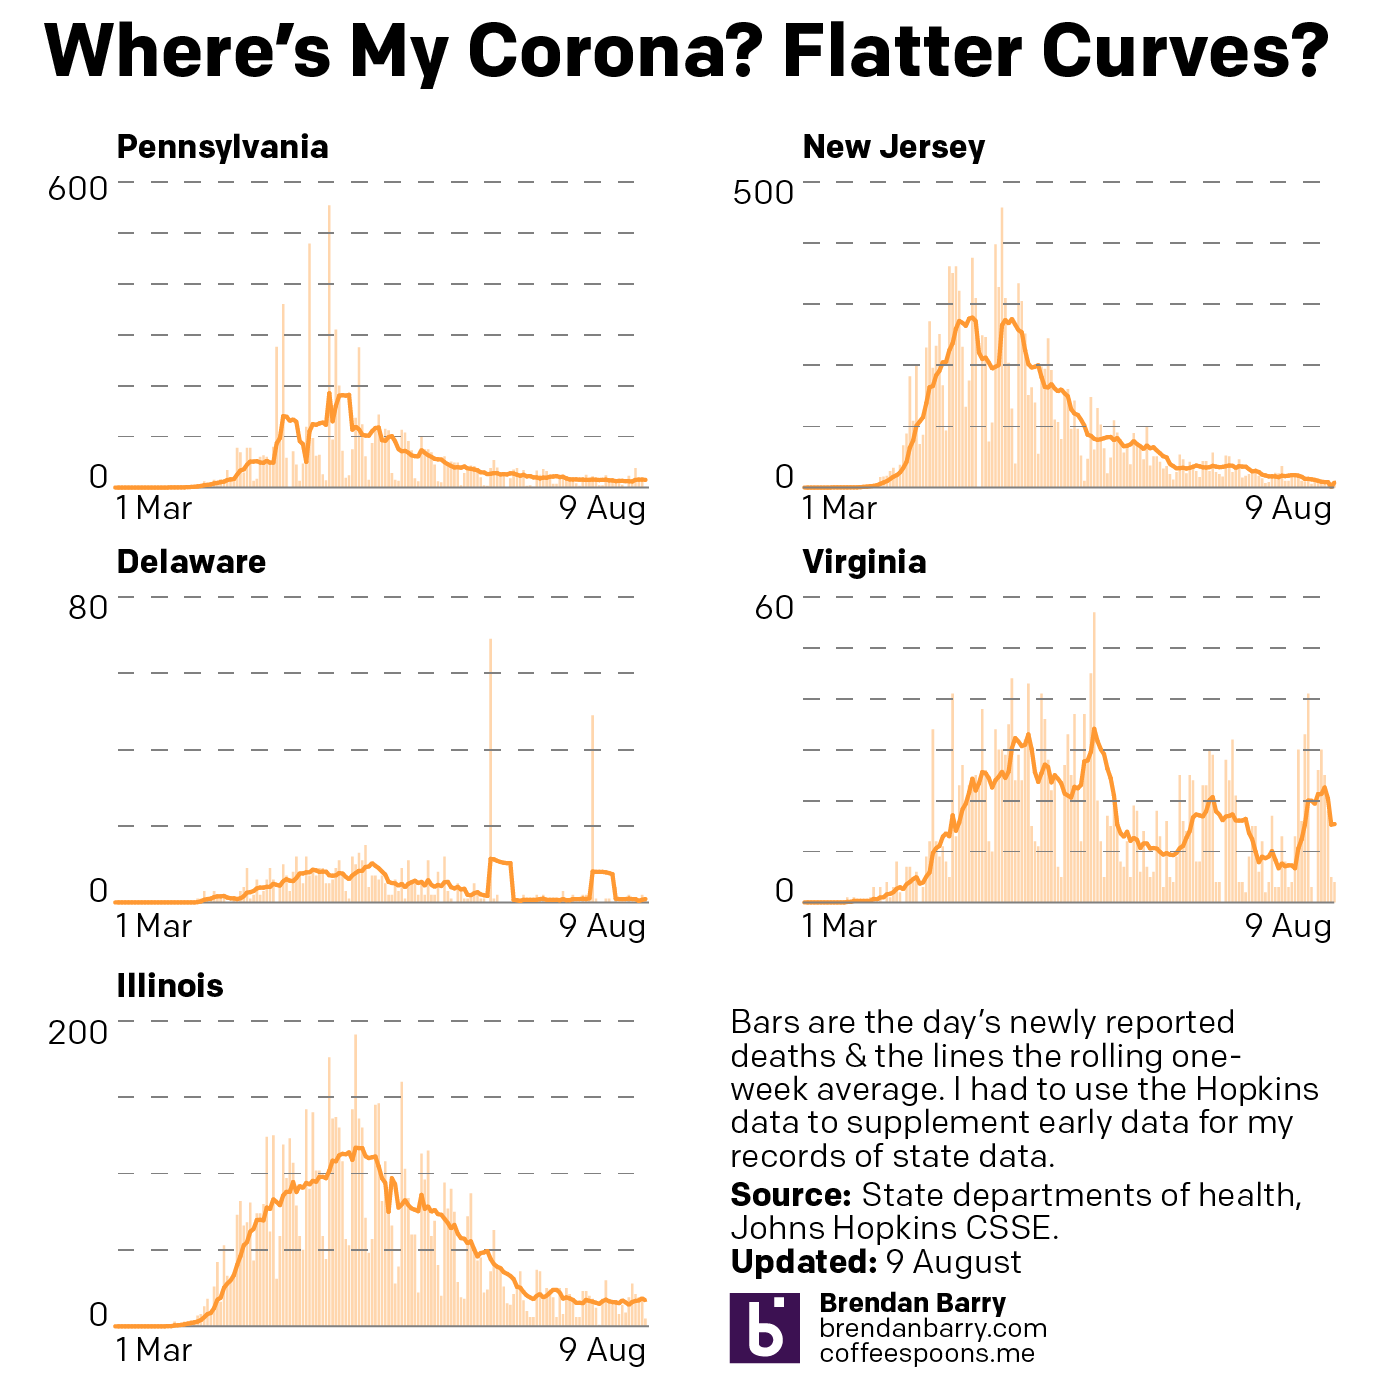
Finally, in terms of new deaths, with the exception of Virgina, we have yet to see any rise in deaths that might correlate with the recent rises in new cases. And so nothing new there. But it’s worth pointing out that New Jersey has now reached the high single digits in terms of daily deaths from Covid-19. That’s remarkable for a state that back in April saw nearly 300 people dying every single day.
Credit for the graphics is mine.