
Last week we saw some indications that the recent surge was beginning to ebb in Pennsylvania, Delaware, and Illinois with the same in New Jersey, but to a slight degree less so. Only Virginia presented us with data that showed its surge continuing unabated.
So this week we have some generally good news to look at.
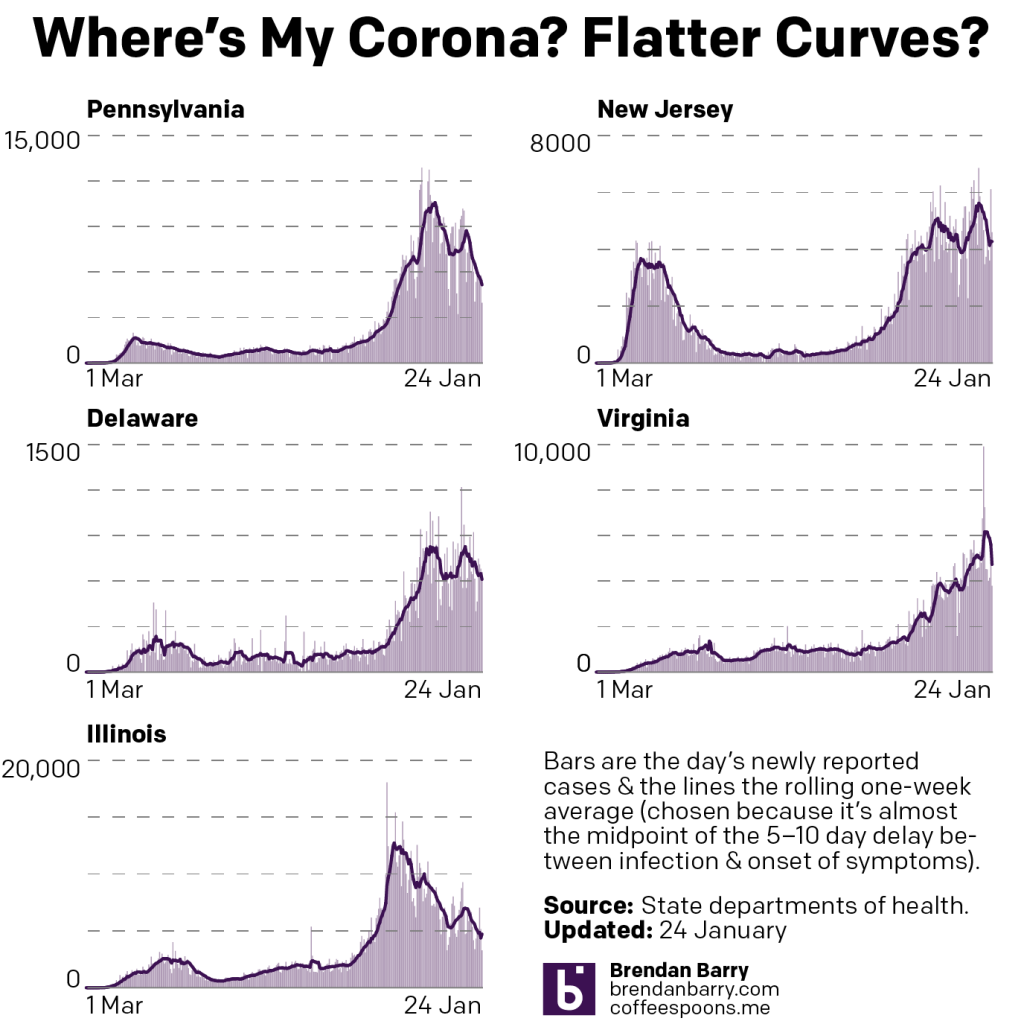
The drop in Pennsylvania, New Jersey, and Illinois appears real and sustained. Even in Virginia, we are beginning to see some signs of a decline in new cases—albeit it after a week of record reports of new cases.
Of course we should also mention that even though we are seeing declines in new cases, in no state are we close to approach low levels of community spread. Things are still bad out there, but they have gone from catastrophic spread to merely a disaster. Illinois is probably the closest to reaching summer-like levels of viral spread.
Deaths, however, because they lag behind new cases, are just now beginning to show signs of ebbing.
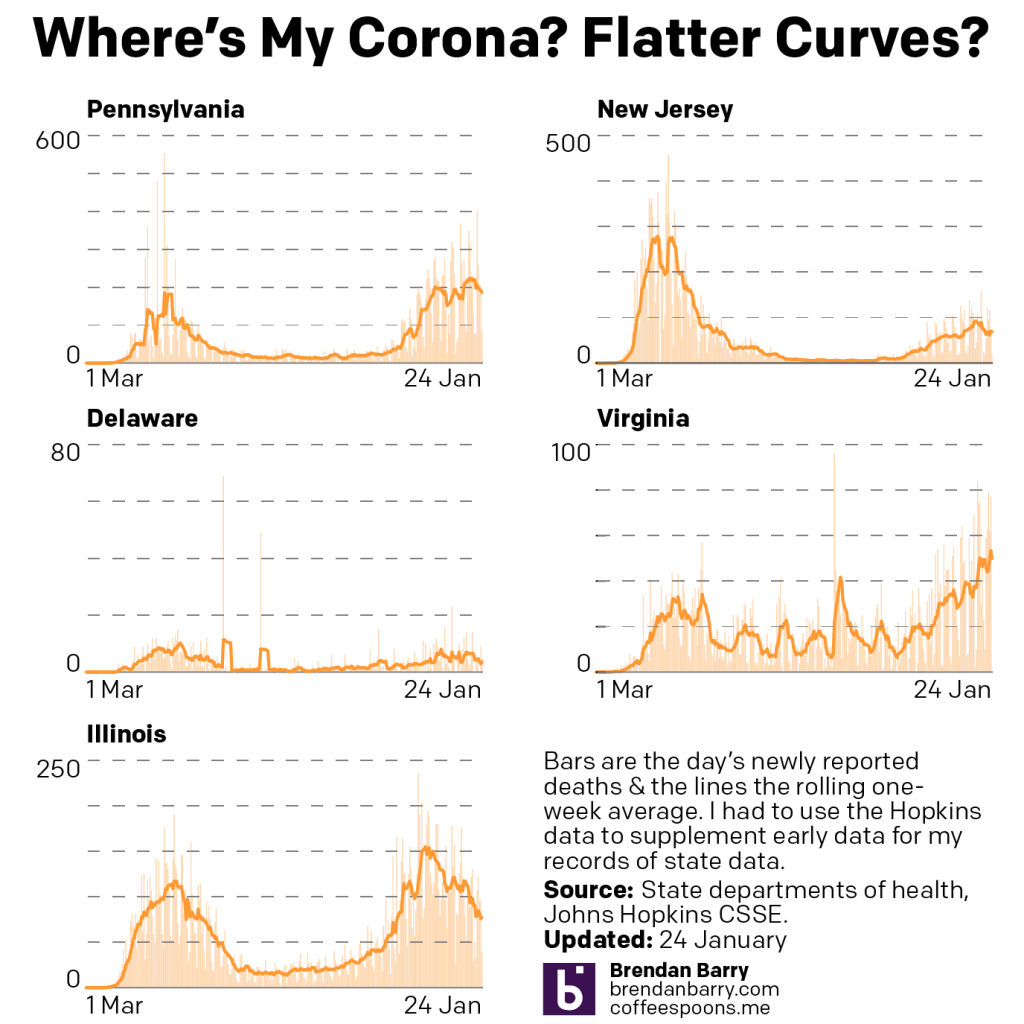
If last week’s pattern with new cases was that we were seeing positive trends in four states, we can say this week we are seeing positive trends in deaths for the same four states. Virginia is, again, the outlier.
Though I would be remiss if I noted that the declines in deaths is not nearly as pronounced as in new cases. In Pennsylvania, the seven-day trend for new deaths has appeared to have crested. But in New Jersey, recent days have suggested the decline may not be as steady. Only in Illinois are we really seeing a sustained downward trend in deaths.
And Virginia just Saturday saw its seven-day trend reach another new record, over 50 deaths per day.
But what about vaccinations?
Firstly, we still only have data for the three states of Pennsylvania, Virginia, and Illinois. Secondly, keep in mind that I am looking only at people reported fully vaccinated, i.e. they have had both their shots—both Pfizer’s and Moderna’s vaccines require two shots.
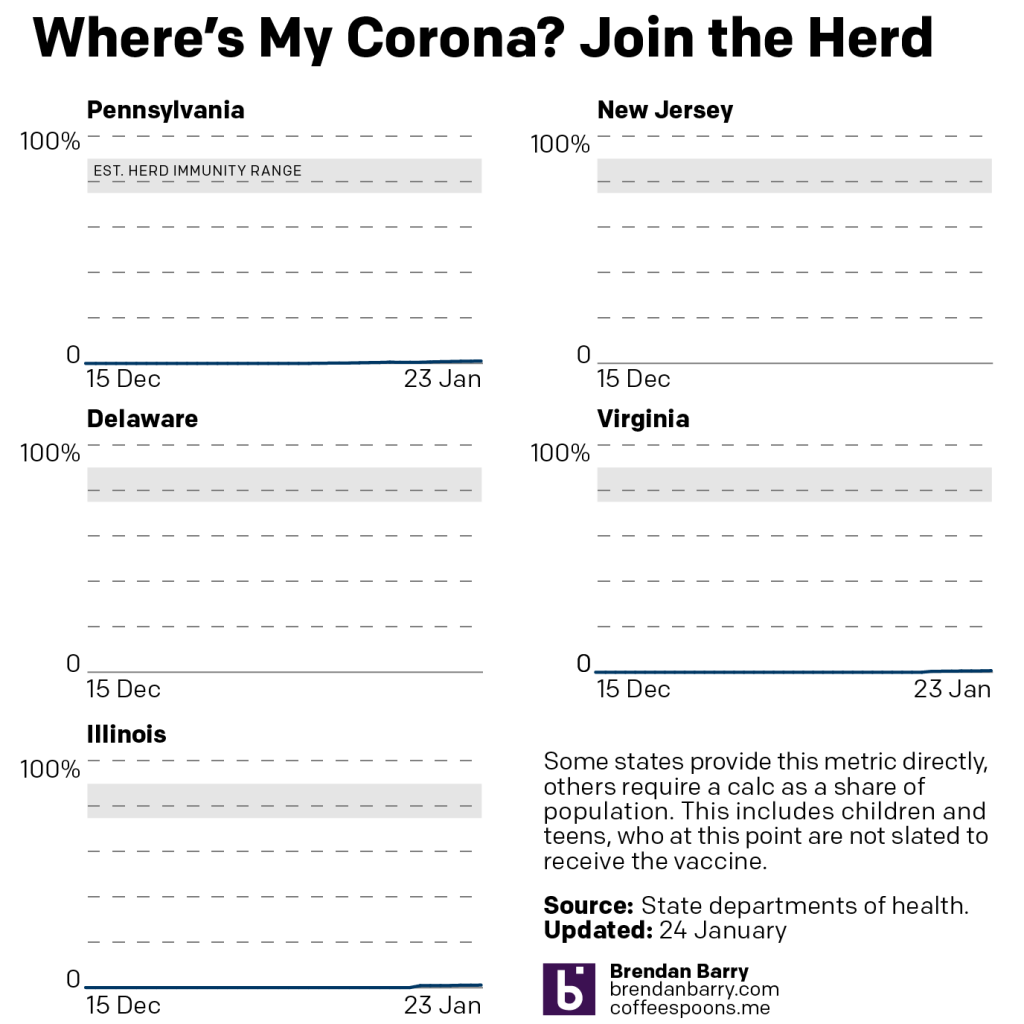
There’s not a lot to report on yet, other than that both Pennsylvania and Illinois reached the 1% threshold. I think that for most people, however, that you can begin to see their respective lines easing off the 0% baseline. Virginia lags behind those two states, however, with just 0.5% of its population reported as fully vaccinated.
I’m curious to see if I cannot find some additional/alternative data sources for New Jersey and Delaware next weekend. I don’t love the idea of mixing data sources, but after a few weeks, we haven’t really seen any improvements to the data sharing from those states.
That said, I should also note that the new US administration has identified data transparency as an issue—or the lack thereof—in the current vaccination programme and is working to develop national and state-level dashboards to inform the public.
Credit for the piece is mine.
One thought on “Covid-19 Update: 24 January”