
I missed last week’s posting on an update to Covid-19. Two weeks on from the last post, things in the states of Pennsylvania, New Jersey, Delaware, Virginia, and Illinois continue to improve, albeit with a few fits and starts. But the downward trend nonetheless can be seen in the new cases charts.
Consider that in the charts from two weeks ago, we saw downward slopes, but a look at the charts in the two weeks hence shows some blips.
Another thing to keep in mind is that a major snowstorm disrupted testing and vaccinating operations in the northeastern states of Pennsylvania, New Jersey, and Delaware. The storm, which also hit northern Illinois and Virginia, also likely impacted those states but to lesser degrees.
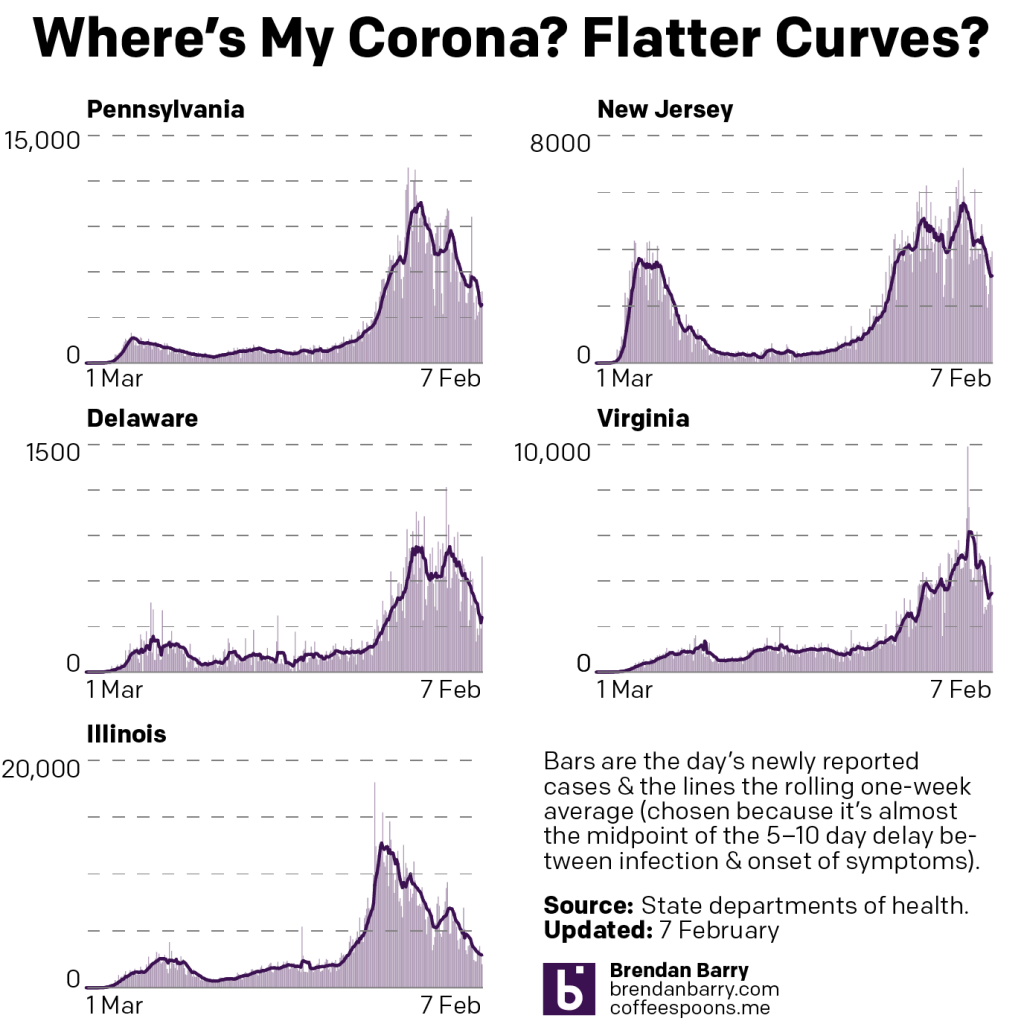
That means the downward trends in new cases could be slightly exaggerated in those states. Consequently, rebounds next week should be taken with a grain of salt. Indeed, Sunday’s data releases from the tri-state area were greater than we might normally see with weekend data.
When we at deaths, however, we see a more muddled picture.
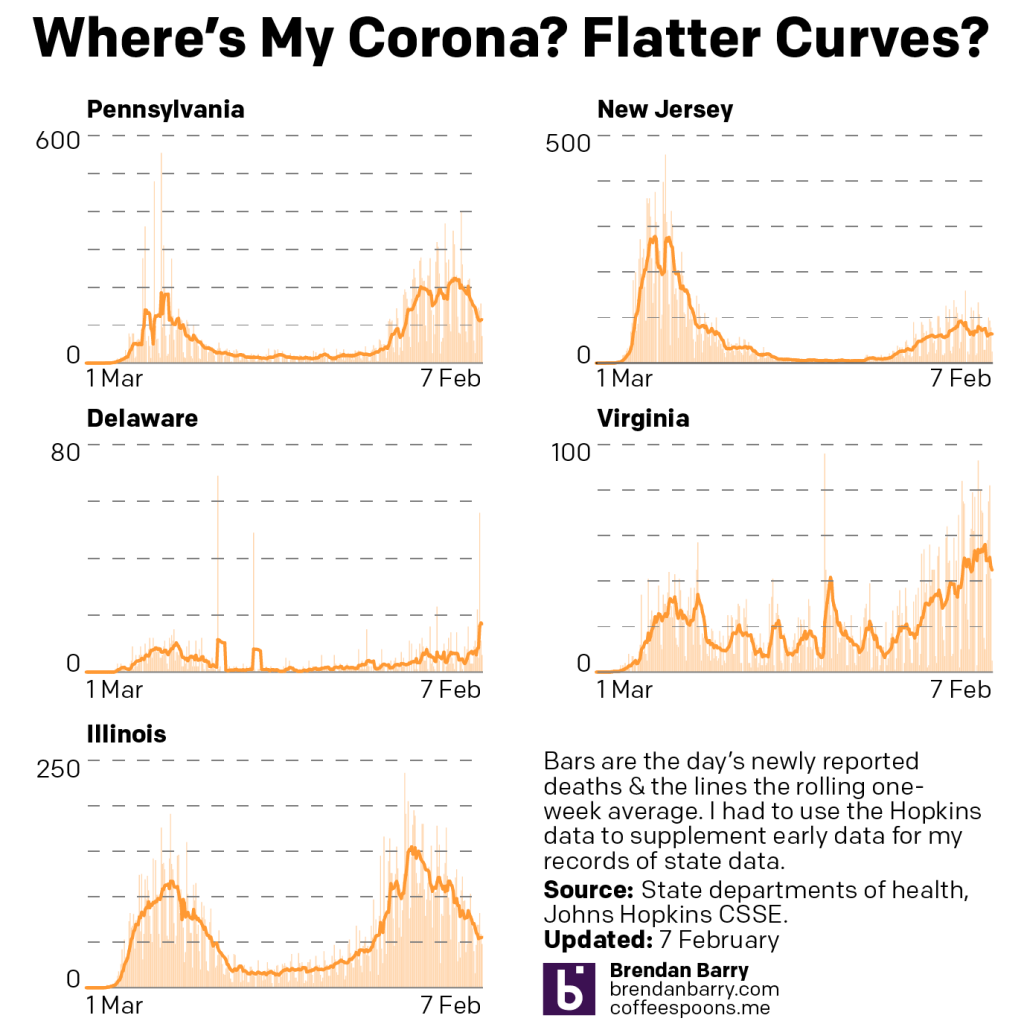
In states like Delaware and Virginia, the average death rate is now higher than it was two weeks ago. In New Jersey, the rate is down slightly, but after two weeks of it being largely up and so all in all, largely a wash. Instead, it’s only in Pennsylvania and Illinois where we any real improvements in the average death rate. Both states are down and look to continue heading down.
Finally, we look at vaccinations and the percent of state populations that have been fully vaccinated.
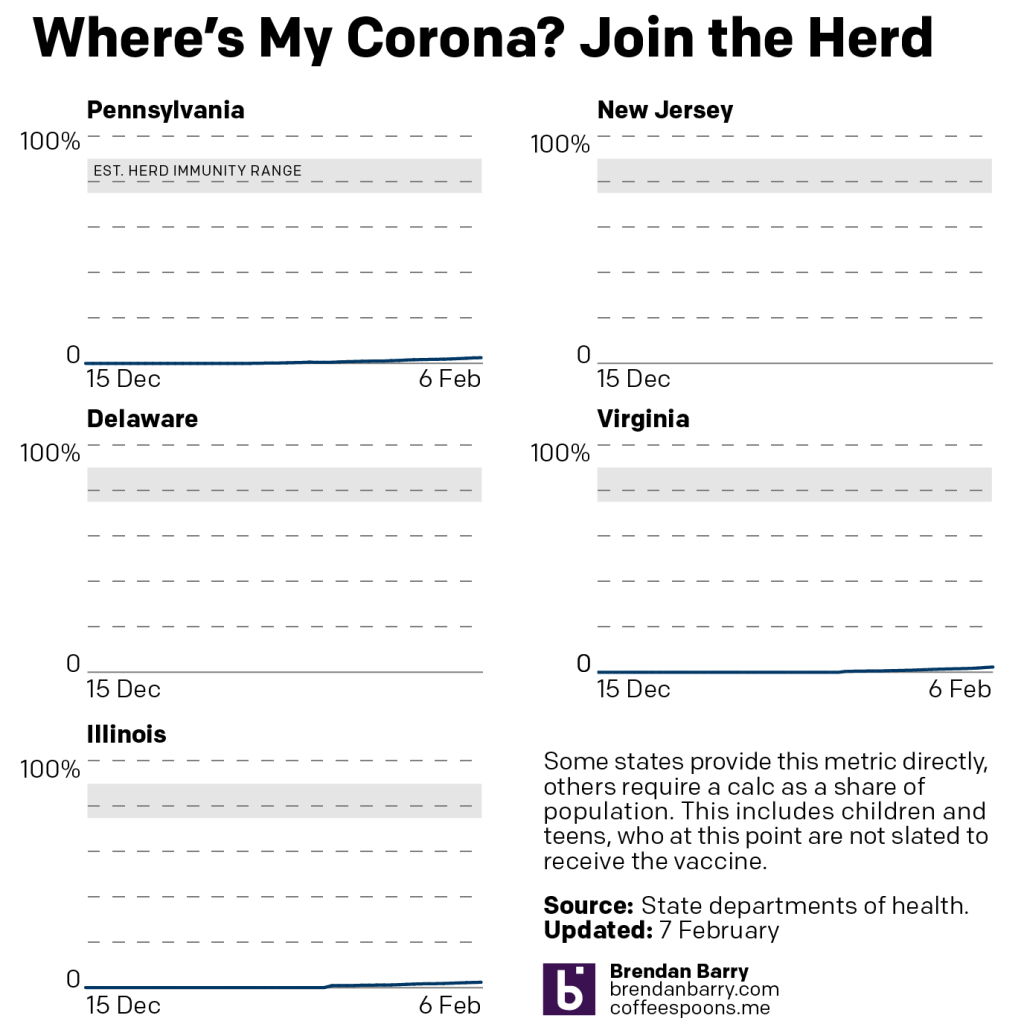
Two weeks ago, Pennsylvania and Illinois had just reached 1%. Neither New Jersey nor Delaware is reporting similar data, so both those states remain outside our consideration set. But, all three remaining states—Pennsylvania, Virginia, and Illinois—are now over 2%. Pennsylvania reports at least 2.5%—the city of Philadelphia reports separately from the statewide Department of Health, but does not update its figures at the weekend and so is likely higher. Both Virginia and Illinois have reached 2.3% full vaccination.
Credit for the piece is mine.
One thought on “Covid Update: 7 February”