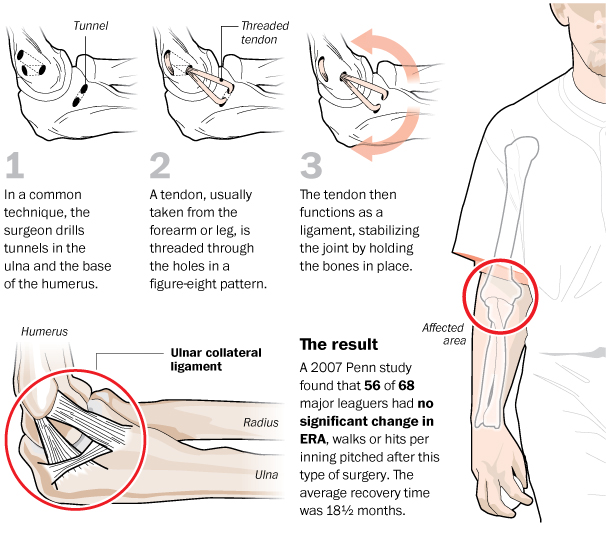
Time for some sports. Okay, I’m admittedly thinking of it because company softball started up again. And for some reason, the teams have a horrible habit of horrendous injuries. So what better way to commemorate (a week late, whatever) the start of the season than a nice illustration of Tommy John surgery. For those of you unfamiliar with it, in baseball the injury that requires the procedure typically befalls pitchers—though not always—and keeps them away from the game for at least a year.
Tommy John surgery
Credit for the piece goes to Bonnie Berkowitz and Alberto Cuadra.
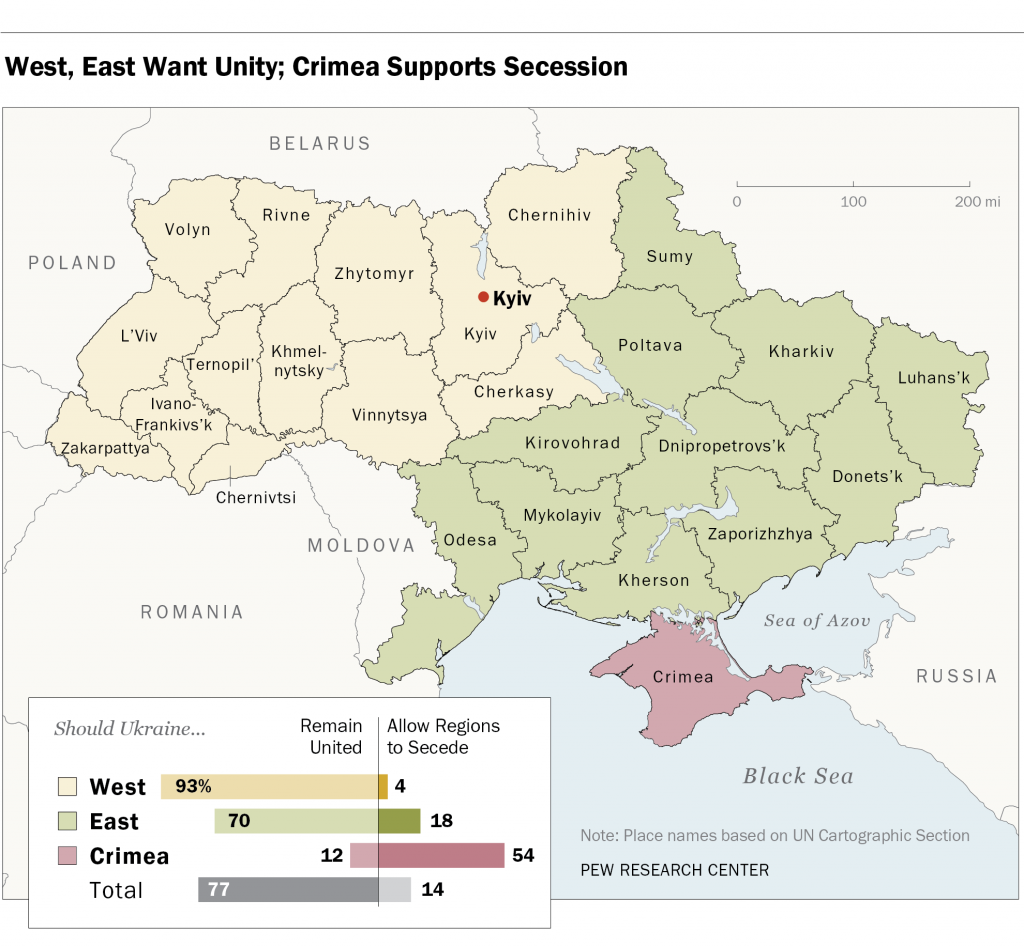
In the votes held this past weekend, the separatists in Donestk and Luhansk claim they received a mandate for independent states. However, according to polls conducted by Pew a few weeks back, most of Ukraine, with the notable exception of Crimea, wants to remain united as a single country. In fairness, this poll was conducted after Russia annexed Crimea but before the deaths of pro-Russian separatists in Odessa and Mariupol. (Anecdotally, those events have driven some to the separatist camp.) The map below is part of the Pew report. However, I have an issue with it that, again in fairness, might not be solvable given whatever raw data with which Pew was working.
Who wants secession? Only Crimea.
The map colours each oblast, roughly equivalent to a US state, according not to the results of the survey, but rather to which region the oblast belongs. For example, Kirovohrad is the same colour as Donetsk. Donetsk, however, is the epicentre of the unrest in Ukraine whereas I have at least seen no reports of unrest in Kirovohrad. Are they really reporting the same desire of unity or secession? Would the map not be clearer if each oblast was reported independently?
My guess is that results like these are clear to the Kremlin. And so I think while Donetsk and Luhansk will remain Ukrainian, Crimea will likely remain Russian.
Credit for the piece goes to the Pew Research Center’s graphics department.
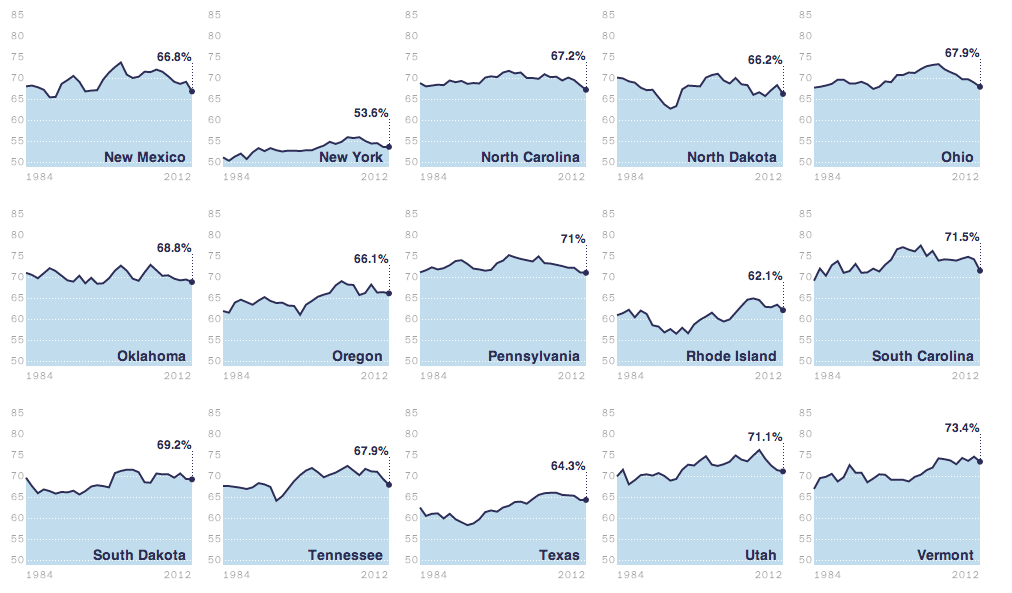
I am pretty much a sucker for small multiples. And so today I present a good one from the Washington Post. The story starts looking at the broad, national scope of the issue. And from there it breaks home ownership down by state.
Home ownership by state
Credit for the piece goes to the Washington Post’s graphics department.
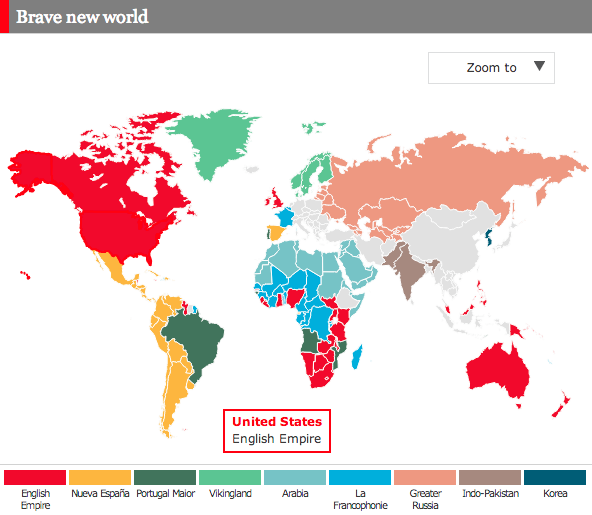
One of the main arguments used by Vladimir Putin to support any possible intervention in Ukraine is the suppression of the rights of Russian language speakers. The Economist wisely decided to wholeheartedly endorse the underlying principle of Putin’s logic and redrew the world map accordingly. You should read the article.
Linguistic empires of the world
Credit for the piece goes to the Economist’s graphics department.
Today’s post comes via a co-worker. LinkedIn’s R&D lab published a tool to map your LinkedIn connections. You login to your account and then receive a social network of map. Mine, seen below, clearly shows three different and generally not inter-connected networks. The orange represents my current employer; the blue is my university network; the green and pink are high school and my employer while in university (they were in the same town).
My LinkedIn network map
To be fair, I’m not a frequent user of LinkedIn. So for those of who you use it more regularly to make connections, contacts, and acquaintances will find yourselves with more complex networks.
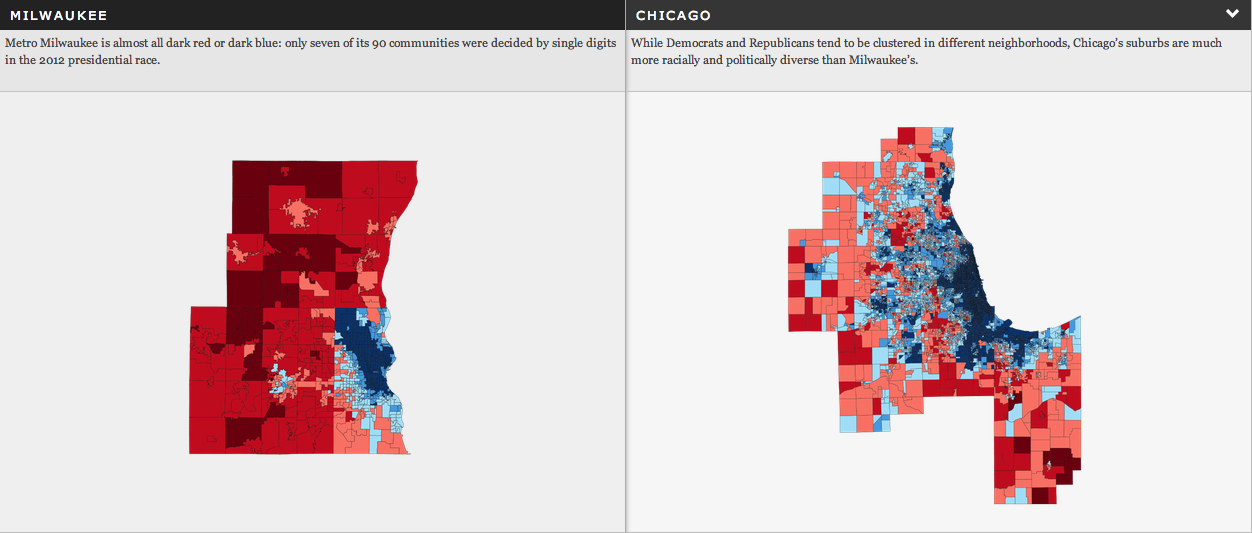
Today we dive into state-level politics north of Chicago, in the state of Wisconsin. The Milwaukee Journal Sentinel published an in-depth article looking at the political divide in the Milwaukee metropolitan area. While one could publish an article of that nature with just lots and lots of words, the Journal Sentinel chose to use maps and charts to support their arguments.
Comparing Milwaukee urban vs. suburban voting patterns
Credit for the piece goes to Craig Gilbert and Allan James Vestal.
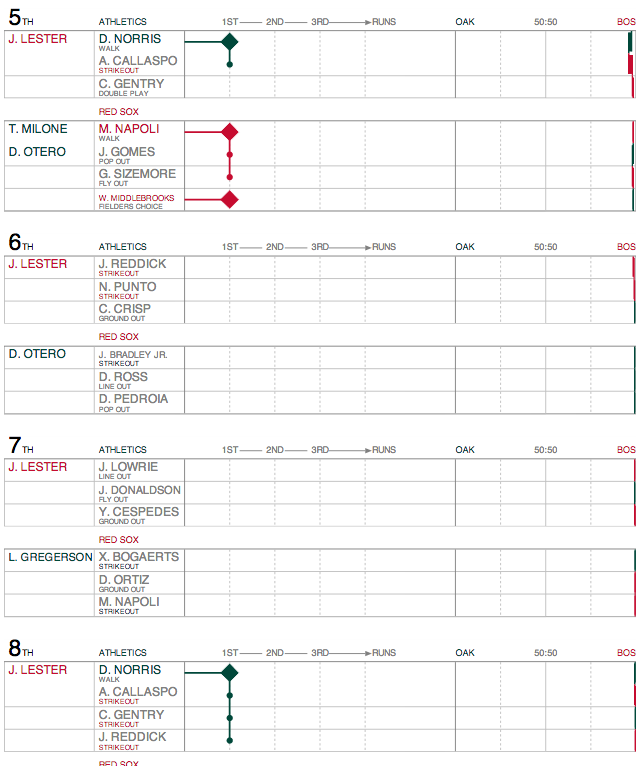
This past weekend was some good Red Sox baseball. Okay, so we only won two of three from Oakland, but that second game was fantastic. John Lester dominated. Last fall I mentioned a studio called Statlas that was visualising the World Series. They continue to update and tweak their product and so it was great to see Lester’s performance documented.
Lester dominates
Though, as you can see, Lester so dominated the Athletics, you can see almost nothing happening from Oakland’s batters. But, I will skip the near ninth-inning implosion of Boston’s relief corps that nearly cost us the game. Mostly because the visualisations of the game tell a great story. And so if you like baseball and data visualisation, you should check it out.
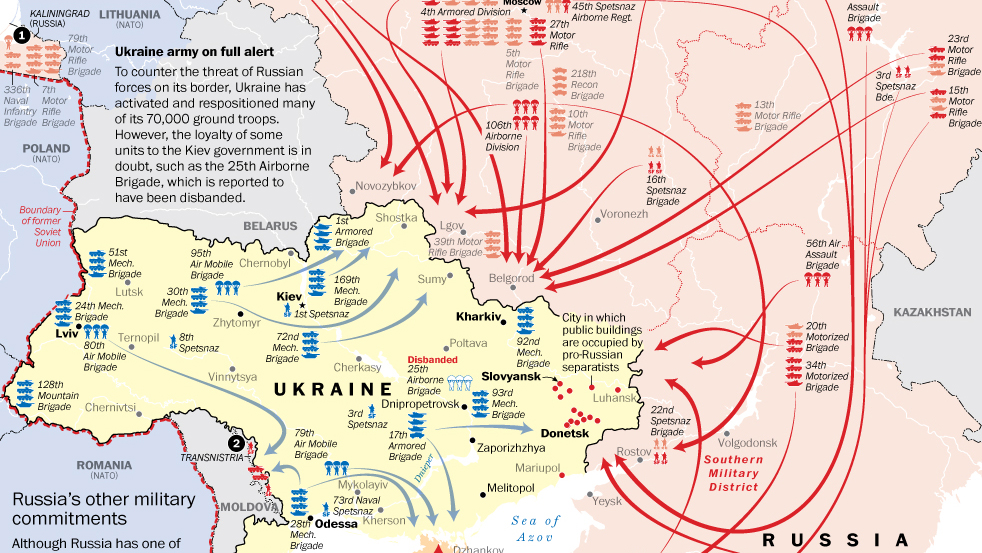
Things remain tense in Ukraine, especially after the violence late last week in Odessa. But in many senses, Ukraine is limited in the operations it can undertake against the separatists, at least with its armed forces. A lot of this has to do with the tens of thousands of Russian troops, tanks, and aircraft now deployed along the border. Thankfully the Washington Post has taken the time to detail just what is known to have happened lately.
Today I am going to take a day-long step away from data visualisation. The Harvard Business Review recently published a short piece looking at some of the symbolism—I mean symbology clearly—we use on the internets.
The ampersand
Credit for the piece goes to the Harvard Business Review.