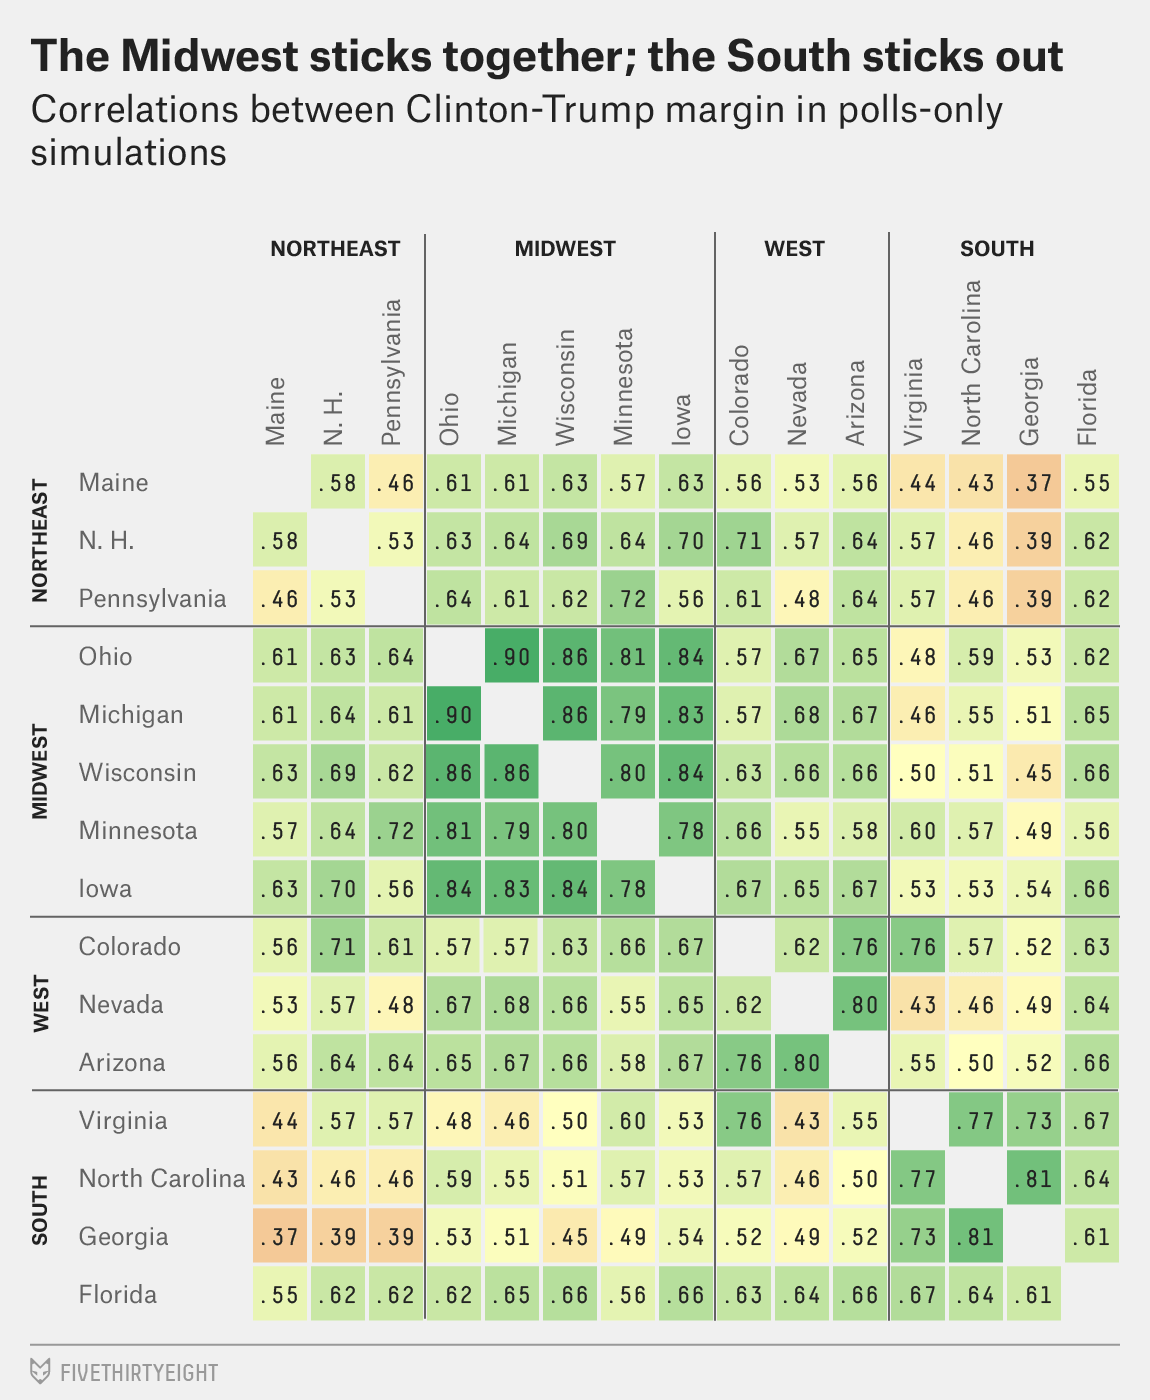
According to this piece from FiveThirtyEight, maybe not as much as they used to be. From a data visualisation standpoint, what stuck out at me was this plot of correlations of how similar various states are. Basically, the closer to the number 1, the more similar, the closer to 0, the less.
Turns out they’re not so close
I might question the value of placing the numbers within the squares—see what I did there?—because the colours could be used with a legend to indicate the range of similarity. But if this were an interactive piece, it certainly could be done to reveal the number on tap or mouseover.
Anyway, it was interesting to see that among swing states, Pennsylvania is least like Georgia but most like Minnesota. The former, certainly. The latter, who would have guessed, don’t ya know.
Credit for the piece goes to the FiveThirtyEight graphics department.
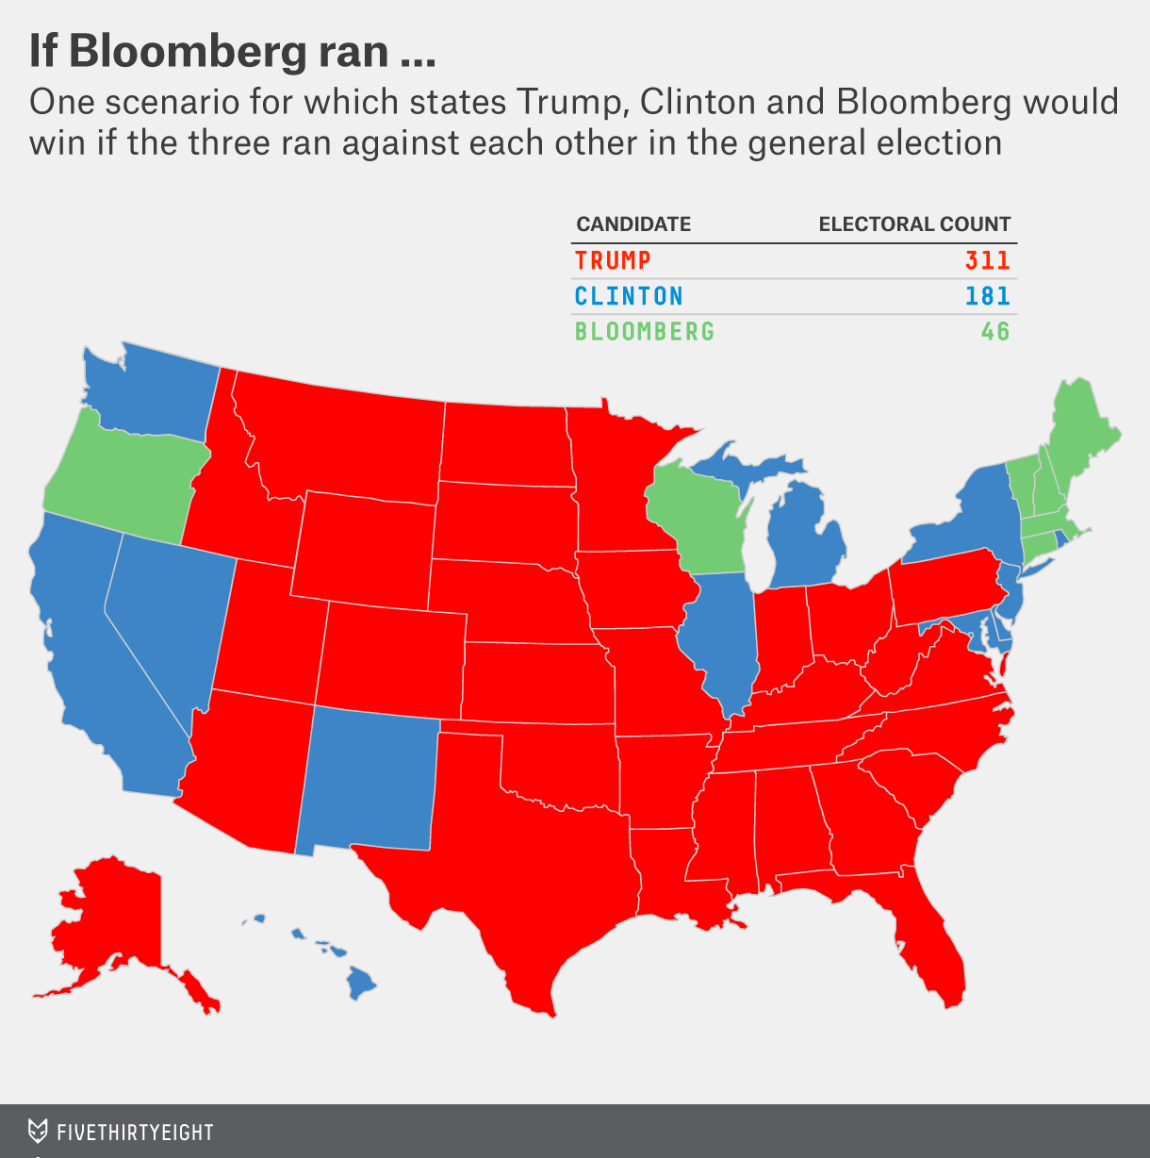
I am not watching the conventions for the first time I can recall, because no cable television. But, I am occasionally dipping into live feed coverage. And while Michael Bloomberg spoke FiveThirtyEight linked to a few pieces of content they published earlier. I covered one about candidates abandoning the middle ground earlier. But this one I had skipped. It looked at the possibility of Michael Bloomberg stepping into the White House as president.
If Bloomberg ran, Election Night 2016
Credit for the piece goes to the FiveThirtyEight graphics department.
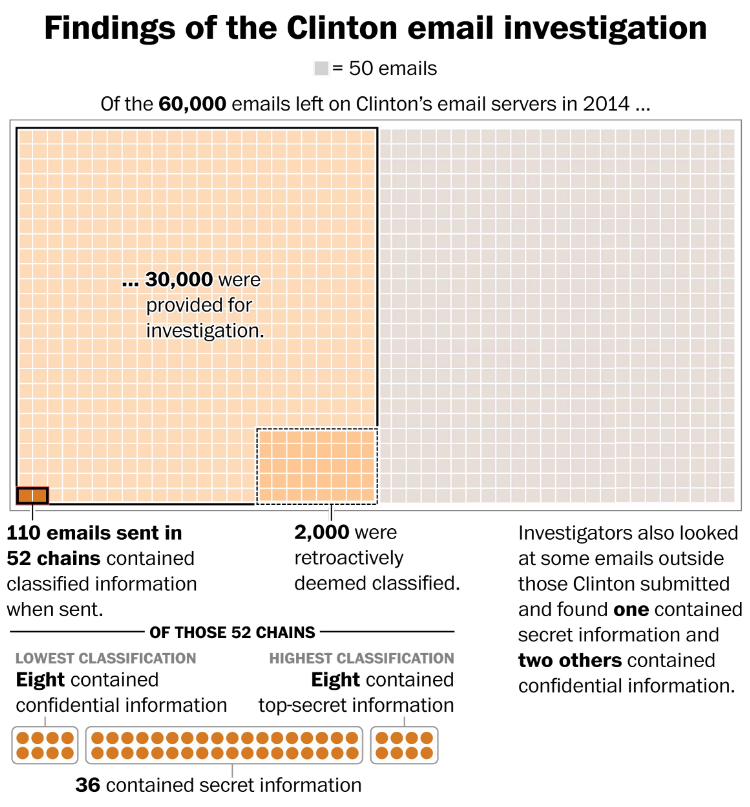
Today Donald Trump should take the stage at the Republican National Convention as he accepts the party’s nomination to run for president. I suspect he will mention Crooked Hillary and quite possibly her e-mails. Thankfully, we have this Washington Post piece from earlier this month that examines the severity of her lapses in security.
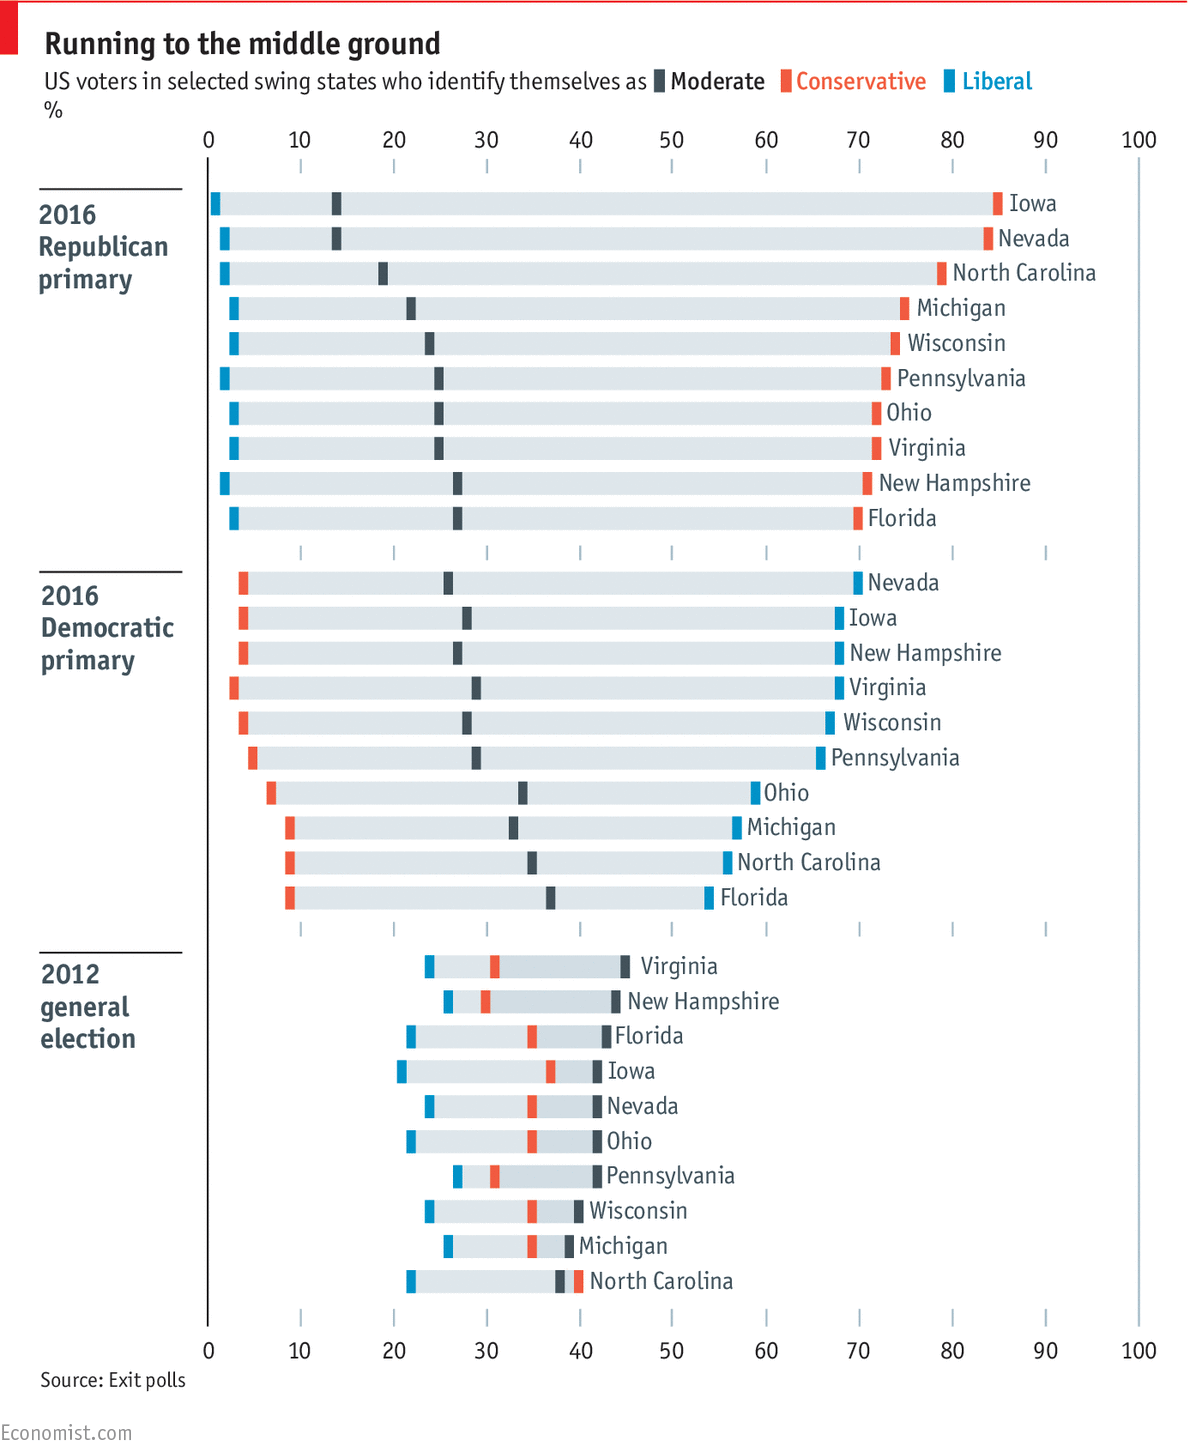
In US presidential politics, the common sense truth is that candidates run to the wings of the parties to get primary voters. They say ridiculous, inane things, but with the hope to walk them back later. Why? Because while they commonly run to the outsides edges during primary season, candidates recognise that in the election itself, victory comes from the moderates. And yesterday, the Economist published a really nice piece on this point.
Moderate voters vote in the autumn
For a sample of battleground states, the Economist examined who voted in the recent primaries versus who voted in the last general election. Given the aforementioned common thinking, not surprisingly self-identified Democrats voted in droves for the Democratic primaries. And self-identified Republicans voted in the Republican primaries. When one looks at the historical 2012 data, however, with the exception (barely) of North Carolina, moderates out voted Democrats and Republicans in all the battleground states.
Not every chart needs to show revolutionary data. Sometimes data can simply validate widely-held truths that people know without knowing the data and facts behind them. And that is what this piece from the Economist does.
Credit for the piece goes to the Economist Data Team.
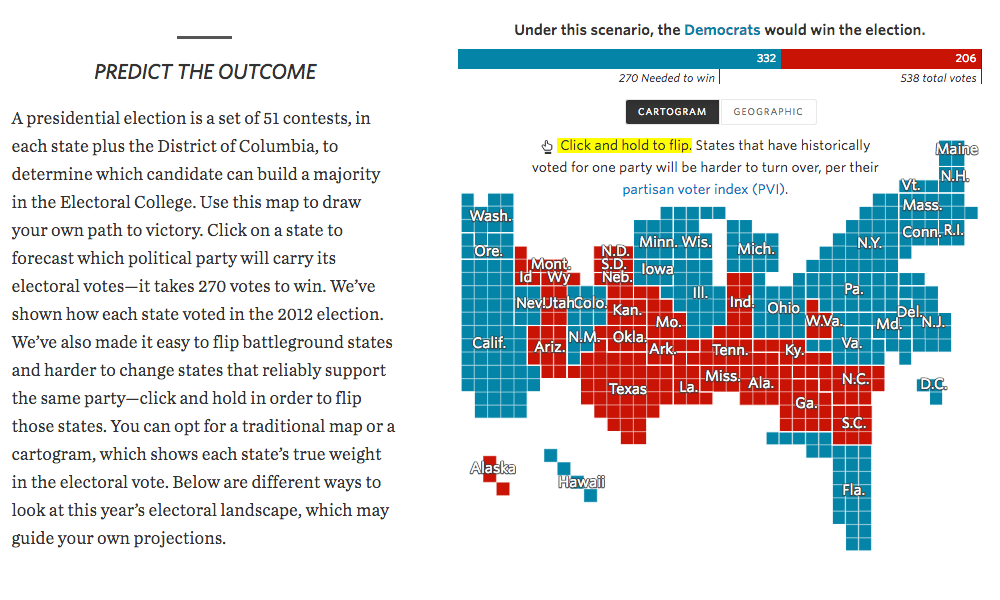
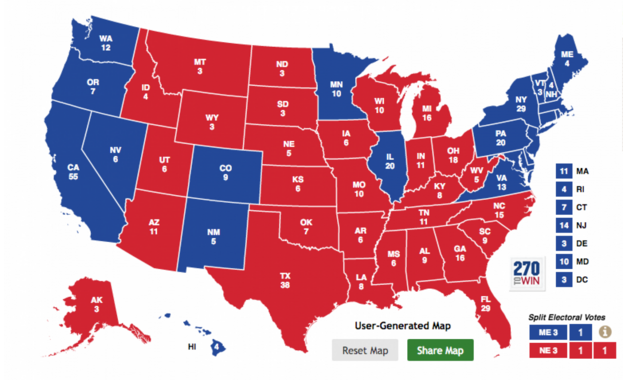
Well the Democratic DC primaries were last Tuesday and Hillary Clinton won. So now we start looking ahead towards the July conventions and then the November elections. Consequently, if a day is an eternity in politics we have many lifespans to witness before November. But that does not mean we cannot start playing around with electoral college scenarios.
The Wall Street Journal has a nice scenario prediction page that leads with the 2012 results map, in both traditional map and cartogram form. You can play god and flip the various states to either red or blue. But from the interaction side the designers did something really interesting. Flipping a state requires you to click and hold the state. But the speed with which it then flips is not equal for all states. Instead, the length of hold time depends upon the state’s likelihood to be a flippable state, based on the state’s partisan voter index. For example, if you try and flip Kansas, you will have to wait awhile to see the state turn blue. But try and flip North Carolina and the flip is near instantaneous.
Starting with the 2012 cartogram
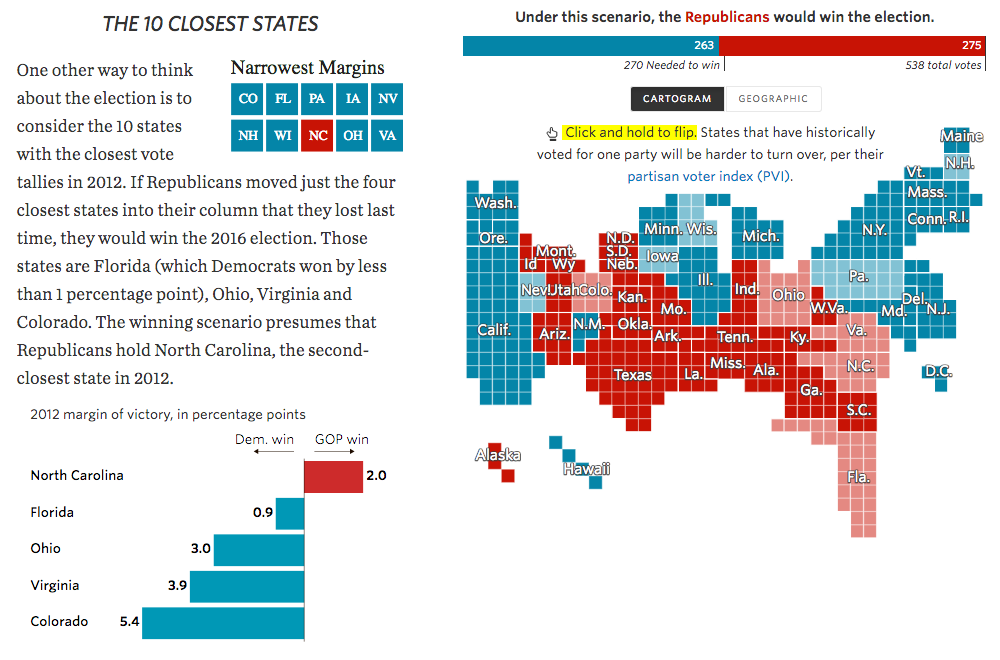
While the geographic component remains on the right, the left-hand column features either text, or as in this other screenshot, smaller charts that illustrate the points more specifically.
Charts and cartograms and text, oh my
Taken all together, the piece does a really nice job of presenting users with a tool to make predictions of their own. The different sections with concepts and analysis guide the user to see what scenarios fall within the realm of reason. But, what takes the cake is that flipping interaction. Using a delay to represent the likelihood of a flip is brilliant.
Credit for the piece goes to Aaron Zitner, Randy Yeip, Julia Wolfe, Chris Canipe, Jessia Ma, and Renée Rigdon.
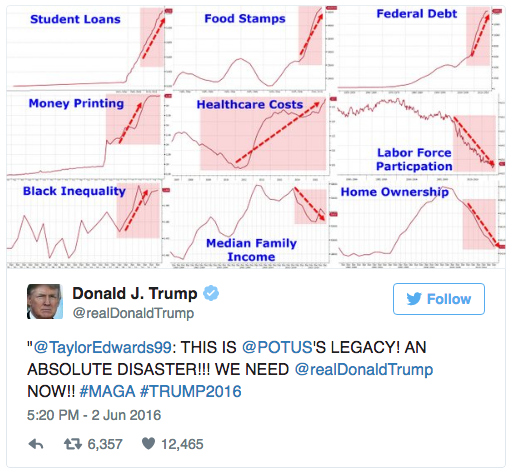
Today marks the end of primary season for the US presidential election. By all accounts, at night’s end Hillary Clinton will be the Democratic nominee, but Bernie Sanders, while unlikely to win, could make California interesting tonight. And then there is Donald Trump. He is the Republican Party’s presumptive nominee and man, can that guy tweet.
Thursday he retweeted a set of small multiple charts arguing that President Obama’s legacy is an absolute disaster.
Trump’s retweeted charts
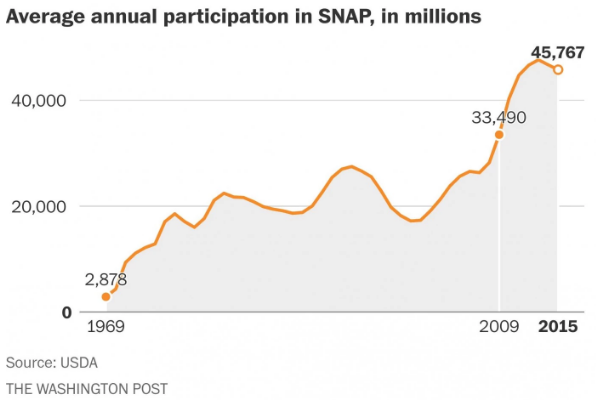
Friday the Washington Post went through all nine points and fact-checked the charts, this being the refutation of the Food Stamps chart.
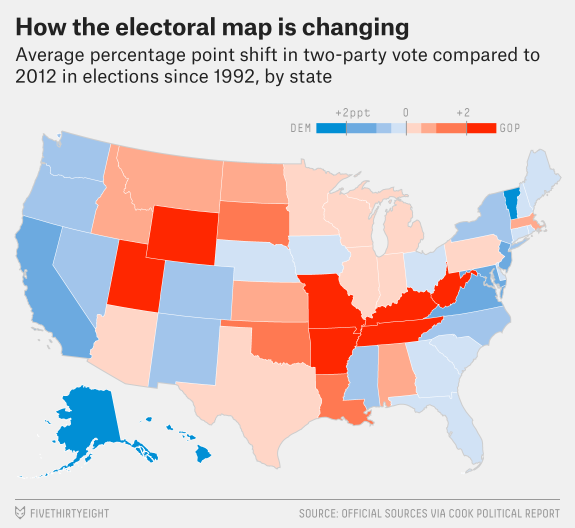
Today we look at a piece that focuses on my native (and favourite) state: the Commonwealth of Pennsylvania. (Along with Virginia, Massachusetts, and Kentucky, we self-identify as a commonwealth and not a state.) FiveThirtyEight examines how Pennsylvania and its shifting political preferences might just be the key (get it? keystone) to the election for both candidates. The crux of the article can be seen in the map, but the whole piece is worth the read. If only because it mentions Pennsyltucky by name.
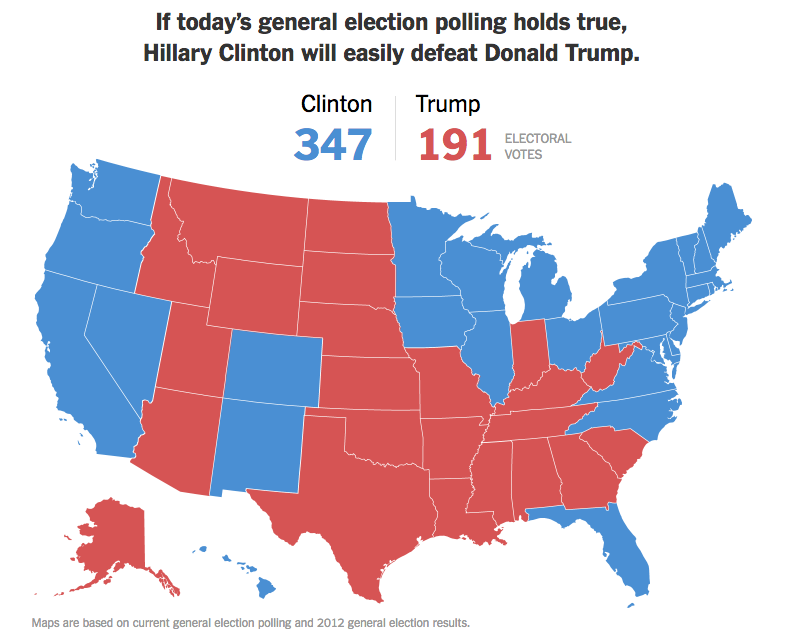
Okay, that joke was a stretch. But, this piece from the New York Times’ Upshot takes a look at the early polling in the increasingly likely Clinton–Trump matchup in November.
The early polling
Credit for the piece goes to Wilson Andrews, Josh Katz, and Alicia Parlapiano.
Donald Trump will be the Republican Party candidate for President of the United States.
Last summer I never imagined I would type those words in all seriousness, but after Trump won a majority of the votes in Indiana and likely swept all the delegates there, Ted Cruz suspended his campaign.
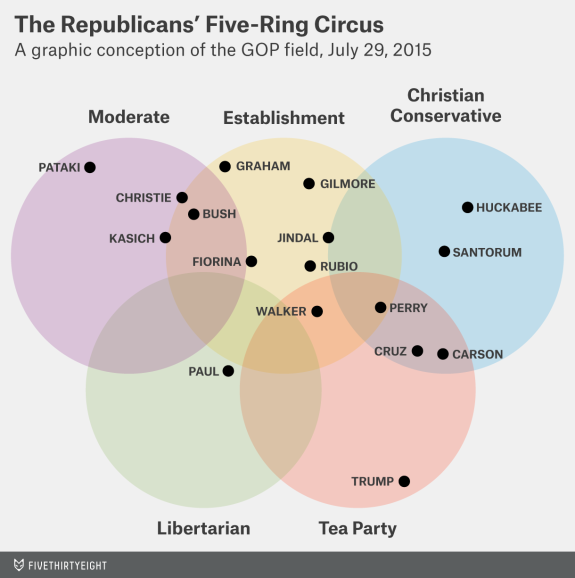
Two graphics strike my mind to best capture the story. The first is from last summer when FiveThirtyEight added Donald Trump to an existing graphic that loosely mapped out which candidates belonged to which factions of the Republican Party.
Trump was the exception in so many ways…
You can clearly see Donald Trump falls as an outlier at the extreme end of the Tea Party circle. This would be the argument that Trump is not a true conservative. But how did that argument play out over the following months?
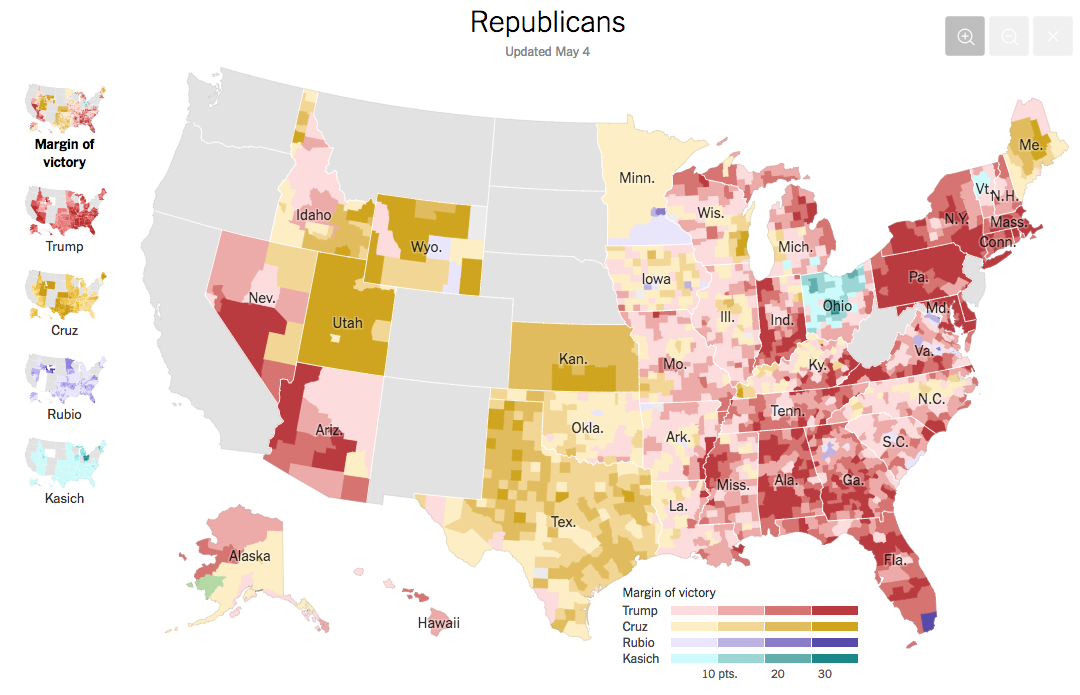
Well this New York Times results map breaks down results to the county level. And you can see a lot of Trump red.
Results as of 4 May
It started with wins in New Hampshire and, more importantly South Carolina. Candidates try to win Iowa and New Hampshire and whatever other states there are prior to Super Tuesday, because Super Tuesday requires a ground game that is expensive to maintain. And early victories lead to donations. But Trump’s crushing victory in South Carolina led to a series of wins in the deep Republican red South.
Importantly for this last phase of the contest, the Cruz campaign had bet on winning those very same southern states, the Bible Belt. While Cruz won Texas, it was his home state, he lost almost every other state. The map above shows just how wide and diverse Trump’s victories were. From liberal Massachusetts to Alabama and as far west as Arizona. The final one-two blow, however, came in the above map’s deepest reds: a swath from Rhode Island through Connecticut and New York into Pennsylvania then south into Delaware and Maryland. Trump was favoured in the Northeast and Mid-Atlantic, but most had not expected those margins. The second blow, look at the deep red in Indiana. Cruz needed to win Indiana. He lost it big. And now he has stepped aside.
Donald Trump will be the Republican Party candidate for President of the United States.
Trump won Arizona last night. And that is a big deal, despite losing Utah. He was never expected to win Utah. And while he Arizona was expected, the magnitude of his victory there was…big. If you replicate even something close to that in a demographically similar state like California, he can rack up some big delegate numbers.
But the big story these days is the anti-Trump movement, largely centred upon either Ted Cruz or tactical, state-by-state voting to force a contested convention (which as a political nerd would be just fantastic). Chris Cillizza of the Washington Post, however, wrote an article that I largely agree with that a Trump nomination might actually give the Republicans a better shot at the White House than Ted Cruz. The whole article is worth a read.