Choo Choo

I took two weeks off as work was pretty crazy, but we’re back to covering data visualisation and design with a graphic about trains. And anybody who knows me knows how I love trains. One of the early acts of the Biden administration was funding a proper expansion of rail service in the United States.

Last week the Washington Post published an article that explored some of the difficulties Amtrak, the national rail company, faces in that expansion. Most of it has to deal with the fact that outside the Northeast Amtrak largely uses rail lines owned by freight companies.

The article uses a map to show Amtrak routes and, in particular, where Amtrak wants to increase service or create new service.

No Alaska, no Hawaii

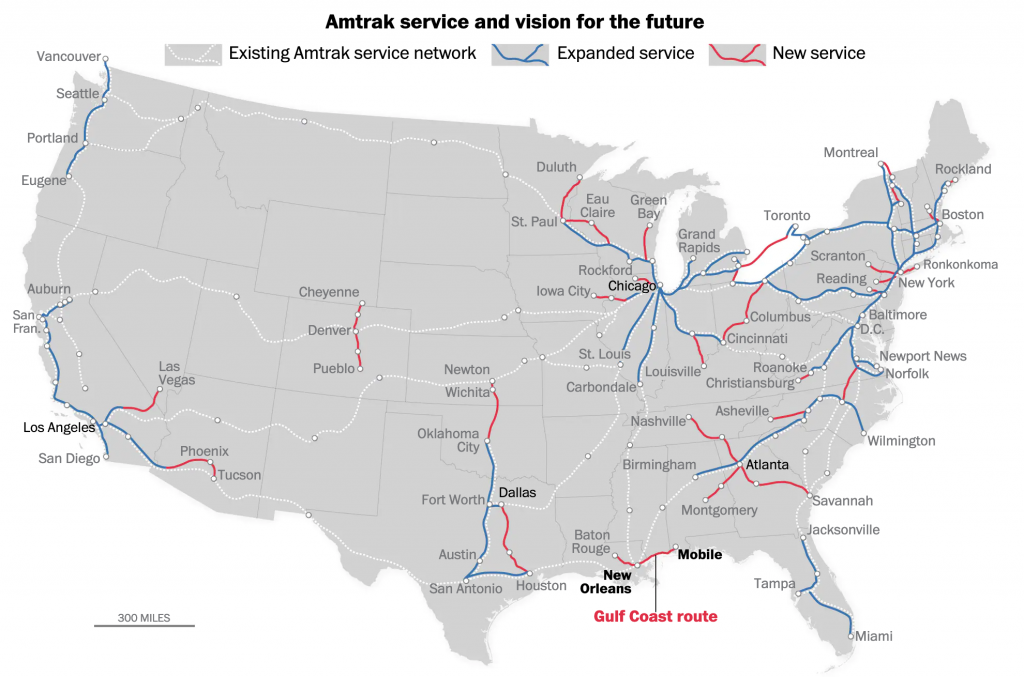
As far as the map goes, it does a nice job needing not to reinvent the wheel. When an existing route will have expanded service, e.g. the Northeast Corridor, the blue line sits next to the dotted white line. What remains a bit unclear to me is the use of black text for Chicago, Atlanta, Dallas, and Los Angeles. The bold type for New Orleans and Mobile makes sense because of the story’s focus on that particular route. Chicago is mentioned once, but Dallas is not. So that is unclear.

But what really stood out to me was what happened when I re-read the story on my mobile. The graphic split from a full map to three narrow graphics, each featuring 1/3 of the United States. The designers moved the text labels so that they are fully visible in each graphic.

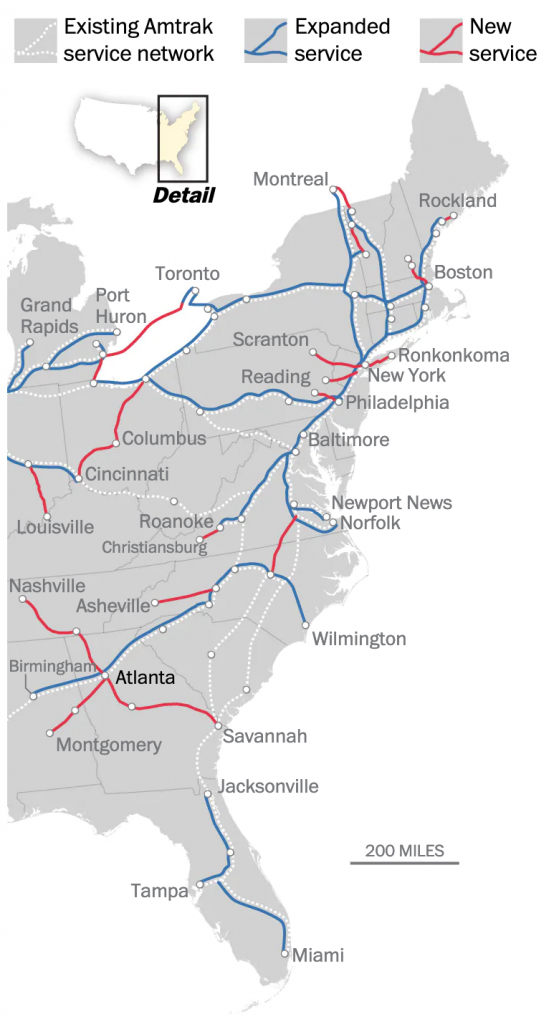
Overall, the piece does a great job at showing the map, but in particular it shines when it swaps out the large map for the smaller graphics on small screens. And the attention to detail in moving the text labels makes it all the better.

Credit for the piece goes to Luz Lazo.

Septa’s Silverliner Service Shutdown

Two weeks ago Philadelphia regional rail commuters, a large group to which I belonged for a number of years, experienced a week from hell. On 2 July a yard inspector for Septa, the Philadelphia region’s transit agency, discovered a Silverliner V railcar tilting. For those not familiar with Septa, the Silverliner Vs have been in service for only three years and have been long touted as the future of the Philadelphia commuter rail service. After inspection Septa discovered the tilting railcar suffered from a fatigue crack on the equaliser beam, specifically where it was welded to connect to the wheel bearings. The beam forms part of the truck, which is what connects the railcar to the rails, and any failure at speed could have resulted in an accident, possibly a derailment. The transit agency then quickly inspected the remainder of its fleet of 120 Silverliner Vs. It found the same fatigue crack in a total of 115 cars. By 4 July, Septa pulled all 120 Silverliner Vs from service.

The equaliser beam connects the wheels to the passenger car

So what happened? At this point, we do not know. Septa continues tests to discover just what happened and just what can be done to repair the cars. Because, with a fleet of approximately 400 cars, the Silverliner Vs represent 1/3 of the fleet. And with fewer seats and fewer trains, commuters attempting to ride into the city, particularly from nearer-in suburbs, find trains bypassing stations because they quickly reach capacity.

The additional passenger railcars from other regional transit agencies will make little difference

Consequently, Septa has instituted a reduced service—a modification of the Saturday service—with additional service on subways and other high-speed lines. Additionally, Septa has agreed to lease additional trainsets, i.e. locomotives with passenger cars, from other regional transit agencies: Amtrak, New Jersey Transit (NJ Transit), and the Maryland Area Regional Commuter Train Service (MARC).

Long-distance Amtrak

Today’s post is not super complex, but we all know I am a sucker for transit. Especially Amtrak. Back home on the East Coast, it runs both quickly and reliably along the Northeast Corridor and the Keystone Corridor. But as this graphic from the Wall Street Journal shows, that does not quite hold up for the longer distance Amtrak routes. Why? Freight trains.

Long distance is always difficult

Credit for the piece goes to the Wall Street Journal graphics department.

The Curviest Tracks on the Northeast Corridor

If you remember a little while back, Amtrak No. 188 derailed in North Philadelphia at Frankford Junction. I covered it here and here. Well, the New York Times has analysed the Northeast Corridor to identify the curviest segments of track, excluding entrances and exits from stations. Perhaps as no surprise, Frankford Junction is right among the top segments.

Tracks north of Centre City Philadelphia

Credit for the piece goes to the New York Times graphics department.

Others’ Coverage of Amtrak 188

Tuesday I posted my late-night work on Amtrak No. 188’s derailment, (now with a few minor updates, including the speed information released this afternoon) so you could all get a sense of what happened yesterday. Of course, in the last 24 hours, we have seen a lot of news outlets covering the story.

The New York Times has a nice piece mapping out the details of the accident. Of particular interest, they included a map showing the parts of the Northeast Corridor equipped with positive train control. That is a system designed to prevent trains from exceeding their speed limits.

Positive train control implemented on the Northeast Corridor

The Washington Post has two nice pieces. The first, below, incorporates both illustration to simplify the wreck site for the audience and then photographs to provide context of just how destroyed some of the train cars are, the first in particular.

Using both illustrations and photographs

The Post, however, also has a supplemental piece that looks at Amtrak’s accidents over the last ten years. This is the most data-centric piece of all that we are looking at, but that is okay. Most of the story is not reliant on data, but rather illustrations and diagrams trying to piece everything together.

Comparison of derailments vs. vehicle collisions

Lastly, the BBC has an article with several small graphics looking at US train risks. Spoiler, American trains, while safe, are far less safe than those in Europe and Asia. Here, though, the map looks at accidents along the Northeast Corridor.

Amtrak accidents
Amtrak accidents

Credit for the New York Times piece goes to Gregor Aisch, Larry Buchanan, Bill Marsh, Haeyoun Park, Sergio Peçanha, Julie Shaver, Joe Ward, and Karen Yourish.

Credit for the Washington Post piece on the derailment goes to Bonnie Berkowitz, Patterson Clark, Alberto Cuadra, Todd Lindeman, Denise Lu, Katie Park, and Gene Thorp.

Credit for the Washington Post piece on Amtrak accidents goes to Dan Keating and Lazaro Gamio.

Amtrak Train No. 188 Derails

I am a big fan of trains, rail transit, and Amtrak. I think the rail network connecting the East Coast’s big cities from Boston down to Washington is one of the big draws of the Northeast. Not surprisingly, I have taken that route I don’t know how many times. So, when Amtrak’s Northeast Regional No. 188 derailed in Philadelphia, it ran off rails with which I am familiar.

I made a graphic tonight—so much for all my other plans—charting and mapping out what was announced by Philadelphia’s mayor, Michael Nutter. I am sure that by the time I wake up in the morning, we will know more and some things will have changed. But, let this be a simple guide to the basics as they were Tuesday night.

Updated graphic
Updated graphic

Frankford Junction is in the Port Richmond area of Philly. And what I can attest is that trains do slow down here, because it is a fairly sharp turn at a fairly flat grade (I think).

Credit for the screenshot map image goes to Google.

Hudson River Tunnels

Readers of this blog know that I am a fan of rail travel. And in particular, how the rail system on the East Coast is brilliant when compared to anywhere else in the States. Unfortunately, the railway system on the East Coast is also old and in need of serious capital investment. The tunnels linking New York and New Jersey beneath the Hudson River are a prime example. But a few years ago, Governor Christie of New Jersey killed Amtrak’s plans to build new tunnels to provide a backup to the existing infrastructure and increase overall capacity. The Wall Street Journal takes a look at Amtrak’s new plan to cross the Hudson. Let’s hope this venture is a bit more successful.

The new project
The new project

Credit for the piece goes to the Wall Street Journal graphics department.

Proposed Expansion of Massachusetts Railway Network

When we talk about new rail projects, or even highway or airport expansions, we like to include maps of new routes and destinations. In that sense this map from the New York Times is not new. However, we often forget in such visualisations that we have the opportunity to add layers of information that show why these expansions are beneficial.

Proposed Massachusetts railway network expansion


Here, note in particular how the proposed improvement projects link the dense corridor of urban settlements stretching from Boston through Worcester to Springfield. Additional lines connect more distant southerly cities such as Fall River to Boston. These might normally be seen as dots at ends of a line, but by showing the density of the population in these corridors, readers can understand how the proposed lines might benefit more people than just those living at the dots.

Credit for the piece goes to the New York Times.

Analysing Amtrak

The Brookings Institution released a report investigating the ridership of Amtrak’s various routes in an attempt to identify ways of cutting costs. They also released an interactive piece along with the report that pairs a map with a simple table.

Highlighting a route in the table highlights the route in the map and links the two together for the user. Clicking a dot on the map shows the details for the metropolitan area ridership along with the total number of stations. Lastly, because the table is sortable, the user can identify for themselves the conclusion reached by the report. To become solvent, Amtrak should divest itself of its long-haul routes that run at significant losses and focus on the profitable routes that could subsidise the popular though still minor loss-making routes.

Amtrak routes with the Northeast Regional highlighted

Credit for the piece goes to Alec Friedhoff.