New New Orleans

Nine years after the impact of Hurricane Katrina upon the city of New Orleans, the touristy French Quarter has returned according to an article in the National Journal. However, the new New Orleans beyond the French Quarter is different from what once was. In short, the new city is whiter and more Hispanic.

And while this graphic that accompanies the piece does a fair job of showing the title, a snapshot, I wish the focus would have been on more of a comparison between pre and post, old and new.

A quick look at New Orleans

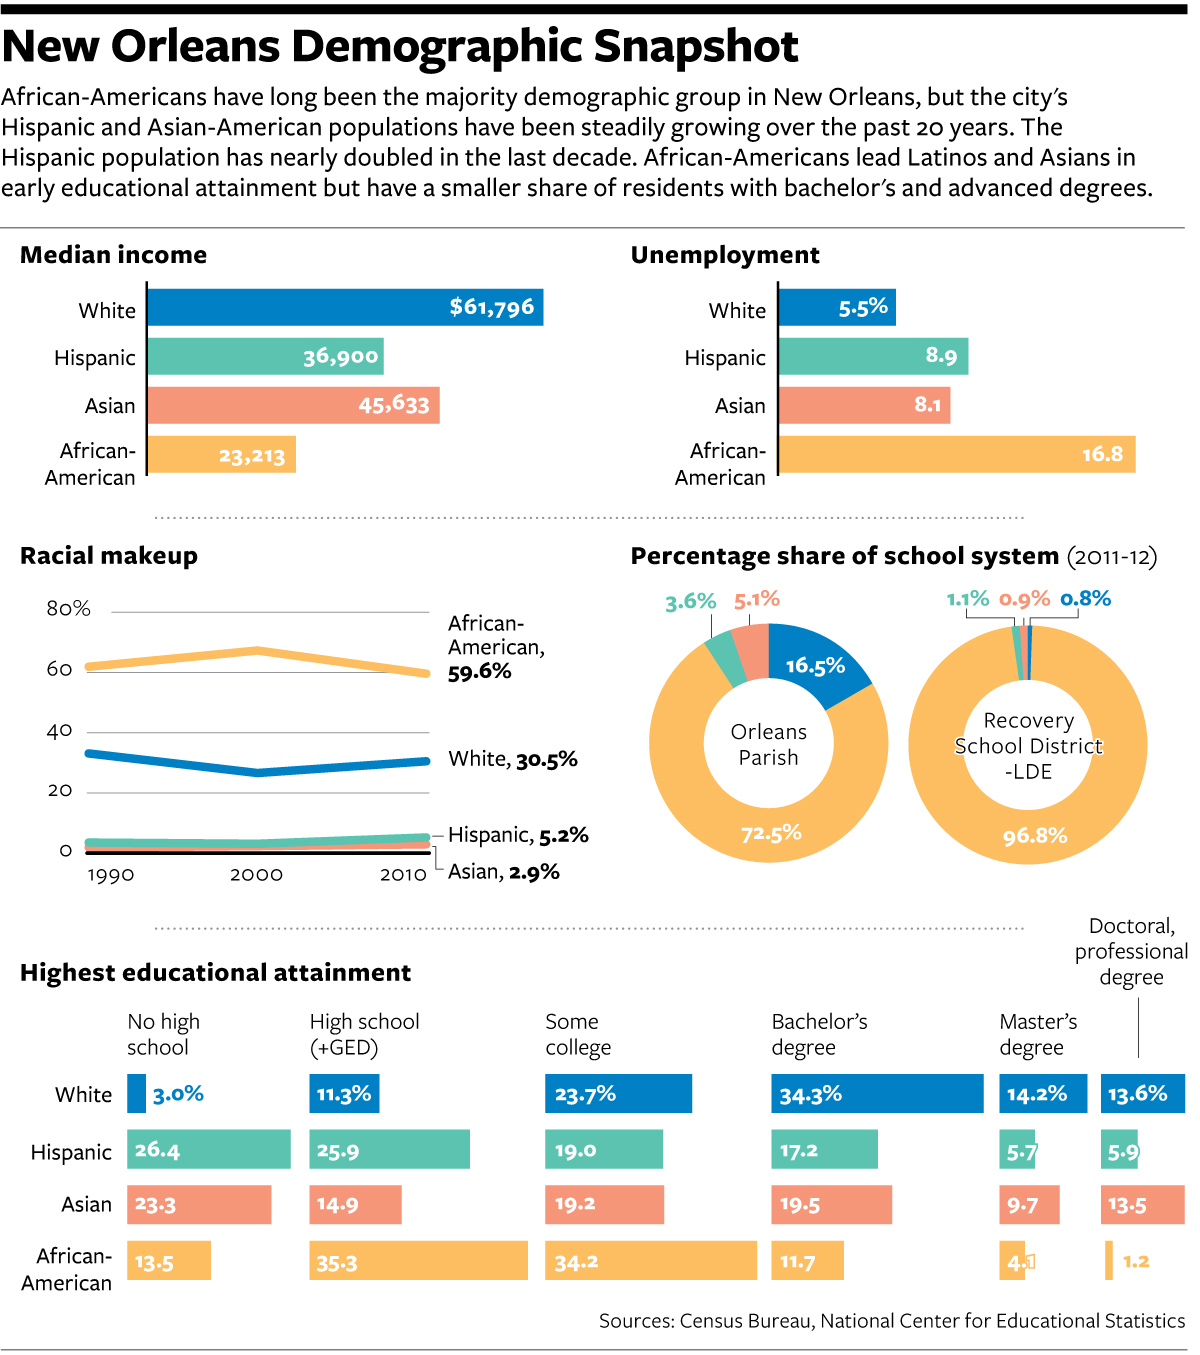
I would not necessarily chosen the same components to tell the story. But, I really want to see more direct comparisons of even just the 2000 census and data to that of 2010.

Credit for the piece goes to the National Journal’s graphics department.

The Libyan Revolution’s Results So Far…

The Libyan Revolution that removed Gaddafi from power was just over three years ago. Unfortunately, if we have not learned by now, the process of building Western-like liberal democracies is clearly a messy process. Because Libya is far from it as this graphic from the Economist shows.

So how's that revolution working out for you?
So how’s that revolution working out for you?

Credit for the piece goes to P.J.W. and L.P.

Drinking by Decile

Happy Friday, everybody. I’m looking forward to a pint. But thanks to some research, as an American, I might actually be looking forward to 10 pints if I fall within the highest decile of American drinkers. They imbibe on average over 73 alcoholic drinks per week. Yep, that means over 10 per day. Bottoms up, Merica. The Washington Post brings up the graphic summary of the study.

Drink deciles

Credit for the piece goes to Christopher Ingraham.

The State of Gay Marriage in the States

I have been fairly out of the loop of the news the last few weeks, but I did at least catch one of the headlines: gay marriage in the States is more legal than ever. Between Supreme Court stays and Appeals Court rulings, gay marriage is now legal in more than 50% of the country—at least by number of states. The Wall Street Journal does a nice job in this static graphic showing just how far equality has come.

Marriage equality
Marriage equality

Credit for the piece goes to Randy Yelp.

Importing Russian Gas

Today’s post is a graphic from the New York Times that looks at Russia’s hold on energy across Europe. I’m not terribly keen on this particular graphic for a few reasons. First, the design needs to incorporate the actual datapoint so the reader can compare across countries. Comparing the height of each black bar to each other is difficult at best.

Secondly, the data excludes the energy trade between European Union countries. And that strikes me as potentially quite a lot. Just because a country is importing from another EU country does not mean it is importing less.

Russian gas market in the EU

Credit for the piece goes to the New York Times graphics department.

Does the Apple Fall Far from the Tree?

Last week Apple announced its plan for its new Apple Watch. I am not quite a watch aficionado, but I do have a preference for my light, minimalist design watches. So I find this comparison of the new smart watches from Bloomberg quite interesting. The only watch to which I aesthetically gravitate is the Moto 360. But for those of you more interested in some of the specs, they compare those figures via bar charts to the right of the illustration.

A watch comparison
A watch comparison

What about you, readers? Do you have a favourite of the new smart watches? Either based on specs or aesthetics?

Credit for the piece goes to Shawn Hasto and Keith Collins.

Cycling Deaths in Australia

Cycling can be quite dangerous. But apparently this summer was quite dangerous over in Australia. So much so that the Guardian did some data reporting on it back in June. Thankfully they included some charts in that reporting, the heat map below being one example.

Cyclist fatalities
Cyclist fatalities

None of the data visualisation in the piece is revolutionary or earth-shattering, but it is a solid piece with some solid charts backing up an interesting story.

Credit for the piece goes to Nick Evershed.

Terror Attacks Throughout the World

Last week many American observed 11 September in remembrance of the terror attacks that brought down the Twin Towers, a section of the Pentagon, and four airliners in total. So this week we are going to see some fantastic work from Periscopic that highlights several other terror groups operating in the world across the last few decades. 

Irish Republican Army attacks

The charts work as a timeline from 1970 through 2013 and then vertically from January through December. Above and below the timeline, respectively, are the numbers of people killed and wounded. When shown as small multiples, the overall piece can show you which groups have been active and lethal, active but without lots of fatal attacks, and those that are fading out or fading in.

Credit for the piece goes to Periscopic.

The Distribution of Debt in the United States

In a good example of comparing share versus actuals, the National Journal looks at the state of debt across the United States. The choropleth map shows adult share of debt while the bar charts show the regional value of said debt. While the south holds more debt, the west and east coasts have more debt. They also, however, have higher incomes that make servicing or paying off said debt easier than lower income adults in the south.

The South's victory is debt
The South’s victory is debt

Credit for the piece goes to Nancy Cook and Stephanie Stamm.

The Silk Road, Respun

Today’s piece comes from the South China Morning Post. It looks at the Chinese government’s efforts to connect China to trade partners via a maritime route. This is conjunction with efforts to build a railway intended to connect Europe and China via Russia.

Cropping of the revival route

Credit for the piece goes to Lau Ka-kuen.