Pedro Martinez Was Amazing

So the Red Sox in 2015 are godawful, terrible, bloody bad baseball. But, go back 11 years and they were amazing, fantastic, great and awesome baseball. 2004 was, of course, the year the curse was broken and that was in no small part due to the pitching efforts of Pedro Martinez, who would head down to Flushing in the off-season to end a seven year run of Pedro pitching for Boston. Well, this weekend, after being elected in his first year of eligibility, Pedro enters the Hall of Fame and then will have his number retired at Fenway.

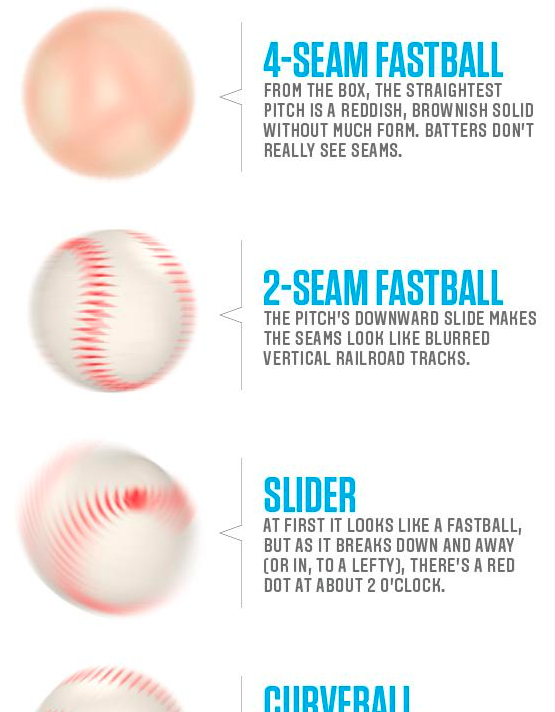
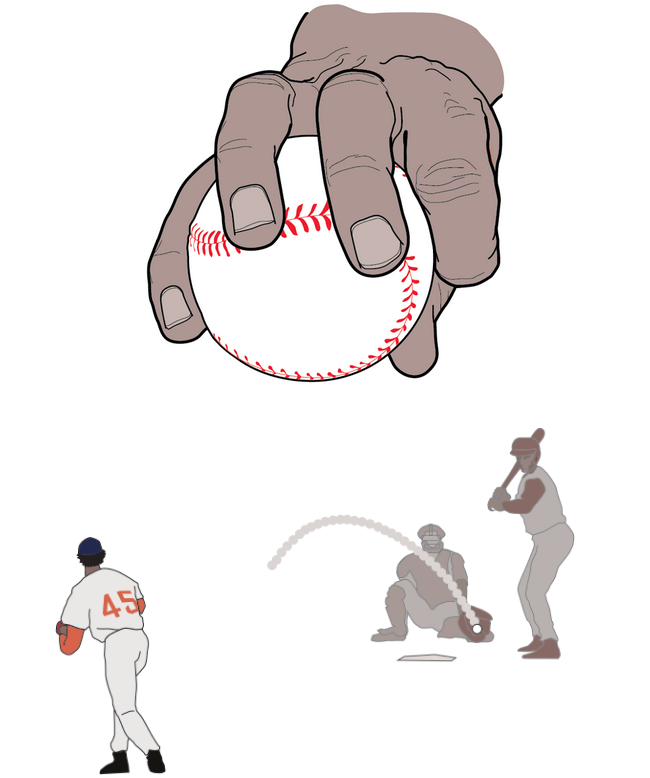
The Boston Globe looked at Pedro, his arsenal, his career, and his best game ever: the 1999 17-strikeout, one-hit performance against the Yankees in Yankee Stadium. The whole piece is worth a looking. But this screenshot shows just how devastating his changeup was, especially in the context of an upper-90s fastball.

Pedro's circle change
Pedro’s circle change


Who’s your daddy?

Credit for the piece goes to

High Strikeout Games

Baseball has changed in the last twenty years or so. (And I’m old enough to recognise it.) Gone are the days of the high strikeout/high pitch count starts from the likes of Roger Clemens, Pedro Martinez, Randy Johnson, and Kerry Wood. In are high strikeout/low pitch count games…

What does that mean? You can read this article from FiveThirtyEight to make the most sense of it. But this chart explains part of it:

More strikeouts per game

Basically, baseball is played with a lot more data than it used to be. We now know empirically that pitchers are most effective the first time through the lineup. Less so the second time. Even less so the third. The great pitchers, obviously, lose less effectiveness, but everybody does. So, if you can maximise your strikeouts (which come at a great cost of pitches thrown per arm—separate story that) by limiting a start to, say, twice through a lineup, you do so. Because then you can plug in hard-throwing relievers who, in their first and often only time through the lineup, can rack up a few strikeouts. So the result from that is higher strikeouts, lower pitch counts.

And that means that it is highly unlikely you will see games where a starting pitcher throws 120, 130, 140 pitches in a start and strikes out 16+ batters. Which is a shame, because I’m clearly old as those were my favourite ball games to watch.

Credit for the piece goes to the FiveThirtyEight graphics department.

Chase the Unlucky Utley

We all know that I am a Red Sox fan. But I grew up in Philadelphia, largely before the era where the internet made watching out-of-market games a reality. That means I am quite familiar with my hometown Philadelphia Phillies. And for a good chunk of my life that meant names like Rollins, and Utley were familiar to me. So now as that group of players begins to retire and/or leave Philadelphia, we have Chase Utley underperforming to start 2015. But FiveThirtyEight asks the question: is he really? Or is it just that Utley is unlucky?

Utley is unlucky
Utley is unlucky

Credit for the piece goes to Rob Arthur.

Baseball vs. Basketball vs. Hockey

There was an interesting article in Forbes on Monday that looked at baseball’s popularity. In short, the commonly believed argument is that baseball is becoming less popular vs. sports like football, basketball, &c. Hence, one of the reasons for the pace of play changes. However, last Wednesday, there were three nationally televised playoff games—two in basketball and one in hockey—and one nationally televised baseball game, Mets at the Cubs. The logic of the common argument would have non-playoff baseball falling behind the playoff games. But, in 14 of 24 media markets, the local baseball games drew more television viewers than playoff basketball or hockey, or even national baseball games. Unfortunately, the article in question used some really poor graphics to communicate this story. So, I decided to spend my Monday night making it clearer for you. Compare a snippet of the original to mine. You make the call.

The original chart
The original chart
How the local baseball game did against the national sports games

Credit for the original piece goes to the Forbes graphics department.

Foul Balls at Fenway

Happy Friday, everyone. Foul balls are the souvenirs of fortune at baseball games. (Home runs as well I suppose.) You can’t buy them, you can only hope to be one of the lucky few who catch one. So the Boston Globe ran an article with an integrated interactive piece that told the story of a select few foul balls caught by fans at ten games at Fenway. But from the data visualisation side, they plotted where each foul ball landed. But, the real gem is that they then had a few small multiples showing where various Boston hitters tended to deposit their fouls.

Ten games' worth of foul balls
Ten games’ worth of foul balls

Credit for the piece goes to Stan Grossfeld, Rachel G. Bowers, and Luke Knox.

Who Are the Red Sox?

As Massachusetts and Maine celebrate Patriots’ Day, the Boston Red Sox are set to play their earliest game of the year with an 11.00 start time. (Yes, there is also a marathon today.) So after two weeks or twelve games, the question people want answered is what Red Sox do we get this year? FiveThirtyEight looked at what they called roller-coaster seasons of late, primarily using a box plot graphic to show just how much whiplash Boston fans have endured of late.

Projected vs. actual wins

So who are the Red Sox this year? The cellar dwellers of 2012 and 2014? Or world champions like in 2013? Who knows?

Credit for the piece goes to Neil Paine.

Friday Baseball Drinking

Your humble author is out of town today. And unfortunately he is not watching a ball game. But if he were, he would be drinking a beer. And even more unfortunately, his favourite team and favourite ballpark has the most expensive beer. And most unfortunate, the other two teams he is perhaps most likely to watch have the…same most expensive beer. Business Insider charted the prices and the price per ounce. To be fair, I am often too busy scoring a game to get drunk during a game.

It's expensive getting drunk at Fenway. And Citizens Bank. And Wrigley.
It’s expensive getting drunk at Fenway. And Citizens Bank. And Wrigley.

Credit for the piece goes to Business Insider.

Pitch Recognition

Hitting a baseball is hard. Really, really hard. You’re good at it if you fail 7 out of 10 times. Part of the way you get good at hitting baseballs is by recognising the spin or rotation of the red seams on the white outside of the ball. This article from CBS takes a look at five common pitches and what they look like to the batter.

I have certainly never been able to see these

Credit for the original piece goes to an unknown person, I don’t think it was the article’s author.

Baseball’s Pace of Play

So now the baseball season is in full swing, one of the things we will be looking for is shorter duration for games. As I have probably said many times before, I enjoy the long games. But there are none longer than Red Sox–Yankees match-ups so take that with a grain of salt. I am spoiled. Anyway, in time for the season, over at Time they plotted the 2014 winning percentage and average length of game for all Major League teams.

Winning isn't based on pace of play
Winning isn’t based on pace of play

Clearly from this chart we can see that neither playing slowly nor playing quickly has any correlative impact on a team’s winning percentage. Teams are spread out all over. But, in many ways, baseball is all about timing and getting inside the head of the pitcher or the batter. And one way to take the advantage is to mess up the other’s timing. By eliminating that element of the game—or at least attempting to—the game becomes a little bit duller.

Credit for the piece goes to Lon Tweeten.

Baseball in 2015

For most of us, baseball, the 2015 edition, began yesterday. For the Red Sox, it was an 8–0 victory over the Phillies in which Boston’s Clay Buchholz kept the ball down in the strike zone, where it is tougher for batters to make solid contact. Whereas Cole Hamels of the Phillies kept the ball up in the zone and thereby let the Boston lineup hit four home runs in five innings. (Boston added a fifth, a grand slam, in the ninth inning.)

But low strikes are nothing new. In fact, umpires increasingly have been calling low strikes as seen in this chart by FiveThirtyEight in an article looking at 2015’s trends in baseball. (Interestingly they also chart something on Cole Hamels.) It is not the most complicated chart, but it does serve as a reminder that for the next six months, baseball is back.

Pitch height over the last few years

Credit for the piece goes to Rob Arthur.