Arrowheads

I don’t know if this is a trend, but I’ve now seen a few graphics appearing using arrows to show the direction or trend of the data. This graphic in an article by Bloomberg prompted me to talk about this piece.

I should add, after rereading my draft, that I’m not clear who made this graphic. I assume that it was the Bloomberg graphics team, because it appears in Bloomberg and all the data is presented to recreate the chart. But, it could also be a chart made by someone at Goldman Sachs that credits Bloomberg as a source and then someone at Bloomberg got hold of a copy. And a graphic made for a news/media outlet will typically be of a different quality or level of polish than one made perhaps by and for analysts. (Not that I think there should be said differences, as it does a disservice to internal users, but I digress from a digression.)

All the things going on in this chart.

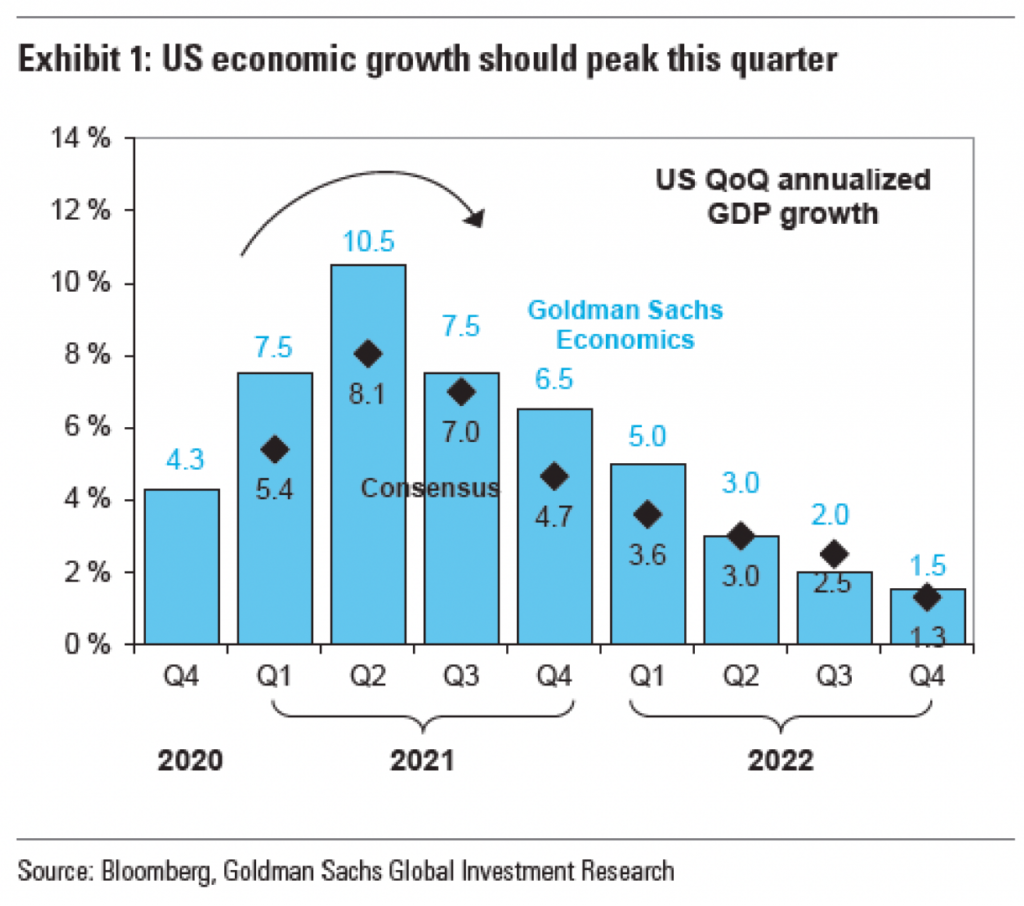
The arrow here appears above the peak quarter, i.e. the second of 2021, for both the Goldman Sachs Economics forecast and the consensus forecast. But what does it really add? First, it adds “ink”, in this case pixels. Here, every pixel consumes our attention and there is a finite number of available pixels within the space of this graphic.

When I work with authors or subject matter experts, I often find myself asking them “what’s the most important thing to communicate?” or something along those lines. If the person answers with a long laundry list, I remind them that if everything is important, nothing is important. If everything is set in bold, all caps text, what will look most important is the rare bit of text set in regular, lower-case letters.

In the above graphic, there are so many things screaming for my attention, it’s difficult to say which is the most important. First, I’m fairly certain that “US QoQ annualised GDP growth” could move to the graphic subhead or data definition. Allow the graphic’s data container to contain, well, data. Second, the data series labels can be moved outside the data container. The labels here have an inherent problem is that the Goldman Sachs Economics numbers are in blue, and that blue text has less visual weight than the black text of the Consensus label. Consequently, the Goldman Sachs Economics label recedes into the background and becomes lost, not what you want from your legend.

Third, I don’t believe the data labels here add anything to the chart. They function as sparkly distractions from the visual trend, which should be the most important aspect of a visual chart.

Finally, we get to the arrow, the impetus for this post. First, I should note that it is not clear what growth it shows. The fact the line is black makes me think it reflects the Consensus forecast whereas a blue line would represent the Goldman Sachs forecast. But it could also be the average of the two or even a more general “here’s the general shape”. The problem is that the shape matters. If you look at the slope of the actual forecasts, you see a sharp increase to the peak followed by a slower, more gradual taper. The arrow in the original graphic shows a decelerating curve that is shallower in the lead up to the peak and that is not what is forecast to happen.

Now we get to the issue I mentioned at the top, the extraneous labelling and data ink wasted. If we look at the chart as is, but remove the arrow, we see this.

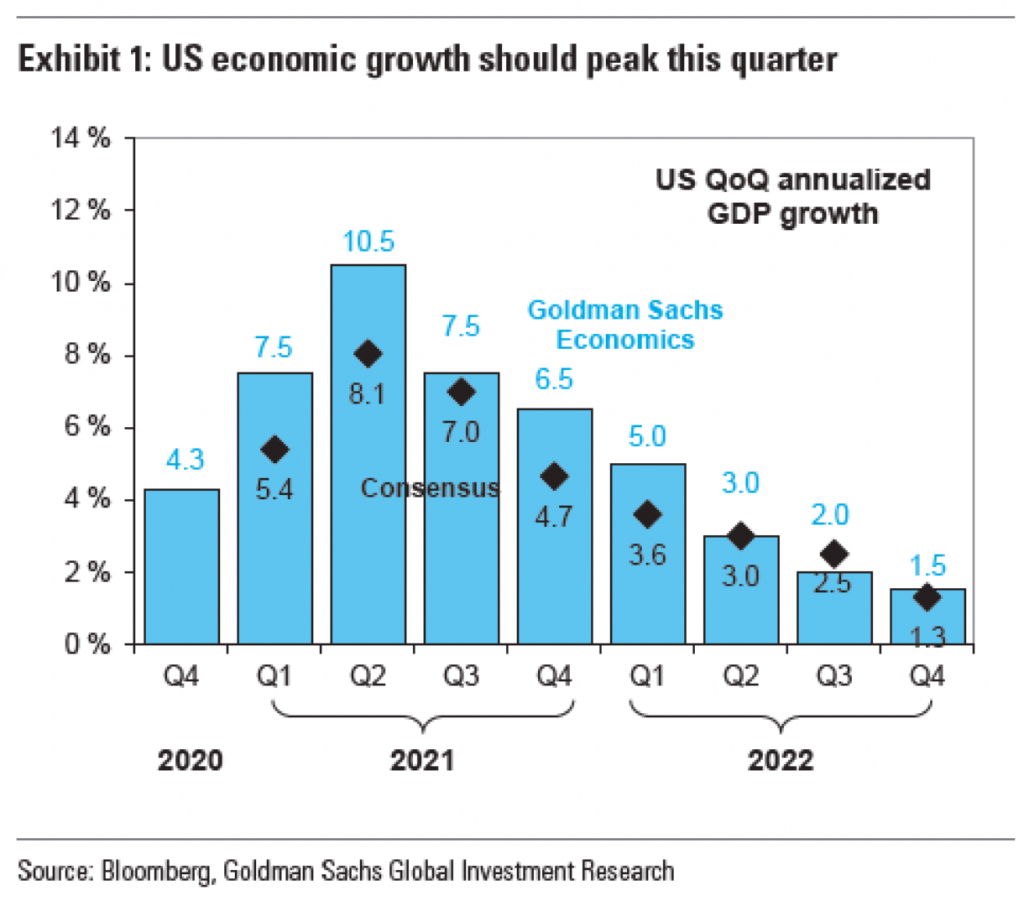
Immediately to the right of the peak, we have have some blue data labels and then just a bit to the right of that, but sitting vertically above the label we have the bold blue text labelling the data series. But further to the upper right we have a dark and bold block of text that draws the eye away from the peak and into the corner. It draws the eye away from the very element of the shape the peak needs to be a peak, the trough in the wave. Consequently, it makes sense with the eye being drawn up and to the right that the designers threw an arrow in above the peak to show how, no, actually your eye needs to go down and to the right.

But what happens if we then strip out the data series labelling? Do we still need the arrow? Let’s take a look.

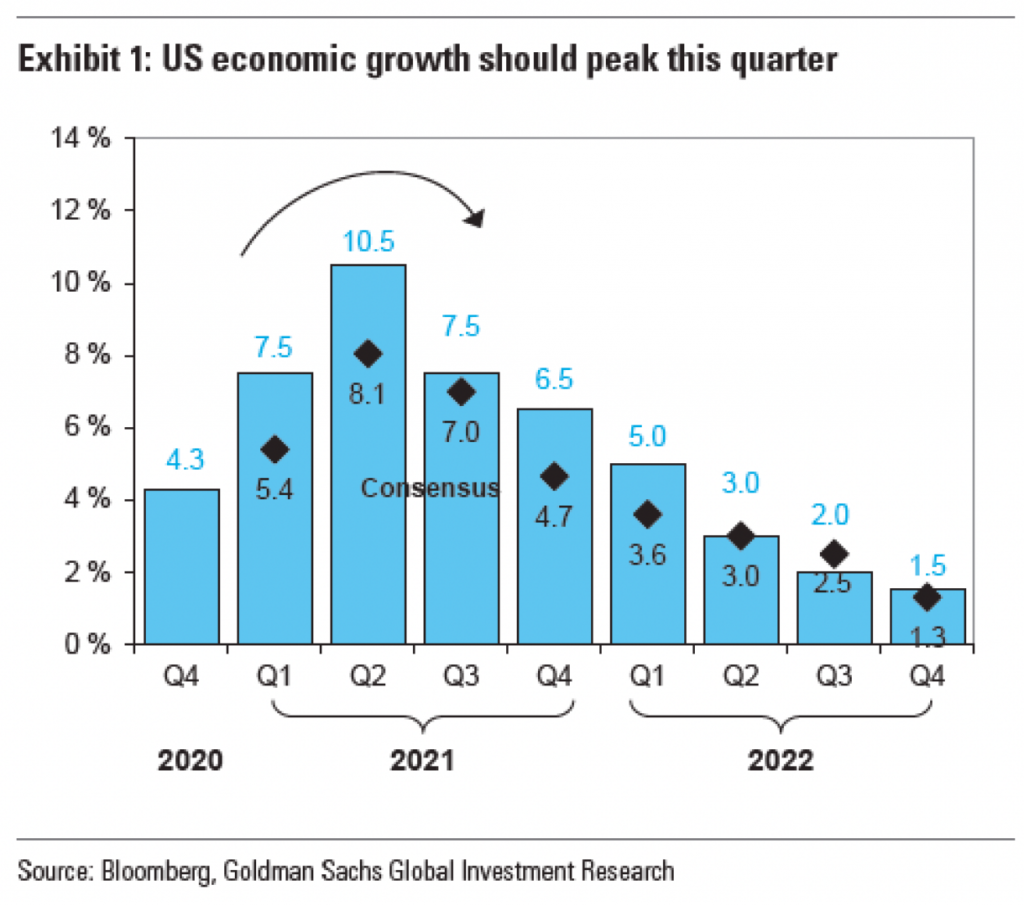
I would argue that no, we do not. And so let’s strip the arrow out of the picture and take a look.

Here the shape of the curve is clear, a sharp rise and then a gradual taper to the right. No arrow needed to show the contour. In other words, the additional labelling wastes our attention, which then forces us to add an arrow to see what we needed to see in the first place, but then further wasting our attention.

There are a number of other things I take issue with in this chart: the black outlines of the blue rectangles, the tick marks on the x-axis, the solid border of the container, the lack of axis lines. But the arrow points to this graphic’s central problem, a poorly thought out labelling structure.

So because the chart provides all the data, I took a quick stab at how I would chart it using my own styles. I gave myself a 3:2 ratio, less space than the original graphic had. This is where I landed. I would prefer the legend below the chart labelling, but it felt cramped in the space. And with so few data points along the x-axis, the chart doesn’t need a ton of horizontal space and so I repurposed some of it to create a vertical legend space.

I mixed typefaces only because my default does not have a proper small capitals and I wanted to use small capitals to reduce and balance out the weight of the exhibit label in the graphic title.

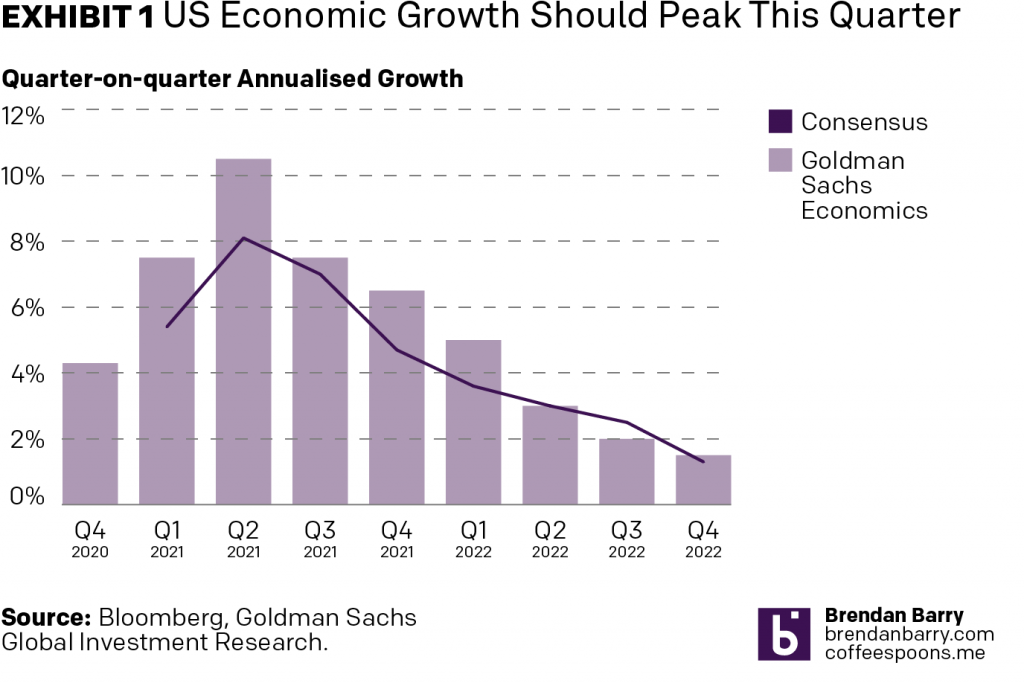
I could still tweak the spacing between the bars and perhaps the treatment of the years below the quarters could use some additional work, but the main point here is that the shape of the curve is clear. I need no arrow to tell the user that there is a peak and that after the peak the line goes down. The white space around the bars and the line does that for me.

Credit for the piece goes to either the Bloomberg graphics department or the Goldman Sachs graphics department. Not sure.

Trump-won Counties Are Winning

Yesterday we looked at how China and the European Union are planning their tariff/trade war retaliation to target Trump voters. Today let’s take a look at how those voters are doing as this article from Bloom does.

Lots of green, but some noticeably red counties in Florida.

The article is not terribly complicated. We have four choropleth maps at the county level. Two of the maps isolate Trump-won counties and the other two are Clinton-won. For each candidate we have a GDP growth and an employment growth map.

In the Trump-won maps, the Clinton-won counties are white, and vice versa. Naturally, because the Democratic vote is greatest in the large cities, which, especially on the East Coast, are in tiny counties, you see a lot less colour in the Clinton maps.

Not a whole lot to see here…

Design wise, I should point out the obvious that green-to-red maps are not usually ideal. But the designers did a nice job of tweaking these specific colours so that when tested, these burnt oranges and green-blues do provide contrast.

Here they appear more of a yellow to grey

But I am really curious to see this data plotted out in a scatter plot. Of course the big counties in the desert southwest are noticeable. But what about Philadelphia County? Cook County? Kings County? A scatter plot would make them equally tiny dots. Well, hopefully not tiny. But then when you compare GDP growth and employment growth and benchmark them against the US average, we might see some interesting patterns emerge that are otherwise masked behind the hugeness of western counties.

But lastly. And always. Where. Are .Alaska. And. Hawaii? (Of course the hugeness problem is of a different scale in Hawaii. Their county equivalents are larger than states combined.)

Credit for the piece goes to the Bloomberg graphics department.

American Nuclear Generating Stations

Those that have followed me for a long time know that I am a big fan of nuclear power. It does have some drawbacks, namely its radioactive waste, but otherwise creates enormous amounts of stable, carbon-free electricity. So when I saw this article from Bloomberg about the impact of climate change on US nuclear powered electricity generating station. It makes use of a number of nice maps to show that, yeah, not good things.

Pennsylvania is a big state for nuclear power

I normally am not a huge fan of scaling circle size to the data point, but here it makes sense since the circles are tied to the geographical location. Like I mentioned with the one Notre Dame graphic, I’m not sure the advantage of the black background, but it could be that there is a benefit to the contrast over the white background.

There are additional maps in the piece that look at a few specific locations in a moderate hurricane and the expected storm surge. Again, not good. These also use light colours on a dark background.

Credit for the piece goes to Christopher Flavelle and Jeremy C.F. Lin.

The London Job Exodus

Brexit is bad for Britain. Here is some proof from an article by Bloomberg that looks at where London-based banking jobs are headed post-Brexit. Spoiler alert, not elsewhere in Britain. The article purports to be more of a tracker in that they will add on data about jobs moving places when news breaks. But I cannot verify that part of the piece.

What I can verify is a sankey diagram. Underused, but still one of my favourite visualisation forms. This one explores where companies’ London-based banking jobs are moving. Right now, it clearly says Frankfurt, Germany is winning.

Look at all those job…

As sankeys go, this one is pretty straightforward. Aesthetically I wonder about the colour choice. I get the blues and that the banks are coloured by their ultimate destination. But why the gradient?

But conceptually the big question would be what about London? I probably would have kept London in the destination set. While many jobs are likely to leave Britain, some will in fact stay, and those lines will need to go somewhere in this graphic.

The piece also makes nice use of some small multiple maps and tables. All in all, this is a really solid piece. It tells a great—well, not great as in good news—story and does it primarily through visuals.

Credit for the piece goes to Gavin Finch, Hayley Warren and Tim Coulter.

Where Trump Has Travelled

Okay, not entirely. But Bloomberg put together a solid series of graphics tracking not the travels of Donald Trump, but his private aircraft. But that information can serve as a rough proxy for Trump’s travels. But the data is not complete—Russia is missing from the map though he has visited the country for business.

Where Trump's private aircraft flew
Where Trump’s private aircraft flew

Credit for the piece goes to Vernon Silver, Michael Keller, and Dave Merrill.

The Structure of Europe

Well today’s the day. Earlier this morning (East Coast time) the British government notified the European Council that it invoked Article 50 and is withdrawing from the European Union. So what precisely does that mean? Well, it means the structure of the ties binding Europe will be altered. How could it not when one of Europe’s largest and most powerful countries leaves the European Union?

How all the countries of Europe fit together, and yes that includes Turkey

This piece comes from Bloomberg Politics and it deals with the overlapping structures binding Europe together. My quibble, however, is with the complexity as it now relates to the United Kingdom. Obviously where it fits is an unresolved question. But one of the trickier issues to untangle is just how Ireland and the UK fit. (And then in 2020 we can worry about Scotland’s role in the graphic.)

The Common Travel Area predates the European Union by decades and, loosely speaking, creates border-free travel between the United Kingdom and Ireland. So I tried to amend Bloomberg’s version to show the CTA.

I moved Ireland to show the complexity in its relationship with the UK

Credit for the piece goes to the Bloomberg graphics department.

The Federal Funds Rate

In my new role as data visualisation manager at the Philadelphia Federal Reserve, I am learning a lot about what the Fed does and how it does it. Needless to say, this piece from Bloomberg interested me as it displayed how the federal funds rate has changed over time.

How this potential hike cycle would compare to the two previous

What I really enjoy is how they colour-coded the two previous hiking cycles as well as what I think everyone presumes will be a new one. And those colours then move on down the piece into the dot plots. The dot plots show various potential factors in the decision-making process, and just how far off the current hiking cycle is from the two previous.

Credit for the piece goes to Chloe Whiteaker, Jeremy Scott Diamond, and Jeanna Smialek.

Mapping the Country’s Brain Drain

Alternatively known as the zombie food map. Sorry, but I couldn’t resist that one. Today we look at a piece from Bloomberg that maps brain drain across the country. What is brain drain? Basically it is the exodus of people with advanced degrees and education employed in science-y industries and fields. So this map shows us where the brains are moving from and where they are moving to.

Zombies, pay heed for feeding zones

Credit for the piece goes to Vincent Del Giudice and Wei Lu.

The US as an Energy Exporter

Several days ago OPEC, the Organisation of the Petroleum Exporting Countries, announced a cut in production to raise the price of oil. This was big news because Saudi Arabia and others had kept the price low in an attempt to undercut the nascent American shale oil and gas industry. Well…that didn’t work.

In this article from Bloomberg, you can see how the United States could be positioned to become an energy superpower. But, they also lay out the various snags and pitfalls that could dim that outlook. This map from the article details the destinations thus far of America’s natural gas, in liquefied state.

Where US liquefied natural gas (LNG) has been sent

Credit for the piece goes the Bloomberg graphics department.

Boston Beer Company

Boston Beer Company is the parent company of Sam Adams, which is definitely one of those beers I imbibe when I visit Boston. But, as one of the larger craft brewers in the United States, it finds itself under immense competition. This article from Bloomberg examines the situation the brewery finds itself in from a share price, growth, and revenue standpoint.

Small but high-margin

Credit for the piece goes to the Bloomberg graphics department.