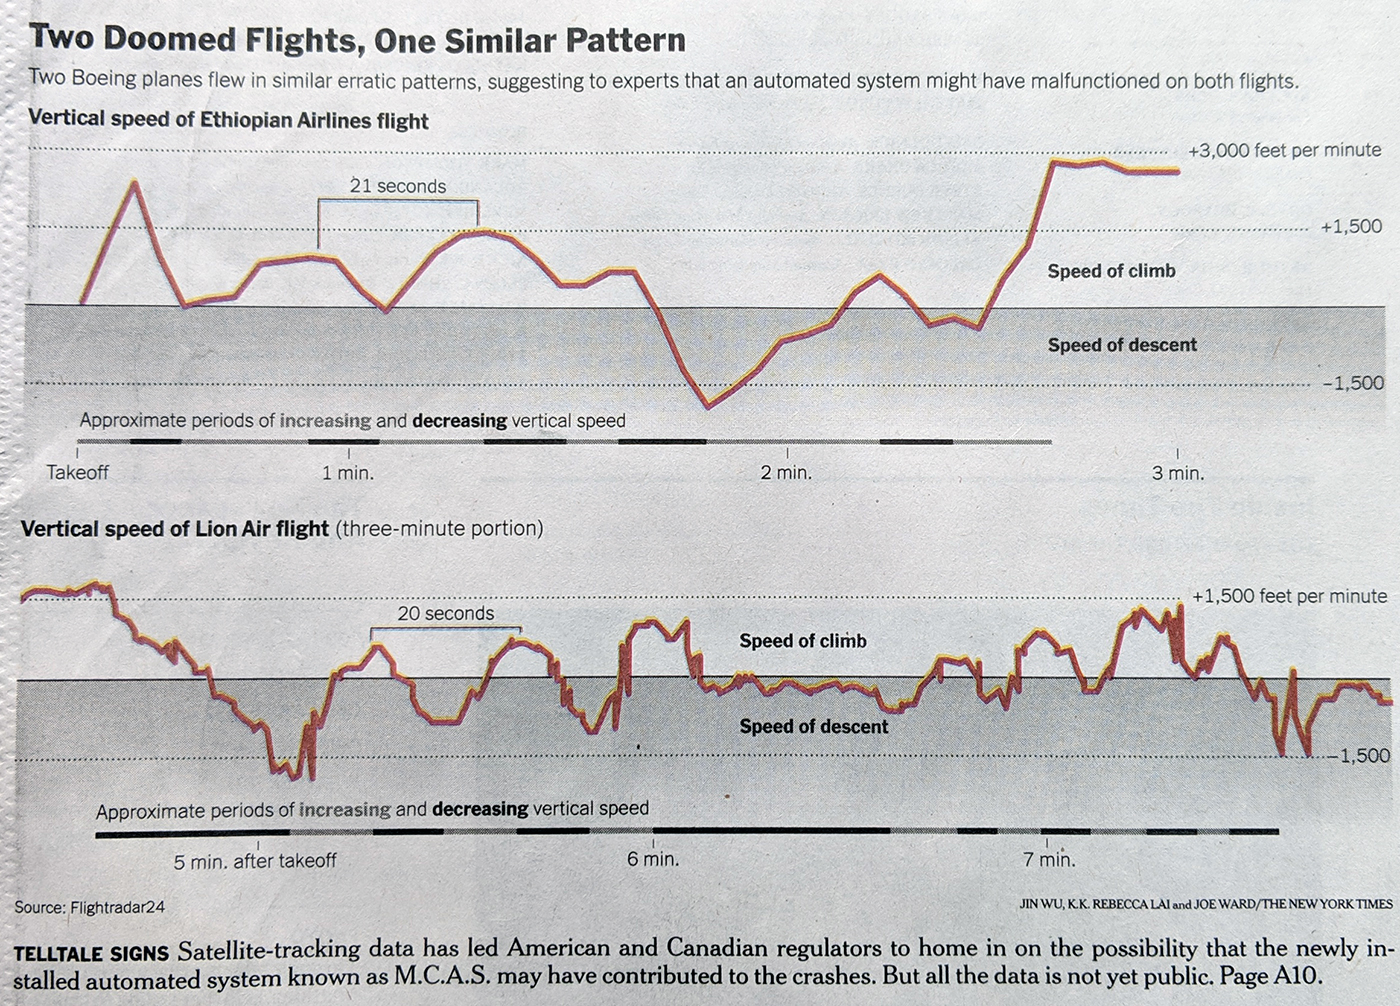
Yesterday we looked at the isolation of the US and Canada in keeping the Boeing 737 Max aircraft in the air. Later that day, both countries grounded those aircraft. Today in the print edition of the New York Times the front page used significant space to chart the vertical speed of the two crashed aircraft.
They are remarkably similar…
It uses the same scale on the y-axis and clearly shows how the aircraft gaining and losing vertical speeds. I am not sure what is gained by the shading below the 0 baseline. I do really enjoy the method of using a chart below the airspeeds to show the periods of increasing and decreasing vertical speed.
Credit for the piece Jin Wu, K.K. Rebecca Lai, and Joe Ward.
On Sunday, a Boeing 737 Max 8 aircraft crashed shortly after taking off from the airport in Addis Ababa, Ethiopia. This was the second crash in less than a year, since the another 737 Max 8 crashed into the sea shortly after taking off from Jakarta, Indonesia. And in the intervening months, there have been numerous reports to American regulators from pilots of problems with aircraft in flight. Unsurprisingly, international regulators have begun to take steps to protect their skies and their passengers from what might be an unsafe aircraft. American regulators, the Federal Aviation Administration, remains unconvinced.
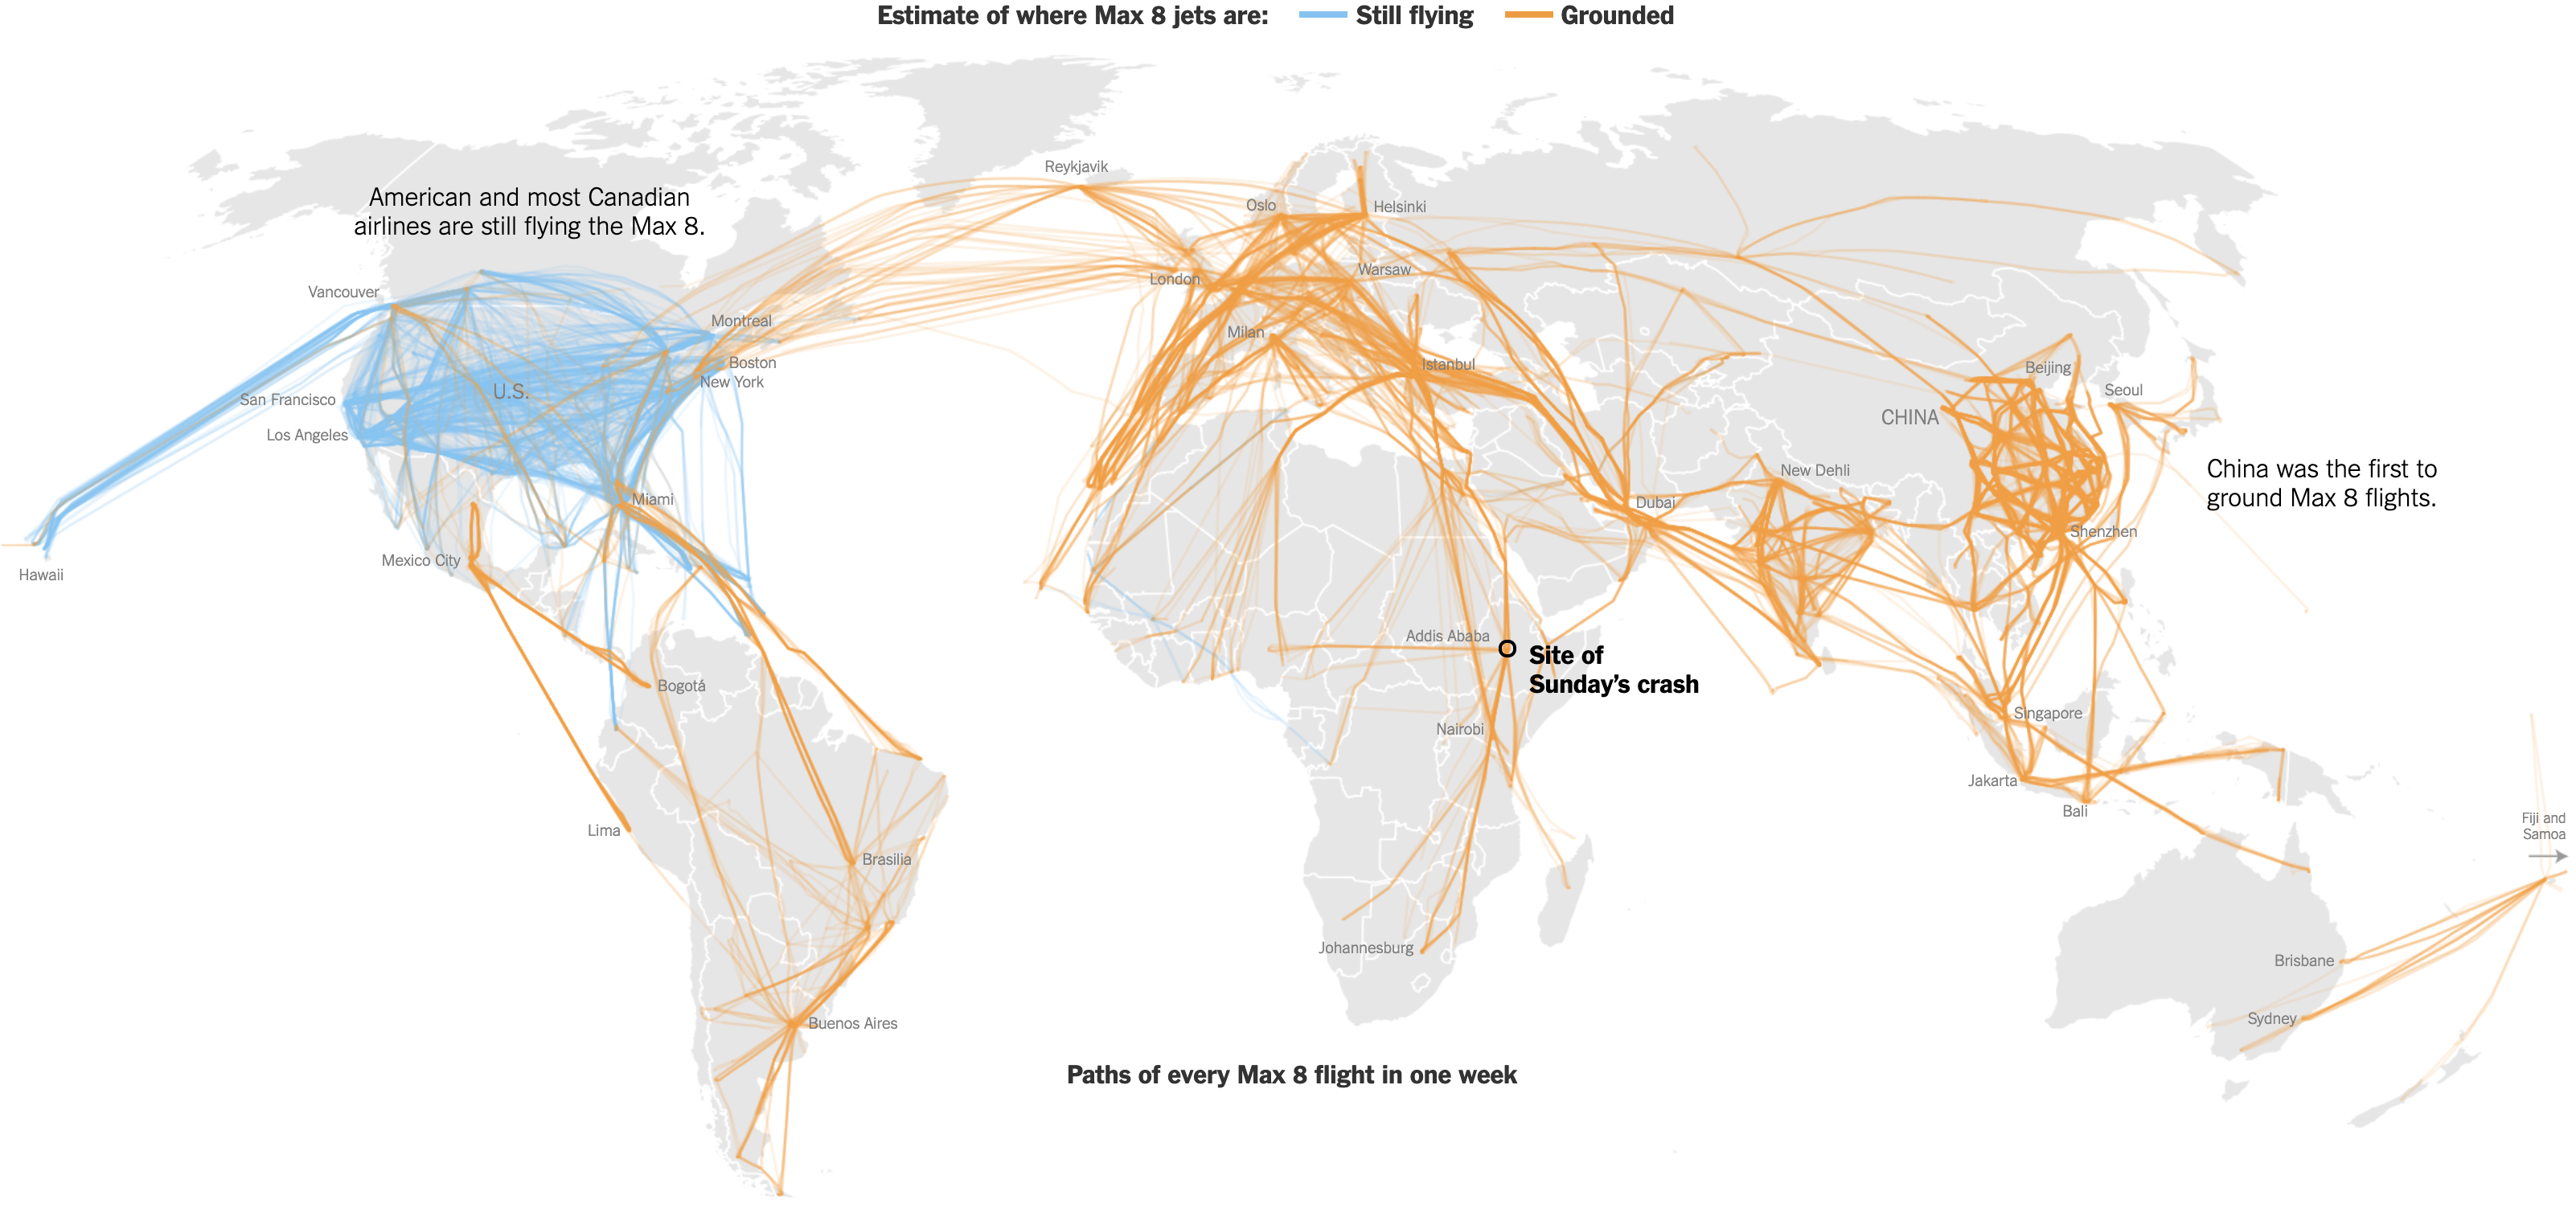
Consequently, the New York Times put together a graphics-driven article that details just how extensive the global grounding of 737 Max 8 aircraft has been in the last 24 hours.
There’s a lot more orange than blue.
It’s a route map to headline the article. And it shows that almost all aircraft on 737 Max 8 routes, except for those in Canada and the United States, have been grounded.
The rest of the article makes use of more maps highlighting the countries who civil aviation authorities have grounded flights and popular routes. It also includes a bar chart showing how many 737 Max 8 aircraft are in use with each airline and how many of those airlines have had their fleets grounded.
Overall, it’s a strong article that makes great use of graphics to illustrate its point about the magnitude of the grounding and the isolation of the United States and Canada.
Credit for the piece goes to Denise Lu, Allison McCann, Jin Wu, and K.K. Rebecca Lai.
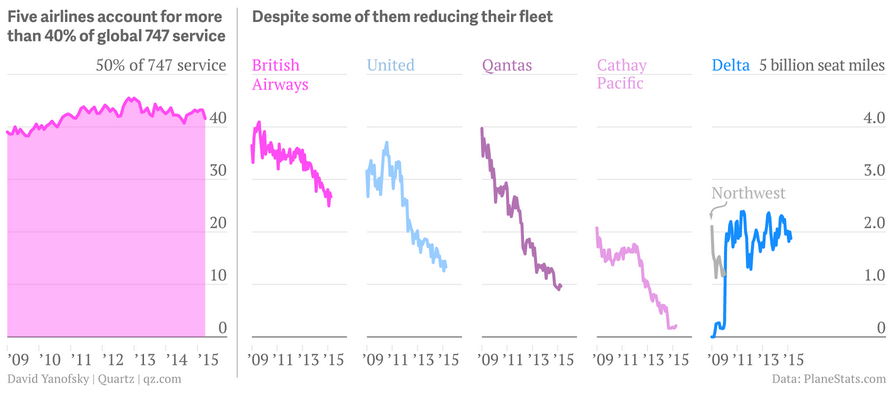
This weekend I flew to and from Philadelphia—that is when my flights were not delayed. So I decided to select an aircraft-related graphic for today’s piece, originally from Quartz. It looks at the phasing out of the iconic Boeing 747. (And as for me, well I was on a 737-900 and a CRJ-700—neither as iconic as the 747.)