The New Longest Flight

You might recall that back in March I wrote about the use of spherical maps to show great circles. This helps illustrate the actual routes that aircraft take in flight. (Yes, actual flight plans deviate based on routes, weather, traffic, &c.) At the time I wrote about how there was a soon-to-be Singapore–New York route. Ta da.

That's just a long time in one aircraft.
That’s just a long time in one aircraft.

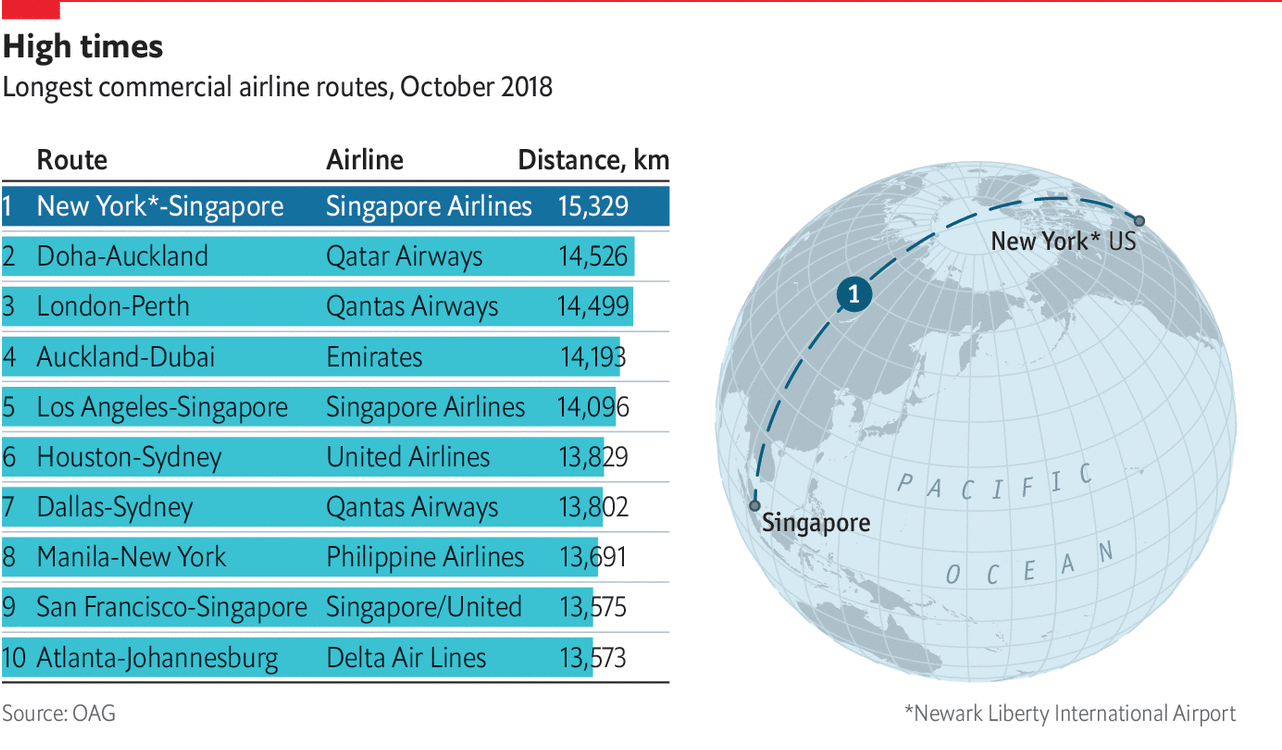
Nothing fancy here in this graphic from the Economist. It probably is just a reuse of the original but with the additional routes removed. But, I still love these kinds of maps. From a design manager standpoint, in a way this is great efficiency in that an element from a graphic made once can now, with minimal effort, be used in a second piece. And not in a meaningless, throw-in way, but this graphic does very much help to illustrate the actual route and long across the globe it travels.

In a second note, not related to the graphic itself, I want to point out a subtle change made by the Economist. This is the first online graphic to use an updated chrome, which is the branding elements that surround the actual content of the piece.

Slight changes
Slight changes

The biggest change is a new or modified typeface for the graphic header. I have not seen anything about design changes at the Economist, but I will look into it. But the changes are, again, subtle. The best example in these two comparisons (new on the left, old on the right) is the shape of the letter e.

E, as in Economist
E, as in Economist

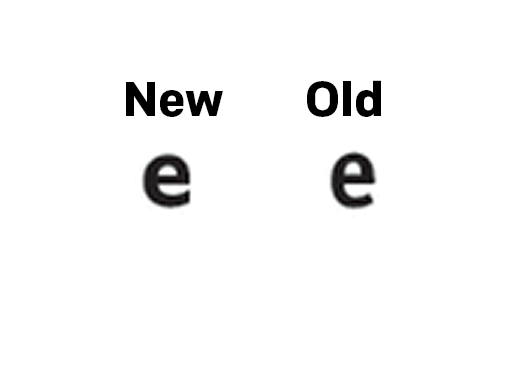
You can see how the terminal, or the part of the letter hooking and swinging out at the bottom, used to come to an end at an angle. Now it ends with a vertical chop. I haven’t looked too extensively at the typeface, but given the letter e, it appears to be a little bit wider of a face.

The other change, not quite as subtle, is the positioning of the iconic red rectangle around which so much of the Economist’s brand hangs. Bringing back the above graphic, you can see where I drew a black line to indicate the edge of the original graphic.

Slight changes

The box is now orientated horizontally (again, new is on the left), which actually brings it closer to the actual Economist logo. But, and probably more importantly, it allows the graphic’s edge to go to the, well, edge. And since their site uses generous whitespace around their graphics, they don’t necessarily need margins within the graphic.

They have also chosen to raise the level at which the header starts, i.e. there is less space between the red rule at the top of the graphic and the start of the words. This, however, appears to have been possible in the original design.

As more graphics roll out, I am going to be curious to see if there are other changes. Or even just to see how these subtle changes affect the rest of the graphics.

Credit for the piece goes to the Economist Data Team.

Europe is More than the Big States

First, I want to start with a housekeeping note. Your author will be travelling for work and then a short autumn holiday. And so while I may be able to sneak a post or two in, I generally would not expect anything until next Friday, 12 October.

But let’s end this string of posts with a map. It is a choropleth, so in one sense there is nothing crazy going on here. The map comes from the Economist, which published an article on life expectancy throughout Europe and the big takeaway is that it is lower in the east than the west.

Apparently life is pretty good in northern Spain

The great part of the map, however, is that we get to see a more granular level of detail. Usually we just get a view of the European states, which presents them as an even tone of one shade or one colour. Here we can see the variety of life expectancy in the UK, France, and Belgium, and then still compare that to eastern Europe.

Of course creating a map like this demands data to drive it. Do data sets exist for the sub-national geographic units of EU or European states? Sometimes not. And in those cases, if you need a map, the European state choropleth is the choice you have to make. I just hope that we get to see more data sets like this with more granular data to present a more complex and patterned map.

Credit for the piece goes to the Economist Data Team.

The Carolinas and Florence

As you all probably know, Hurricane Florence crashed into the Carolinas this past weekend. And while I was on holiday, I did see a few articles about the storm and its impact. This one from the New York Times captured my attention because of its use of—surprise, surprise—maps.

Hurricanes are just not fun

In particular, as the user scrolls through the experience, he or she sees the change in population density of the region from 1990 to 2010. Spoiler, a lot more people now live near the coast.

In terms of the graphic, however, I wonder if a simpler approach could have communicated that part of the story more clearly. Could the map have simply shown the change in density instead of visually transforming from one number to the next? Or maybe a summary map could have followed those transitions?

Credit for the piece goes to Stephen M. Strader and Stuart A. Thompson.

Europe’s Far-right Parties

Yesterday we looked at the rise of the far-right in Sweden based on their electoral gains in this past weekend’s election. Today, the Economist has a piece detailing their strength throughout Europe and they claim that this type of nationalist party may have peaked.

The tile map, though

The graphic fascinates me because it appears to be a twist on the box or tile map, which is often used to eliminate or reduce the discrepancies in geographic size so that countries, states, or whatevers, can be examined more easily and more equitably.

I am guessing that the ultimate sizes, which appear to be one to four units, are determined by population size. The biggest hitters of Germany, the UK, France, and Spain are all four squares or boxes whereas the smaller states like Malta are just one. (But again, hey, we can all see Malta this time.)

I think this kind of abstraction will grow on me over time. It is a clever solution to the age-old problem of how do we show important data in both Germany and Malta on a map when Malta is so geographically small it probably renders as only a few pixels.

On the other hand, I am not loving the line chart to the right. I understand what it is doing and why. And even conceptually it works well to show the peaks of the parties. However, there are just a few too many lines and we get into the spaghettification of the chart. I might have labelled a far fewer number and let most sit at some neutral grey. Or, space permitting, a series of small multiples could have been used.

Credit for the piece goes to the Economist Data Team.

Swedish Election Results

Sweden went to the polls this past weekend and the results are mostly in, with overseas ballots left to be counted. But the results are clear, a stark rise for the nationalist Sweden Democrats, though not as high as some had feared late last week.

Not surprisingly we had the standard parliamentary seat chart, seen below by the BBC. The nice twist this time is the annotations stating the seat change. (More on that later.)

An unnerving amount of yellow

It does a good job of showing the parties and how they are laid out, though I am sometimes more partial to a straight-up bar chart like below at Reuters.

Here the Sweden Democrats are grey.

However, both do not do a great job in showing what would traditionally be a kingmaker result for Sweden Democrats. When stacked at each end, neither the centre-left bloc, led by the Social Democrats, nor the centre-right, led by the Moderates, are in control of a majority of seats in the Riksdag. Imagine that neutral colour straddling a 50% benchmark line or sitting in the middle of the seats. It makes it far clearer just how pivotal the Sweden Democrats would usually be. Because, usually, Sweden Democrats or parties like it—in the sense of it won a large number of seats—that help the main coalition cross that 50% threshold would have an enormous sway in the next governing coalition. But here, the Sweden Democrats are an anti-immigrant, nationalist party that both the centre-left and centre-right have said with whom they will not enter talks.

Here the Sweden Democrats are brown.

But graphically, the thing I always find lacking in charts like those above are just how dramatic the rise of the Sweden Democrats has been. And so for that, we have this little piece of mine that complements the two. Because not all members of the coalitions experienced the declines of their major parties, the Social Democrats and the Moderates. In fact, with the exception of the Green Party, all others rose or, in the case of the Liberals, stayed flat. A more thorough defeat would have probably seen the whole of the coalition falling in the number of seats. Unfortunately for Sweden, in this case, the nationalists took the lion share of the seats lost by the top two parties.

Credit for the BBC piece is mine.

Credit for my work is mine.

Which of These Countries Does Not Belong

For those of you reading from the States, I hope you all enjoyed your holiday. And for my UK readers, I hope you all enjoyed your summer bank holiday last weekend. So now to the good and uplifting kind of news.

Something is clearly not right here.

Indeed, a chart about deaths from firearms from the Economist. From a graphical standpoint, we all know how much I loathe stacked bar charts and this shows why. It is difficult for the user to isolate and compare the profiles of certain types of firearm violence against each other. Clearly there are countries where suicide by gun is more prevalent than murder, but most on this list are more murder happy.

And then the line chart that is cleverly spaced within the overall graphic, well, it falls apart. There are too many lines highlighted. Instead, I would have separated these out into a separate chart, made larger, so that the reader can more easily discern which series belongs to which country. Or I would have gone with a set of small multiples isolating those nine countries.

I am also unclear on why certain countries were highlighted in the line chart. Did they all need to be highlighted? Why, for example, is Trinidad & Tobago. It is not mentioned in the article, nor is it in the stacked bar chart.

But the biggest problem I have is with the data itself. But, every one of the countries on that list is among the developing countries or the least developed countries. Except one. And that, of course, is the United States.

Credit for the piece goes to the Economist Data Team.

The Toll of the Trolls

This is an older piece that I’ve been thinking of posting. It comes from FiveThirtyEight and explores some of the data about Russian trolling in the lead up to, and shortly after, the US presidential election in 2016.

They're all just ugly trolls. Nobody loves them.
They’re all just ugly trolls. Nobody loves them.

The graphic makes a really nice use of small multiples. The screenshot above focuses on four types of trolling and fits that into the greyed out larger narrative of the overall timeline. You can see that graphic elsewhere in the article in its total glory.

From a design standpoint this is just one of those solid pieces that does things really well. I might have swapped the axes lines for a dotted pattern instead of the solid grey, though I know that seems to be FiveThirtyEight’s house style. Here it conflicts with the grey timeline. But that is far from a dealbreaker here.

Credit for the piece goes to Oliver Roeder.

The Rise of Online Dating

This past weekend I cited this article from the Economist that looked at the rise of online dating as a way of couples meeting. There was some debate about which channels of interaction/attraction still worked or were prevalent. And it turns out that, in general, the online world is the world today.

Meeting your partner in primary/secondary school has clearly gone out of fashion since the 40s.

My problem with the graphic is that it is a bit too spaghettified for my liking. Too many lines, too many colours, and they are all overlapping. I probably would have tried a few different tricks. One, small multiples. The drawback to that method is that while it allows you to clearly analyse one particular series, you lose the overlap that might be of some interest to readers.

Second, maybe don’t highlight every single channel? Again, you could lose some audience interest, but it would allow the reader to more clearly see the online trend, especially in the heterosexual couple section of the data. You could accomplish this by either greying out uninteresting lines or removing them entirely, like that primary/secondary school series.

Third, I would try a bit more consistent labelling. Maybe increase the overall height of the graphic to give some more vertical space to try and label each series to the right or left of the graphic. You might need a line here or there to connect the series to its label, but that is already happening in this chart.

However, I do like how the designers kept the y-axis scale the same for both charts. It allows you to clearly see how much of an impact the online dating world has been for homosexual couples. My back-of-the-envelope calculations would say that is more than three times as successful than it is for heterosexual couples. But that insight would be lost if both charts were plotted on separate axis scales.

But lastly, note how the dataset only goes as far as 2010. I can only imagine how these charts would look if the data continued through 2018.

Credit for the piece goes to the Economist Data Team.

Big Bulls

Last Thursday, the US entered its longest bull market in history. And the New York Times covered the story on the front page, which makes this another episode of covering graphics when they land on the Times’ front page. Of course, last week was a big news week away from the economy and so it is no surprise that the above-the-fold coverage was on the scandals besetting the president and those of his team who have pleaded guilty or been convicted of crimes by juries.

The front page design

But you will note that below the fold is that nice little graphic. Here we see it in more detail.

Bull runs
Bull runs

What I like about the graphic is how it uses the blue fill to draw attention to the bull markets but then also labels how long each was. Those keen on the story will note there is a debate whether a particular 19.9% drop qualifies for the 20% drop usually used to benchmark the beginning and ending of a bull market. That is why there is that second label with the black arrows on the graphic.

It also uses the negative space created by the shape of the graphic to contain its title, text, and caption information.

Credit for the piece goes to Karl Russell.

The Global Middle Class

Even the Washington Post admits there sort of is no such thing, because standards vary across the world. But broadly speaking, you have enough for the essentials and then a little extra to spend discretionarily. The concept really allows us to instead benchmark global progress in development. Regardless, yesterday the Post published a calculator that allows you to compare household income across the world to that global middle class.

A 40k earning American is at the very top of the global middle class

The catch, however, is that income is priced in US dollars, which is the currency of very few countries. But thankfully, the Post gives the methodology behind the calculator at the end of the piece so you can understand that and the other little quirks, like rural vs. urban China.

From a design standpoint, there is not much to quibble with. I probably would not have opted for red vs. green to showcase global middle and global lower-than-middle class. But the concept certainly works.

Credit for the piece goes to Leslie Shapiro and Heather Long.