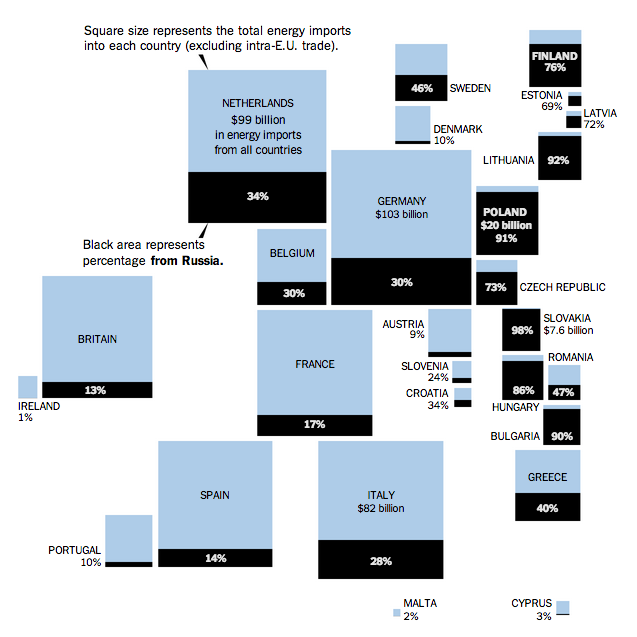
Today’s post is a graphic from the New York Times that looks at Russia’s hold on energy across Europe. I’m not terribly keen on this particular graphic for a few reasons. First, the design needs to incorporate the actual datapoint so the reader can compare across countries. Comparing the height of each black bar to each other is difficult at best.
Secondly, the data excludes the energy trade between European Union countries. And that strikes me as potentially quite a lot. Just because a country is importing from another EU country does not mean it is importing less.
Russian gas market in the EU
Credit for the piece goes to the New York Times graphics department.
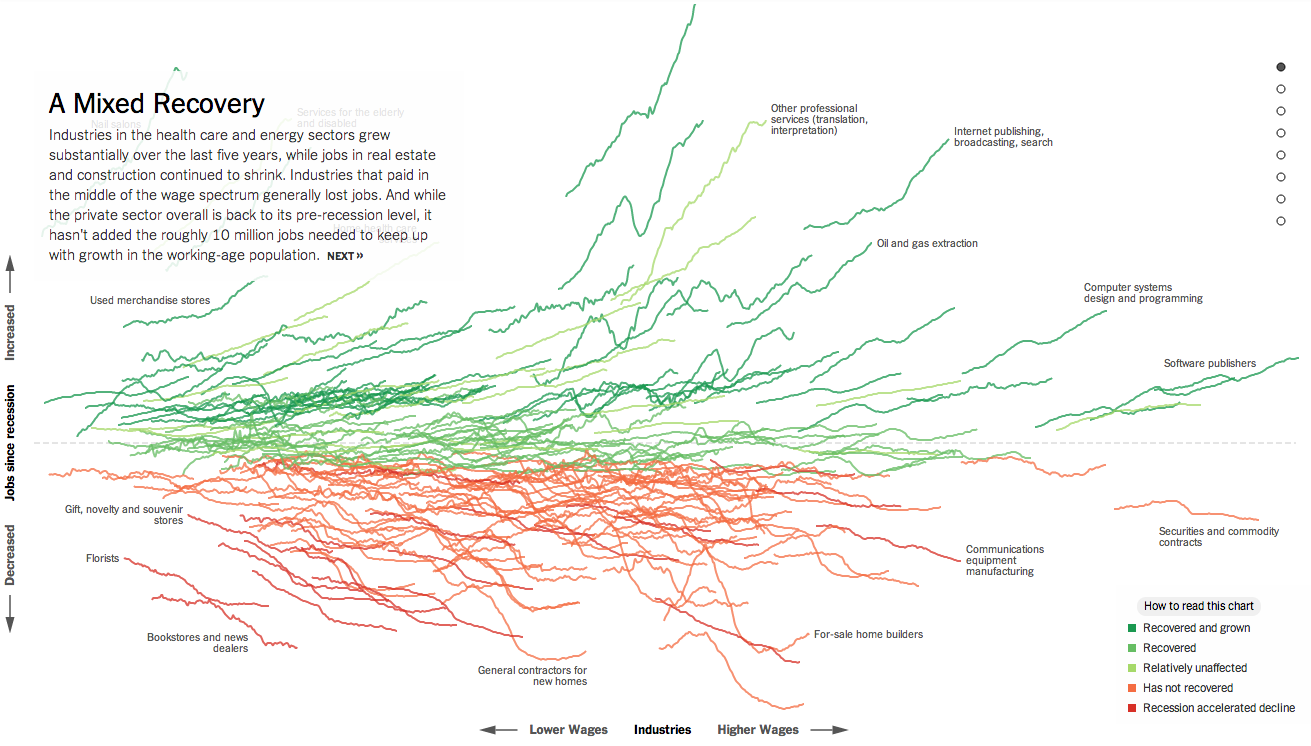
Normally I try to reserve Fridays for the lighter stuff. But yesterday, the New York Times published a really fantastic piece about how the Great Recession changed the American economy through job growth or loss in each sector of the economy. Naturally this sounds very difficult because the American economy is both very large and very diverse.
Job growth in the American economy
If you check the piece out, however, you will find that you are offered a guided tour with analysis to provide context to an otherwise jumble of coloured lines. As a bonus, highlighted words in the text bring up small charts showing the actual job growth history for the particular sector. The jumble, however, is also organised along the x and y axes by two important metrics: wages and jobs since the Great Recession. This allows you to see whether low wage jobs have performed better than higher paying and whether either has created more jobs than the other. Line colouration denotes whether a particular sector has grown and recovered, recovered, not recovered, or recession accelerated a previous decline.
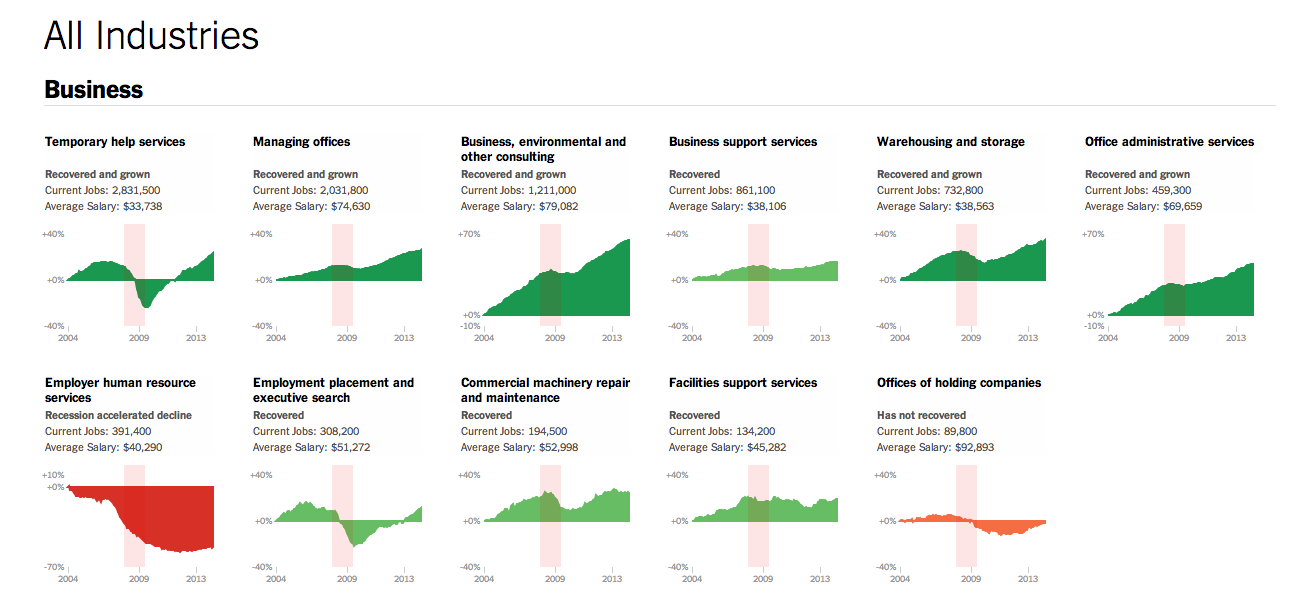
Then at the very end is another really great part of the piece. This is a collection of all the small charts arranged by areas of the economy.
View sectors individually as small multiples
Lastly, for those of you who have to work on smaller screens, don’t worry, they made it responsive. Overall, a great piece.
Credit for the piece goes to Jeremy Ashkenas and Alicia Parlapiano.
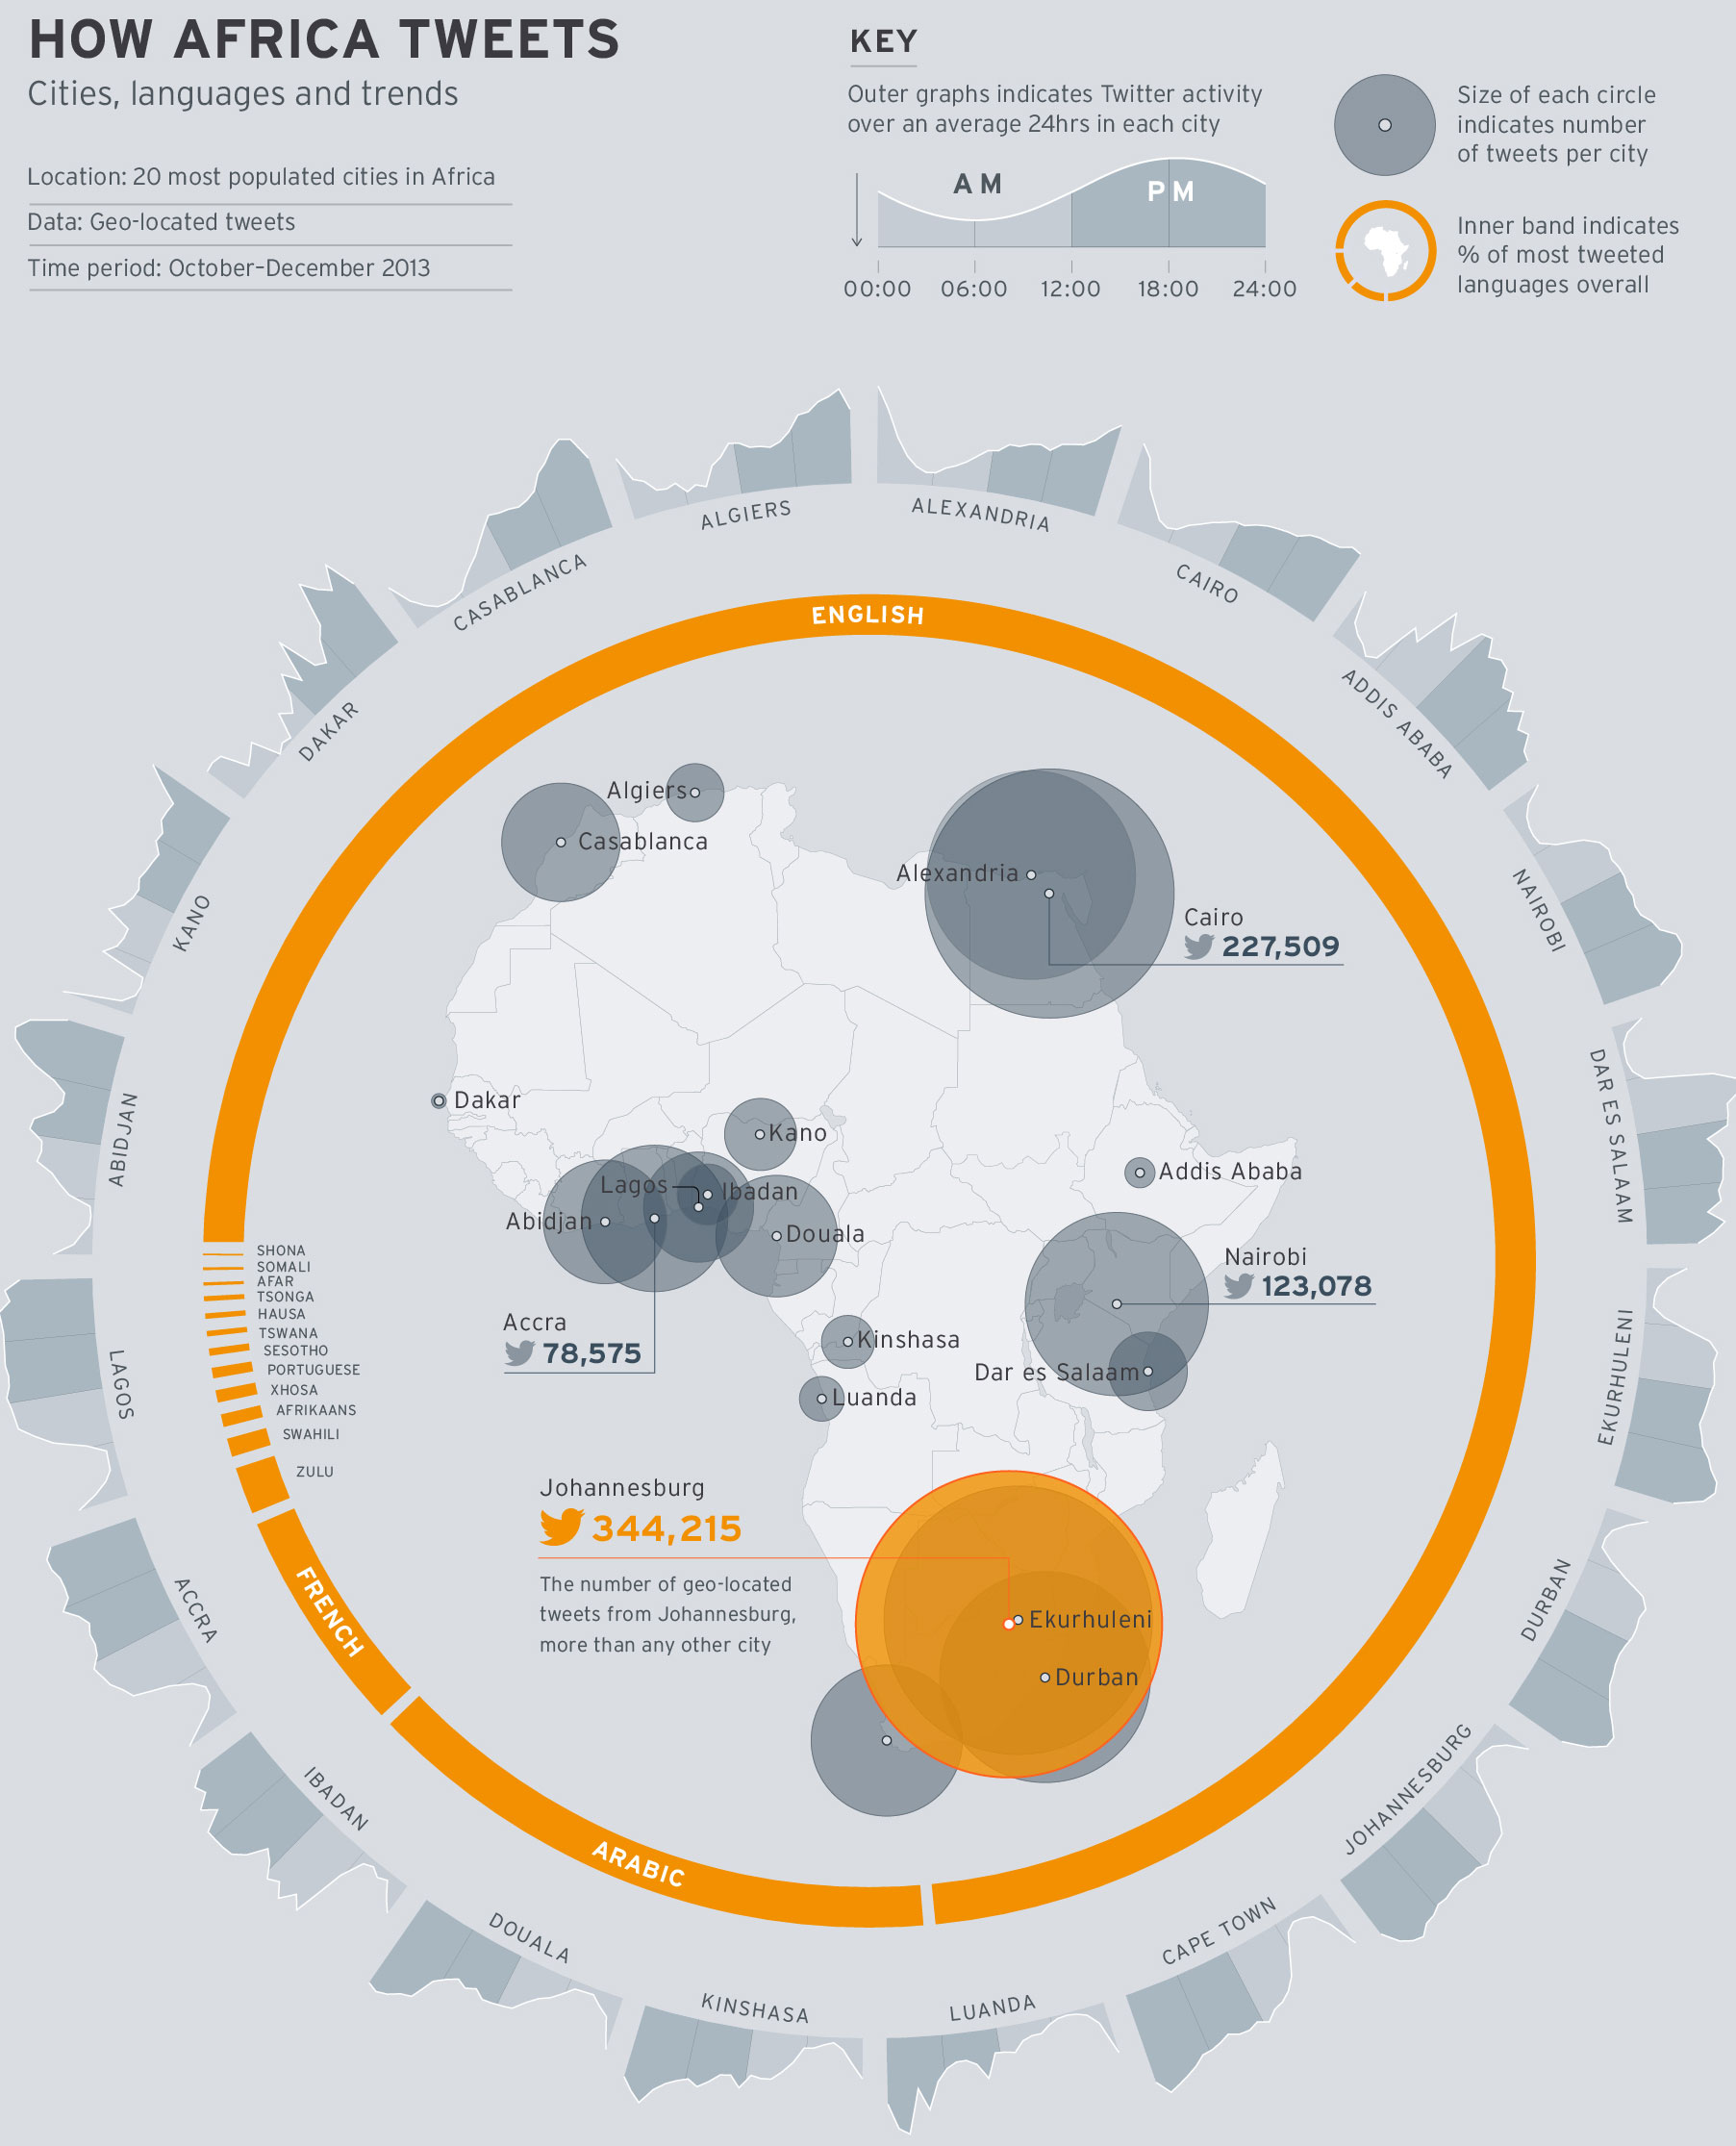
Today’s piece is hit and miss. It comes from the World Economic Forum and the subject matter is the use of Twitter across Africa. I think the subject matter is interesting; mobile communication technology is changing Africa drastically. The regional trends shown in the map at the core of the piece are also fascinating. Naturally I am left wondering about why certain countries. Does spending on infrastructure, GDP per capita, disposable income levels have any sort of correlation if even only on a national and not city level?
How Africa tweets
But what really irks me is the content that wraps around the map. First the donut chart, I think my objections to donuts—at least the non-edible kind—are well known. In this case, I would add—or sprinkle on—that the white gaps between the languages are unnecessary and potentially misleading.
Secondly, the cities are eventually displayed upside down. Thankfully the labels are reversed so that city names are legible. However, the continually changing angle of the chart makes it difficult to compare Douala to Luanda to Alexandria. A neatly organised matrix of small multiples would make the data far clearer to read.
In short, I feel this piece is a good step in the right direction. However, it could do with a few more drafts and revisions.
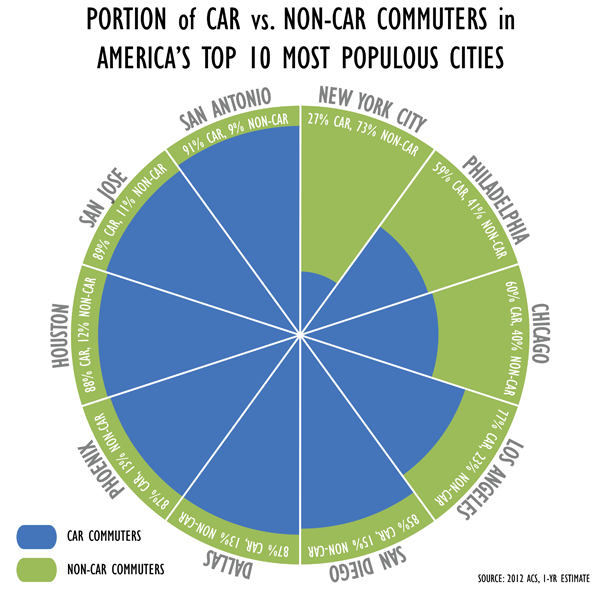
In fact, don’t do this ever. Today’s bad chart comes from the Philadelphia Mayor’s Office of Transportation and Utilities. I saw it and could only shake my head and wonder why.
The Mayor’s Office version
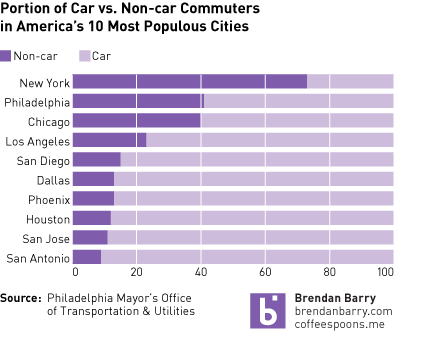
Something more like this much more easily communicates the story.
My take on the data
Credit for the original piece goes to the Mayor’s Office of Transportation and Utilities.
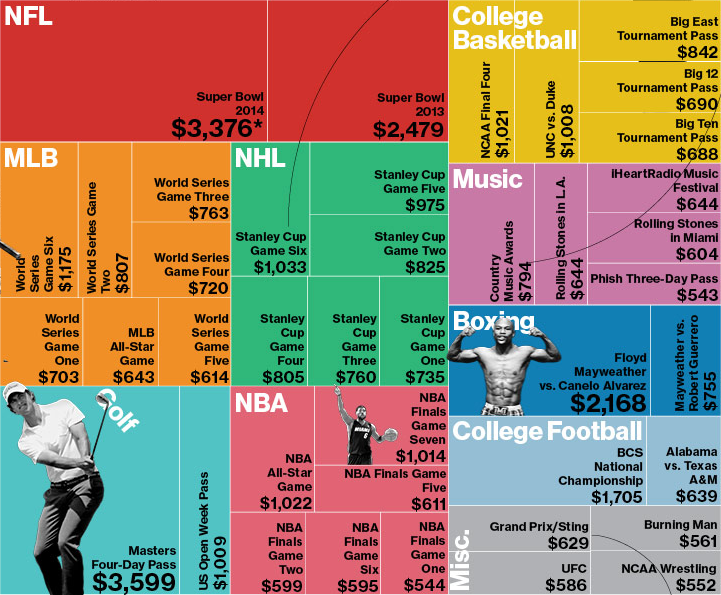
So yeah, the Super Bowl thing. Apparently tickets are expensive? Earlier, Bloomberg Businessweek took a look at average prices for the most expensive events of 2013. The only sentence supporting the graphic was that the most expensive event was not the Super Bowl. Okay, so what was?
Most Expensive Average Ticket Prices
I think this graphic actually makes it more difficult to tell. But beyond that, the decision to use the tree map confuses me. We are already looking at a subset of ticket prices—not all, but only the “most expensive”. What criteria determined that selection? After all, from my own experience and personal knowledge I know that Red Sox–Yankees game are also incredibly expensive. But those are not present in this set. And then if the idea is to undermine the common thought that the Super Bowl is the most expensive ticket, should the user be forced to find through each square—and no, the events are not squarified very nicely—the highest value?
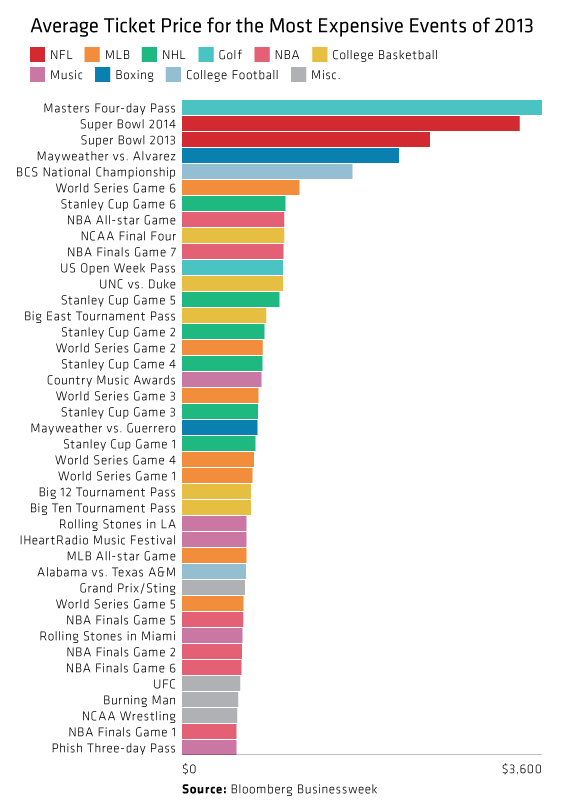
So I took an hour before the game to try a quick stab at quickly identifying the most expensive tickets. It turns out that the glorious bar chart more than suffices. It also then shows how quickly the remainder of the prices become quite comparable. (Ridiculous I suppose depends upon your preference for sport/event/disposable income.)
My quick take
Credit for the original piece goes to Bloomberg Businessweek.
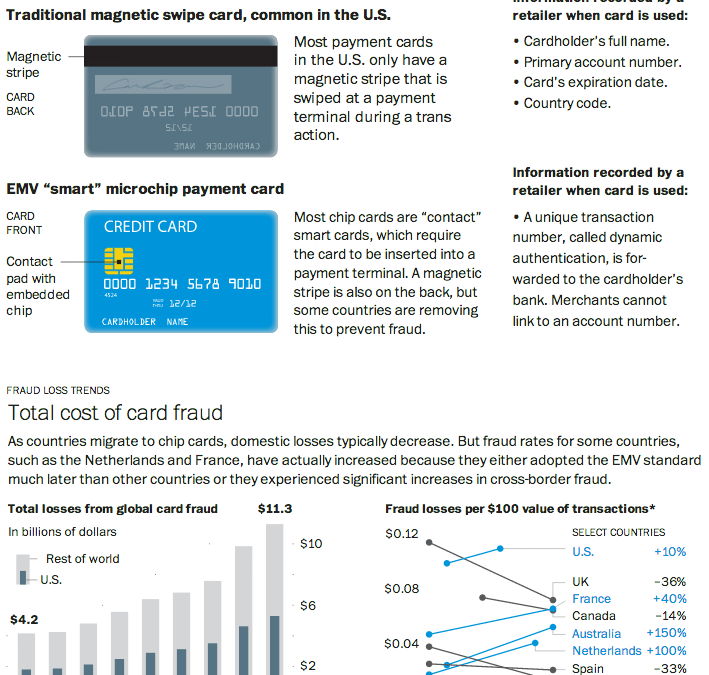
As I noted in my Friday post, I spent last week in Lithuania for work. That same Friday night, I had a conversation with a few coworkers over dinner and a beer about credit cards. They teased me that for all of America’s technological advances and advantages, even in Lithuania they were using more secure forms of bank card payment: chipped cards. And that story seems a perfect segue into today’s post from the Washington Post.
Through a combination of charts, maps, and illustrations—a cropping of which is shown below—the Post details the advantages of using microchipped cards in preventing certain types of fraud. Additionally, because of the integration of the visuals with the written explanations, text can be used to provide longer anecdotes to explain exceptions and outliers when and where necessary.
Yesterday the BBC published an article about the success of the United Kingdom’s creative industry especially given the not-so-successful economy of the last few years. Unfortunately, the article included the tree map below.
A not so necessary tree map
The problems are a few. First, a tree map is usually looking at two variables. One is encoded through the size of the block and the other often its colour. Here, colour means nothing. So you are instead looking at only the size of the blocks. Basically, the same type of information that would be clearer to differentiate if this were a bar chart.
Second, a tree map has a hierarchy of placement. In other words, even if you cannot tell how much larger one block is from another—we all know we are not so great at comparing areas—you know which block is larger than the other by their arrangement in the map. Here we see no such hierarchy. The smallest block follows the largest block, which itself follows three other blocks.
Now that arrangement would be acceptable if the tree map were nested. That is to say if the different industries were grouped within like industries. Because then you would order those nested blocks. But that is also something not happening here.
All in all, this would have been a lot more effective of a chart if it had simply been made into a bar chart.
Credit for the piece goes to the BBC graphics department.
Okay, we have all watched enough science fiction to know that there is not one future, but multiple futures. All options existing as if taken in parallel universes. Today’s post is not about a specific graphic, but rather a short article in the New York Times examining data visualisation. Through the work of Eric Rodenbeck of Stamen Design, it looks at how we may need to change our current vocabulary, if you will. Naturally the article offers a counterpoint nearer the end about how older forms are still useful.
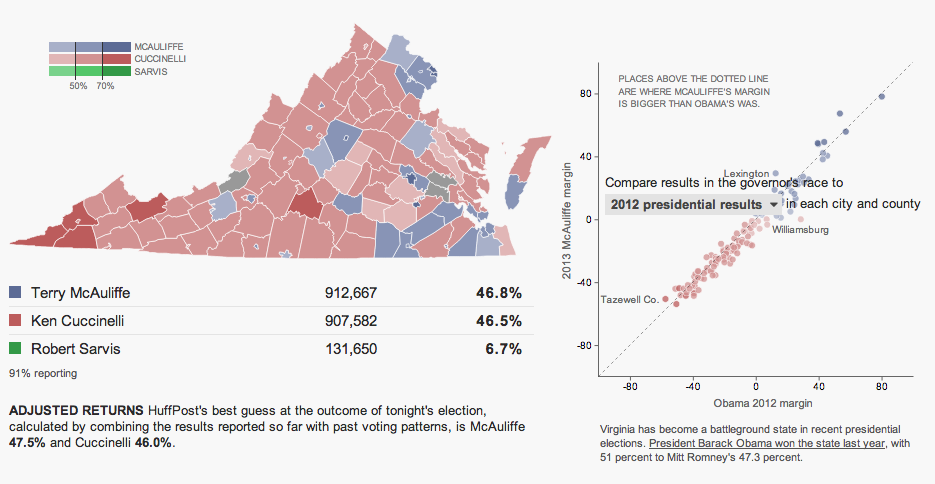
Last night was election night. Okay, maybe not the big midterm, but there were still a few interesting races. The one I want to look at it, however, is the gubernatorial race in Virginia. Maps are pretty much the default in big, statewide races like these and it is no surprise that the three screenshots here are use a map as an anchor component.
The Huffington Post uses a scatterplot to compare the margin of victory for Terry McAuliffe to that of Barack Obama in 2012. A technical flaw places the drop down menu atop the plot, unfortunately, but the component works to show differences in just one year.
Huffington Post results
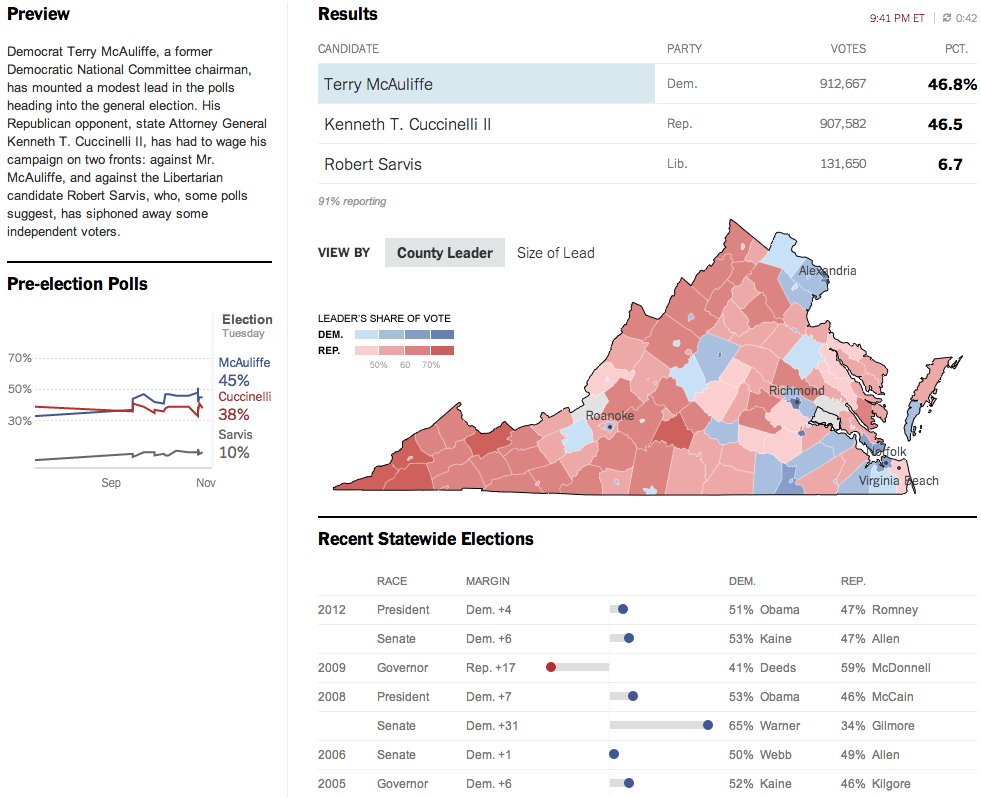
Over at the New York Times, the Virginia results were given a nice overview. Here they used a text summary to explain the race in short. They used a small amount of space to show polling results over time. And then beneath the map they looked at recent elections across the state.
New York Times results
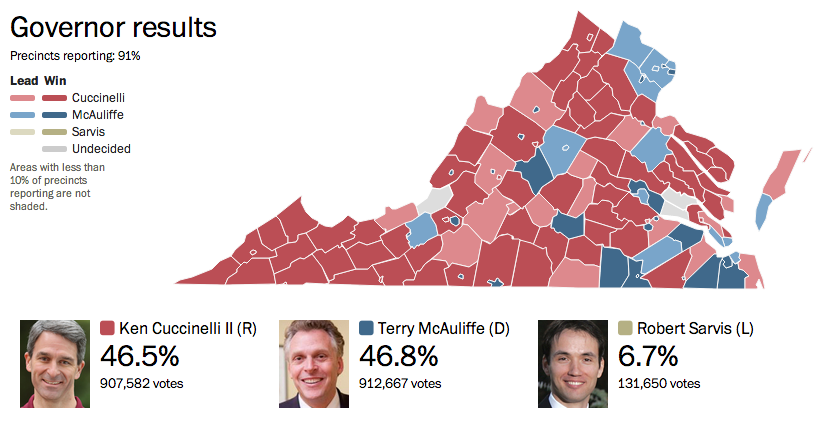
The Washington Post, which reports to the northern counties of Virginia, had a much simpler piece. They used solely a map to present the data.
Washington Post results
Credit for the Huffington Post piece goes to Aaron Bycoffe, Jay Boice, and Hilary Fung.
Credit for the New York Times piece goes to the New York Times’ graphics department.
Credit for the Washington Post piece goes to the Washington Post’s graphics department.
I didn’t see a lot of informative graphics regarding the shooting at LAX. But, here are two pieces. The first is from the Los Angeles TImes. Terminal 3 is rendered in three dimensions. Different buttons add views of the remainder of the airport.
Los Angeles Times’ terminal diagram
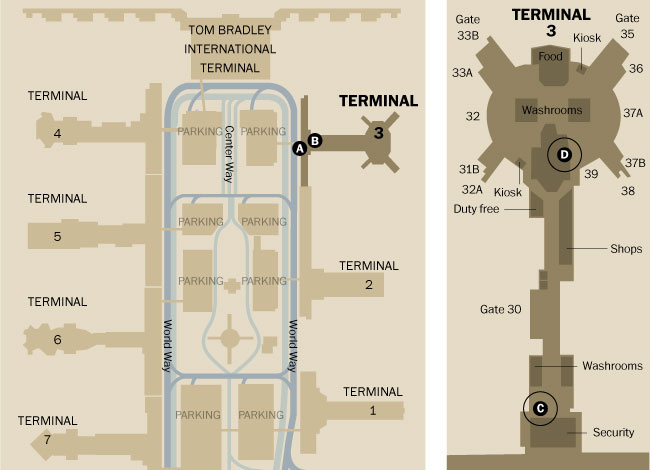
The Washington Post opted for a flat, two-dimension drawing in one graphic with both all of LAX and Terminal 3 in the same graphic.
Washington Post’s terminal diagram
The thing about the three-dimensional rendering is that it adds too much complexity whereas the two-dimensional schematic strips most of it out. Is it important to know the specific details of a building? Or is it more important to see its general shape and an area inside of it?
Credit for the Los Angeles Times piece goes to Javier Zarracina, Raoul Ranoa, Lorena Iniguez, and Anthony Pesce.