A Look Back

Well, we are one day away now. And I’ve been saving this piece from the New York Times for today. They call it simply 2016 in Charts, but parts of it look further back while other parts try to look ahead to new policies. But all of it is well done.

I chose the below set of bar charts depicting deaths by terrorism to show how well the designers paid attention to their content and its placement. Look how the scale for each chart matches up so that the total can fit neatly to the left, along with the totals for the United States, Canada, and the EU. What it goes to show you is best summarised by the author, whom I quote “those 63 [American] deaths, while tragic, are about the same as the number of Americans killed annually by lawn mowers.”
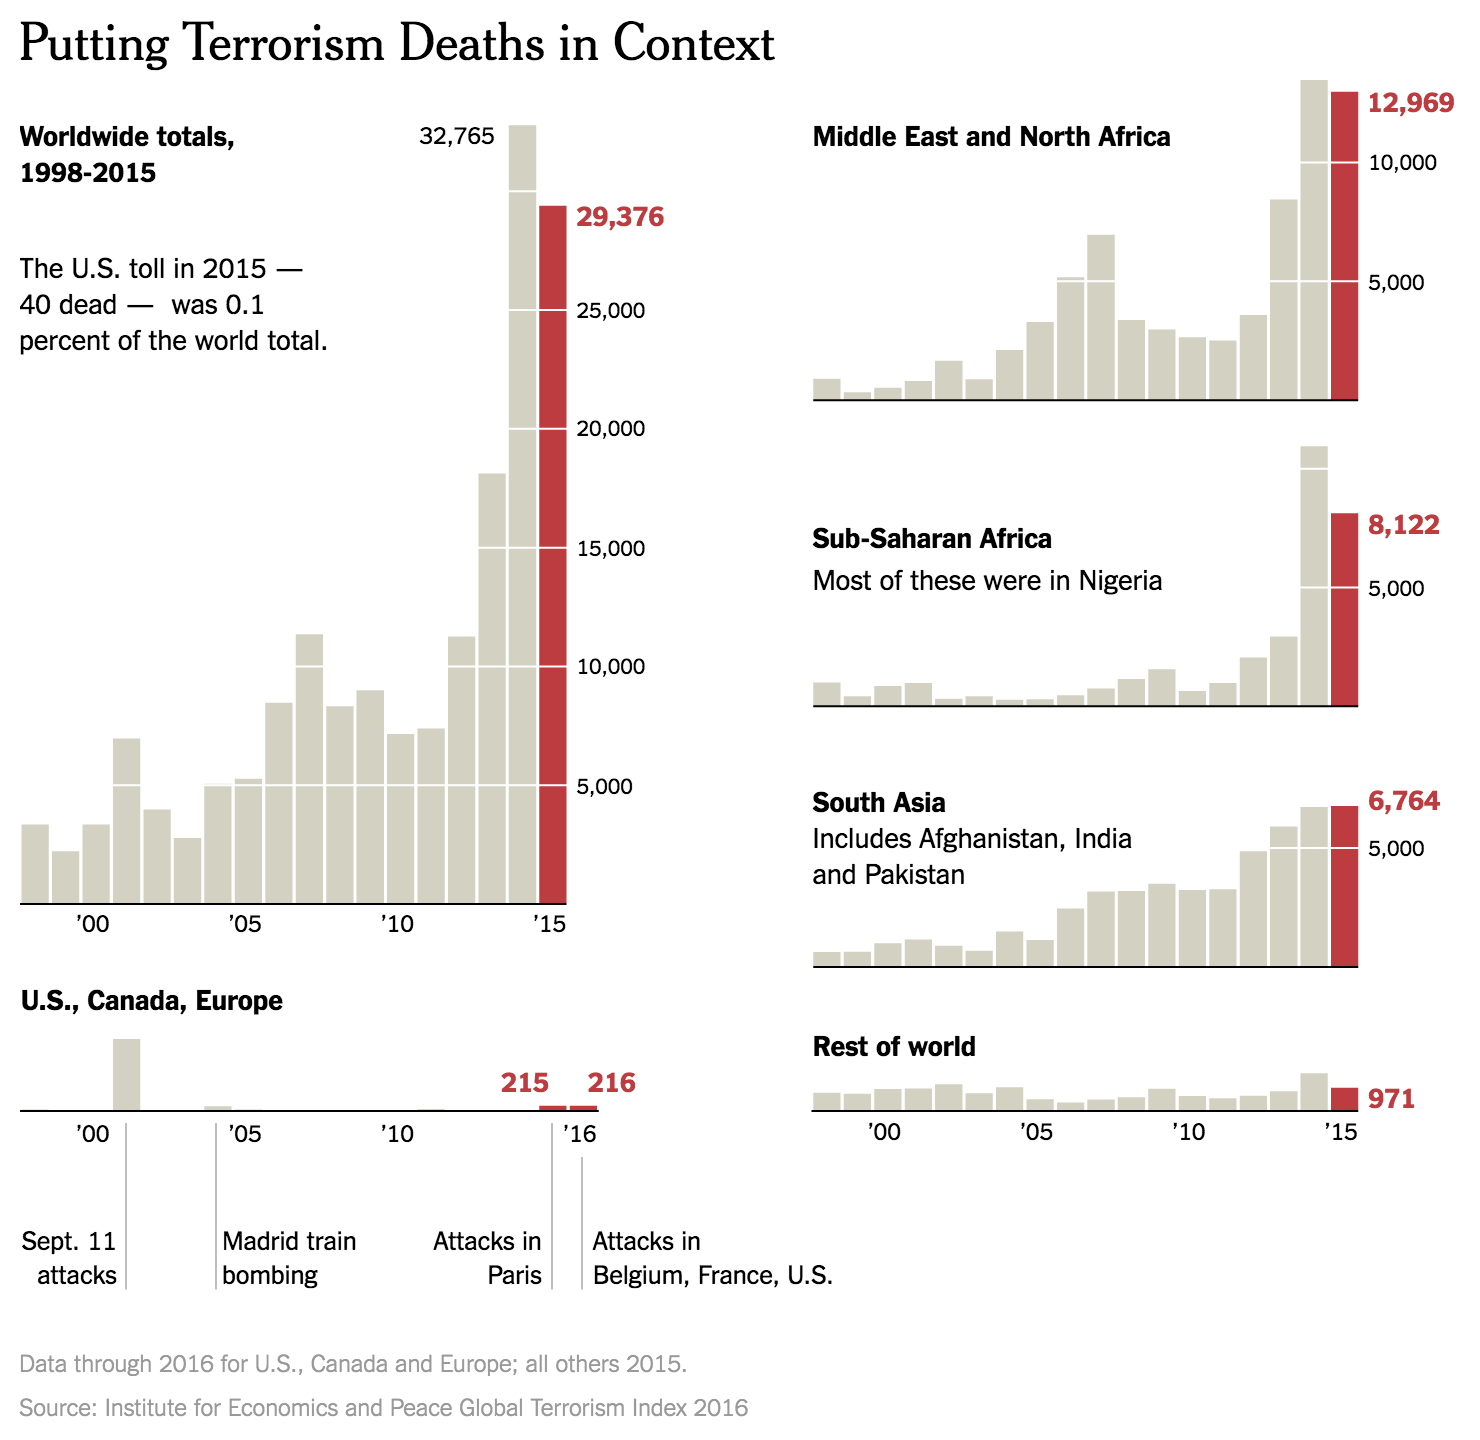
Deaths by terrorism
Deaths by terrorism

I propose a War on Lawn Mowers.

The rest of the piece goes on to talk about the economy—it’s doing well; healthcare—not perfect, but reasonably well; stock market—also well; proposed tax cuts—good for the already wealthy; proposed spending—bad for public debt; and other things.

The commonality is that the charts work really well for communicating the stories. And it does all through a simple, limited, and consistent palette.

But yeah, one day away now.

Credit for the piece goes to Steven Rattner.

The US Abortion Rate

If you have heard enough about the Affordable Care Act, well, you could be listening to the desire to defund Planned Parenthood. Because, while that organisation cannot use any federal funding for abortions, it is the nation’s largest provider of that service. So if you follow that logic, you must strip all federal funds from the organisation.

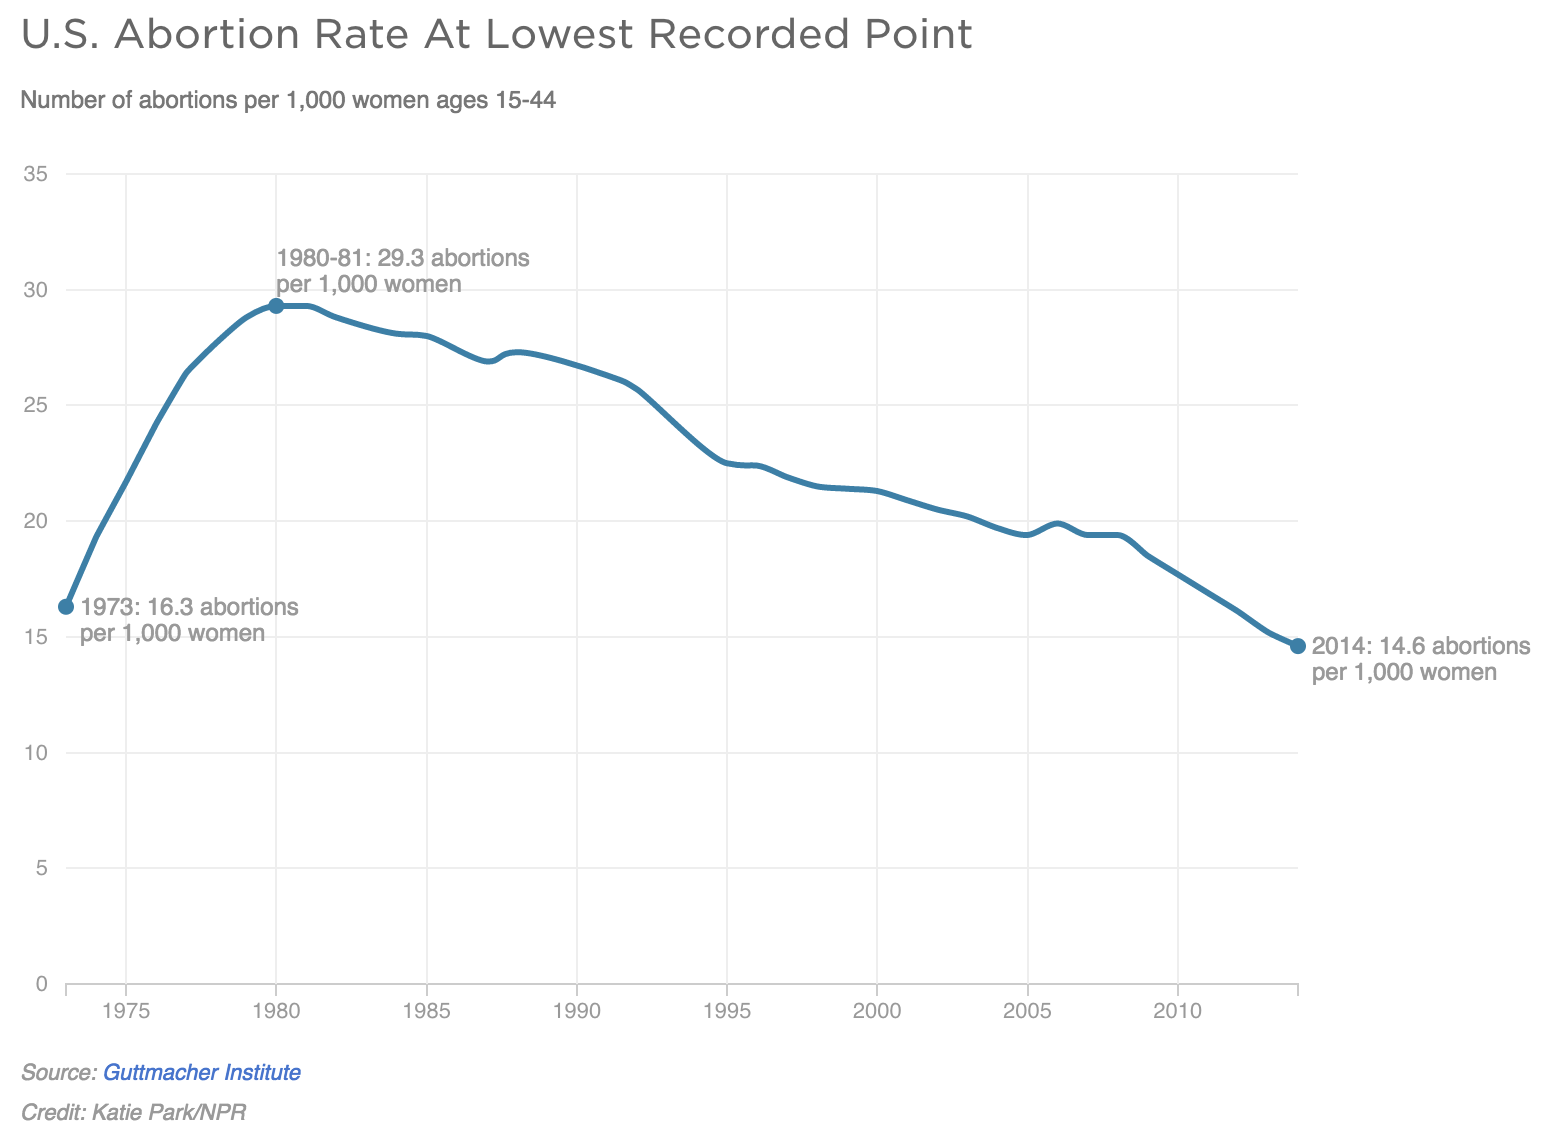
Yeah, it makes no sense. But whatever, those are part of the Republican plans. But, if you look at the data, abortion rates are now at the lowest level since Roe v. Wade in the 1970s.

The US abortion rate is at its lowest rate since Roe v. Wade

Mole hill, meet Mountain.

Credit for the piece goes to Katie Park.

The Affordable Care Act You Likely Know as Obamacare

It just won’t die. Grandma, that is, in front of the death panels of Obamacare. Remember those? Well, even if you don’t, the Affordable Care Act (the actual name for Obamacare) is still around despite repeated attempts to repeal it. So in this piece from Bloomberg, Obamacare is examined from the perspective of leaving 27 million people uninsured. In 2010, there were 47 million Americans without insurance and so the programme worked for 20 million people. But what about those remaining 27?

I am not usually a fan of tree maps, because it is difficult to compare areas. However, in this piece the designers chose to animate each section of the tree as they move along their story. And because the data set remains consistent, e.g. the element of the 20 million who gained insurance, the graphic becomes a familiar part of the article and serves as a branching off point—see what I did there?—to explore different slices of the data.

This is a tree map I actually think works well

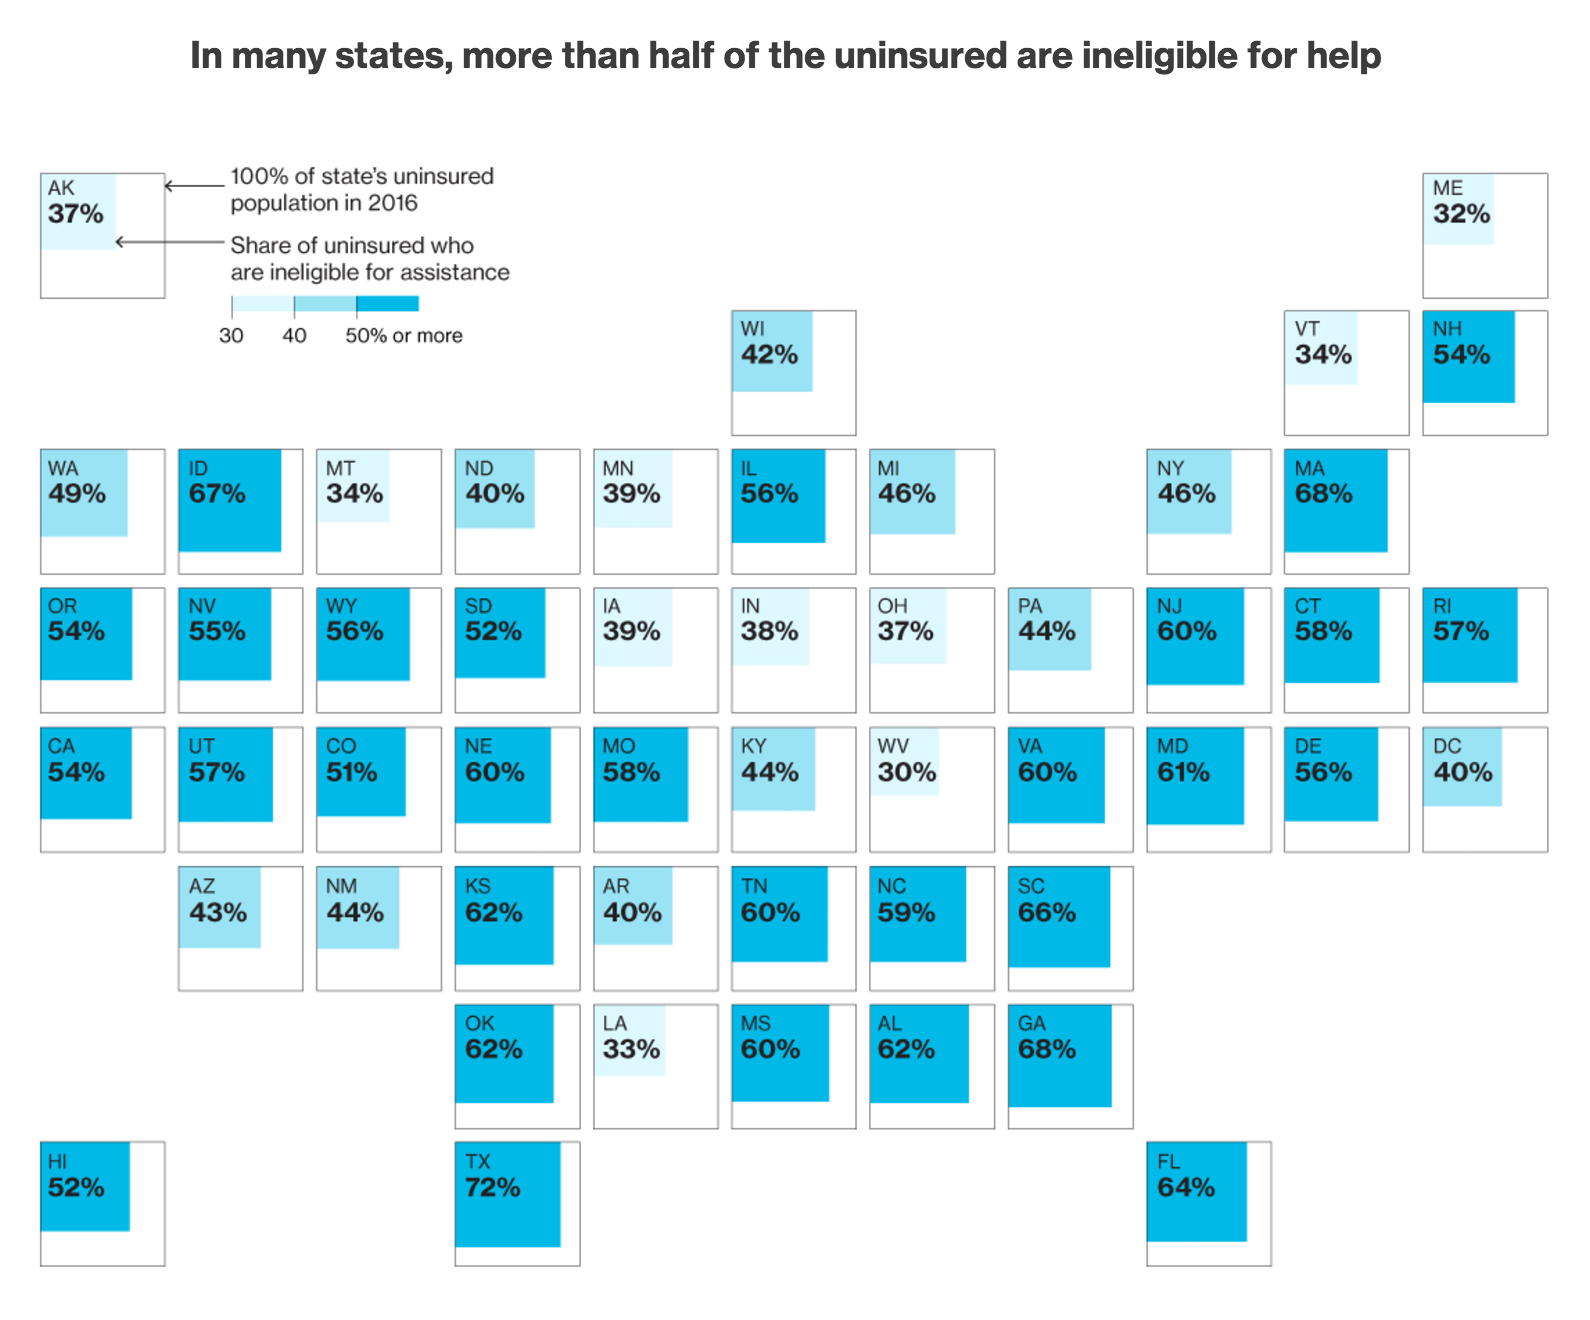
So in the end, this becomes one of those cases where I actually think the tree map worked to great effect. Now there is a cartogram in the article, that I am less sure about. It uses squares within squares to represent the number of uninsured and ineligible for assistance as a share of the total uninsured.

I'm not sure the map is necessary here
I’m not sure the map is necessary here

Some of the visible patterns come from states that refused to expand Medicaid. It was supposed to cover the poorest, but the Supreme Court ruled it was optional not mandatory and 19 states refused to expand the coverage. But surely that could have been done in a clearer fashion than the map?

Credit for the piece goes to Jeremy Scott Diamond, Zachary Tracer, and Chloe Whiteaker.

Two Tales of One City

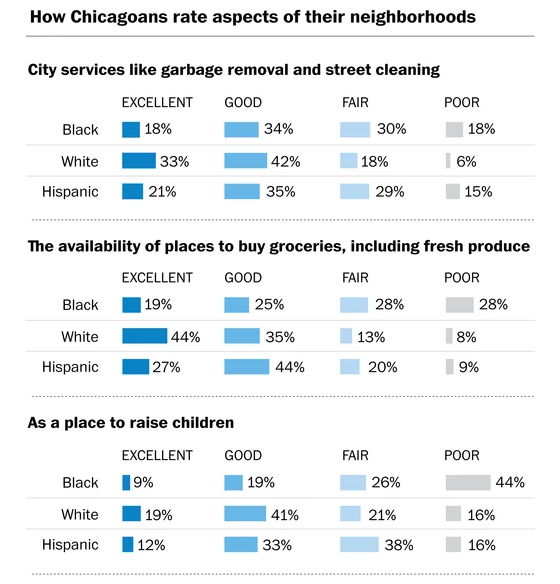
Dickens is not my favourite, but that felt an appropriate title for today’s piece from the Washington Post on Chicago residents’ opinions on, well, Chicago. Turns out there is a notable demographic split on how residents feel about various things in the city.

Some of the issues
Some of the issues

Credit for the piece goes to Emily Badger.

How Moderate is John Kasich

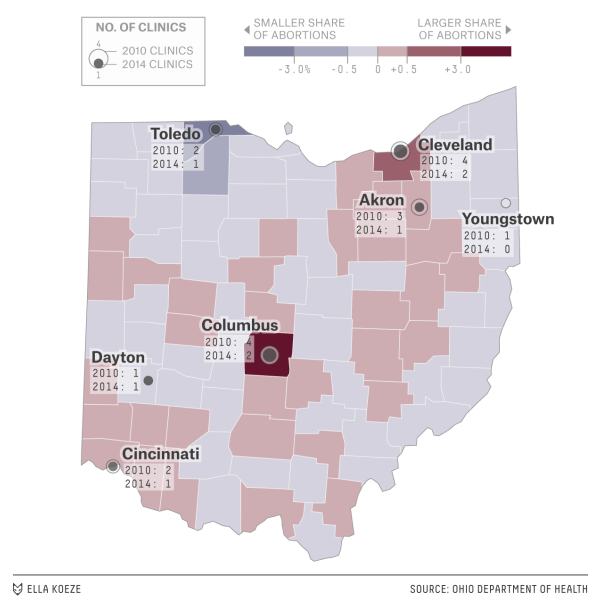
Last night contained one victory for John Kasich. The Ohio governor outlasted all but Trump and Cruz and therefore represents the only establishment candidate. He also supposedly represents the moderate wing of the Republican Party. But within an article on FiveThirtyEight is a map showing how he may not be as moderate as he claims. Kasich has signed legislation creating difficult conditions for clinics and so many have closed.

Abortions and clinics

Credit for the piece goes to Ella Koeze.

An Ebola Treatment Centre

Last week we looked at the BBC and its rendition of an Ebola treatment centre. This week we are looking at the Washington Post and how they treated the same material. As you can imagine, with the same source material, the treatment is fairly similar. I do appreciate the colour applied to the various elements called out in the illustration. Though, to be super nitpick-y, I could probably do less orange with the fence. It becomes a bit distracting from some of the other details.

An Ebola treatment centre

Credit for the piece goes to Patterson Clark.

Ebola

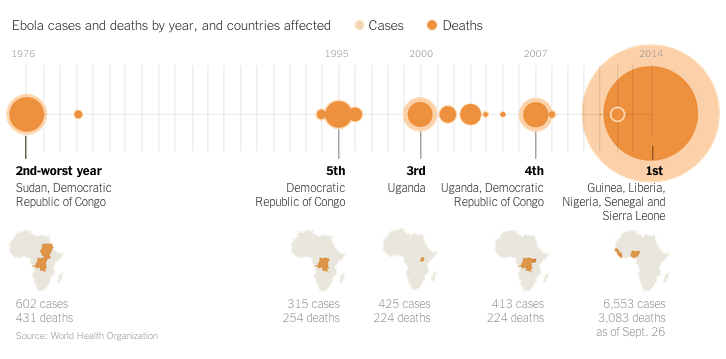
I really enjoy reading articles where graphics accompany the text and not just for the want of graphics. While the Ebola outbreak in West Africa is tragic, the data allows for some nice visualisation pieces. Additionally, one could say that the United States is victim to quite a bit of scaremongering as a result of a few isolated cases of Ebola in Dallas, Texas. Spoiler, an Ebola outbreak is not really a threat to the United States or Western Europe. Perhaps to relieve some of said scaremongering, the New York Times has a nice article titled Ebola Facts that outlines just that, the facts about Ebola. And guess what? The article is accompany by a number of useful inline graphics.

Ebola outbreaks
Ebola outbreaks

Credit for the piece goes to the New York Times’ graphics department.

Ebola Treatment Centres

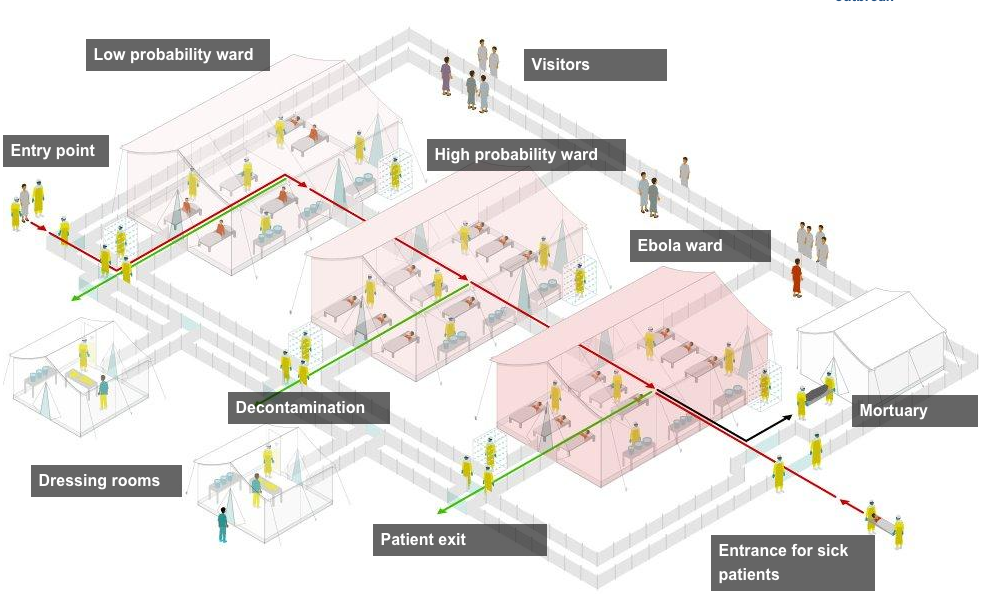
Ebola is still a thing. And it is still getting worse. Or rather, with deaths and/or infections in both Europe and the United States, we are finally paying a bit more attention to it. We have no cure for Ebola, but we still need to treat people for symptoms, but most importantly we need to isolate those infected from the broader population. How and where is this done? Thankfully, the BBC put together an interactive graphic illustrating a typical treatment centre. Each main section is a clickable link that explains the functions and key points to the different areas.

A treatment centre
A treatment centre

The article goes on to explain in more detail what is going on and does so with photos and also a map of treatment centres in Guinea, Sierra Leone, and Liberia.

Credit for the piece goes to the BBC graphics department.

Falling Costs of Medicare

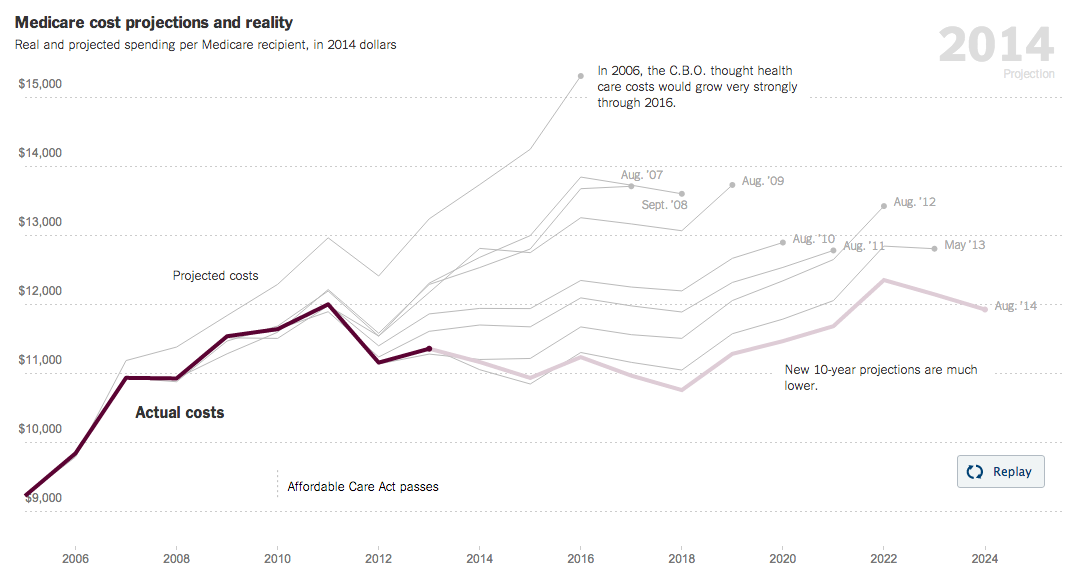
Medicare is one of those things that everybody has feared in terms of its impact on our long-term debt and deficit. The New York Times looks at the falling projections over time through a nice, animated line chart. The accompanying article places the cause for these to two factors. First, technical reductions that mean behaviour changes among medical care professionals and patients. Second, to spending reductions through the Affordable Care Act.

Falling spend on Medicare per recipient

Credit for the piece goes to Margot Sanger-Katz and Kevin Quealy.

An Increase in Sexually Transmitted Infections in Boston

Your humble author has returned to Chicago from several days spent in Boston—among other places. So what better way to follow up on yesterday’s post about prostitution than a small piece from the Boston Globe about the increase in sexually transmitted infections (STIs) in Boston. The cause? Hook-up apps. Because, technology and young people.

Rise in STIs in Boston

Credit for the piece goes to the Boston Globe’s graphics department.