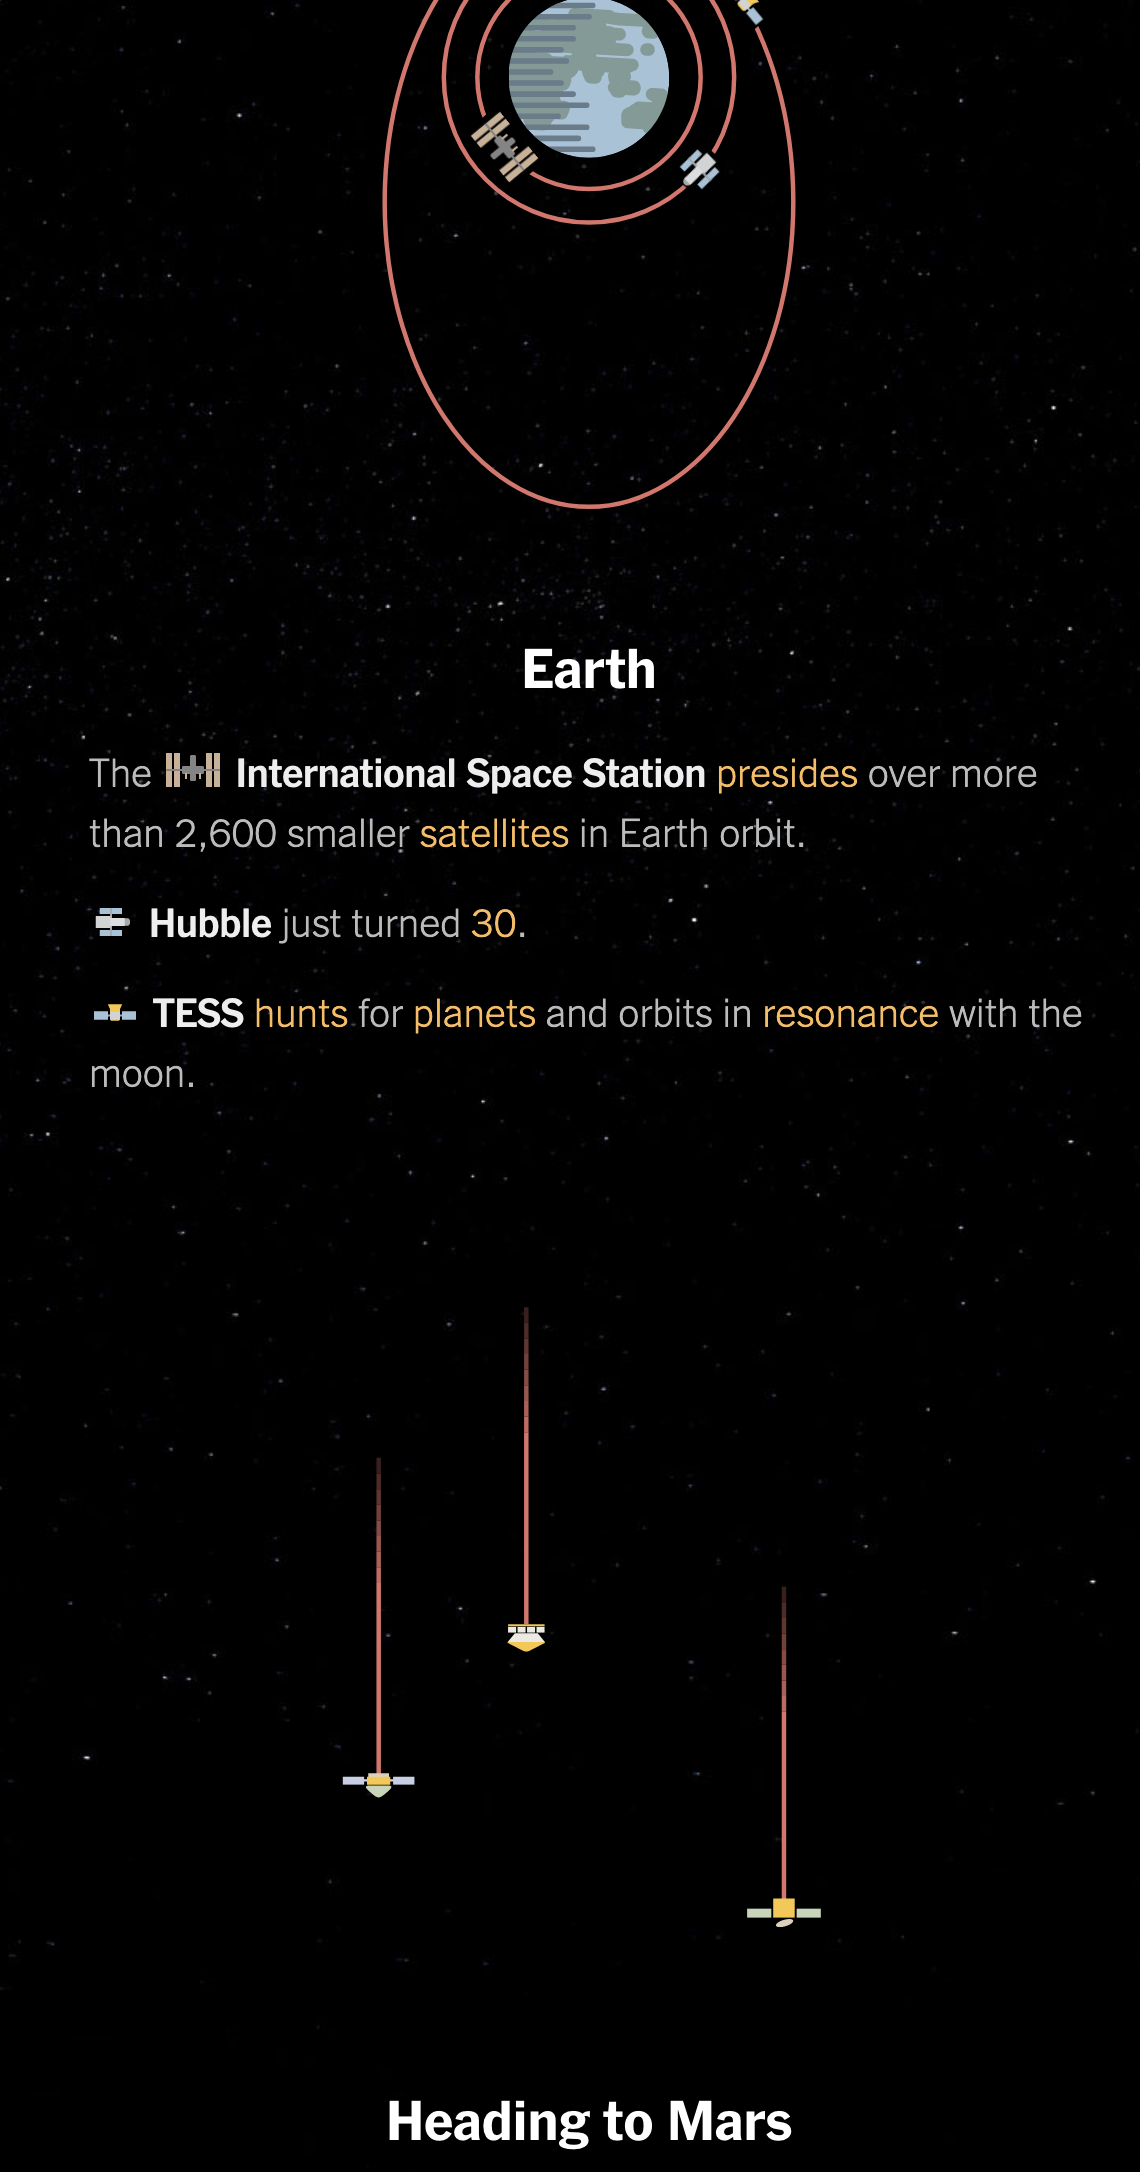
Early tomorrow morning, weather permitting, NASA’s Perseverance rover will blast off from Cape Canaveral on a six-plus month trip to Mars. There, hopefully it will land successfully and join all the rovers that have come before.
And so this piece from the New York Times feels appropriate. It’s a great illustration of all the spacecraft we have sent into space, including the active and inactive, with some notable exceptions.
I really like how it pays attention not just to the planets and their satellites (like the Moon), but also the comets, asteroids, and even the Lagrange points. And it does this all with small illustrations of the spacecraft.
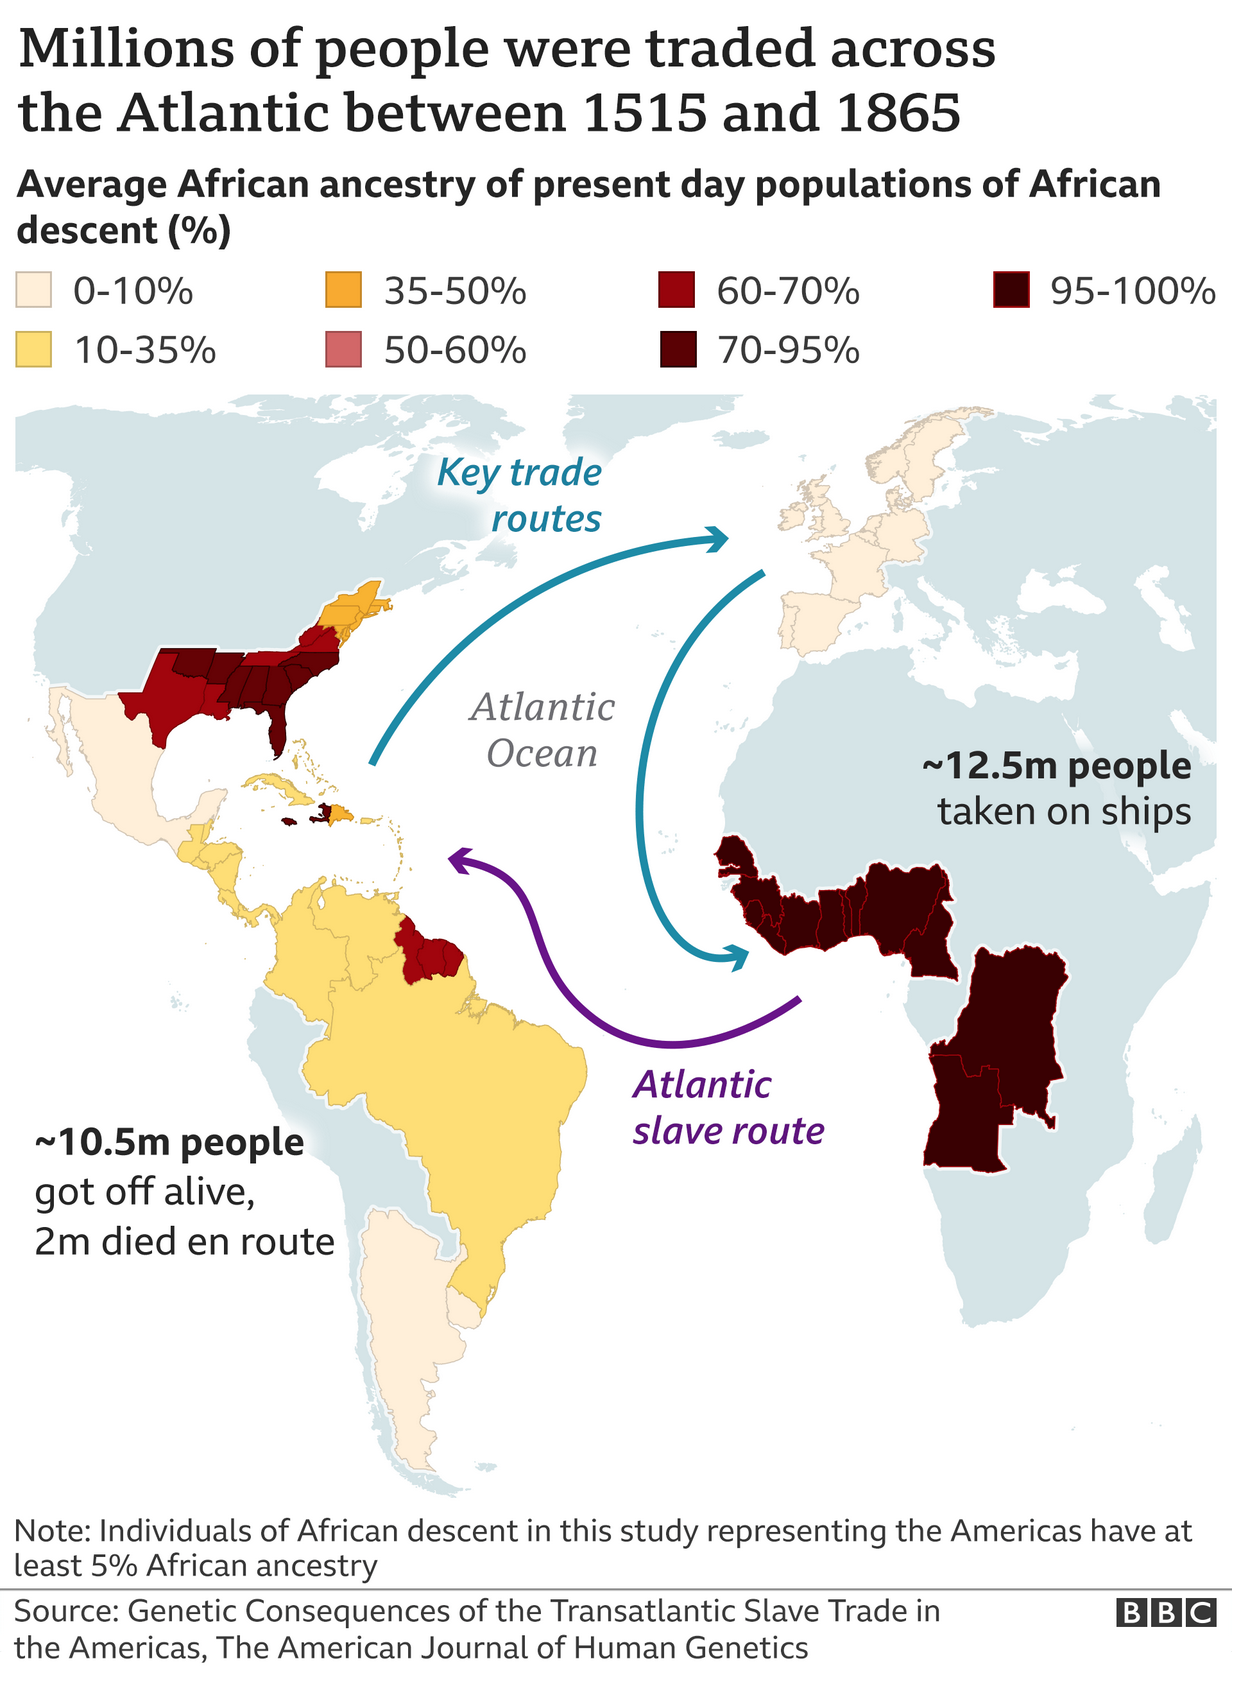
A study published last week explores the long-lasting impact of the Atlantic triangle trade of slaves on the genetic makeup of present day African Americans. Genetic genealogy can break down many of what we genealogists call brick walls, where paper records and official documentation prevent researchers from moving any further back in time. In American research, slavery and its lack of records identifying specific individuals by name, birth, and place of origin prevents many descendants from tracing their ancestry beyond the 1860s or 50s.
But DNA doesn’t lie. And by comparing the source populations of present day African countries to the DNA of present day Americans (and others living in the Western hemisphere), we can glean a bit more insight into at least the rough places of origin for individual’s ancestors. And so the BBC, which wrote an article about the survey, created this map to show the average amount of African ancestry in people today.
There is a lot to unpack from the study, and for those interested, you should read the full article. But what this graphic shows is that there is significant variation in the amount of African descent in African-[insert country here] ethnic groups. African-Brazilians, on average, have somewhere between 10–35% African DNA, whereas in Mexico that figures falls to 0–10%, but in parts of the United States it climbs upwards of 70–95%.
In a critique of the graphic itself, when I look at some of the data tables, I’m not sure the map’s borders are the best fit. For example, the data says “northern states” for the United States, but the map clearly shows outlines for individual states like New York, Pennsylvania, and New Jersey. In this case, a more accurate approach would be to lump those states into a single shape that doesn’t break down into the constituent polities. Otherwise, as in this case, it implies the value for that particular state falls within the range, when the data itself does not—and cannot because of the way the study was designed—support that conclusion.
Credit for the piece goes to the BBC graphics department.
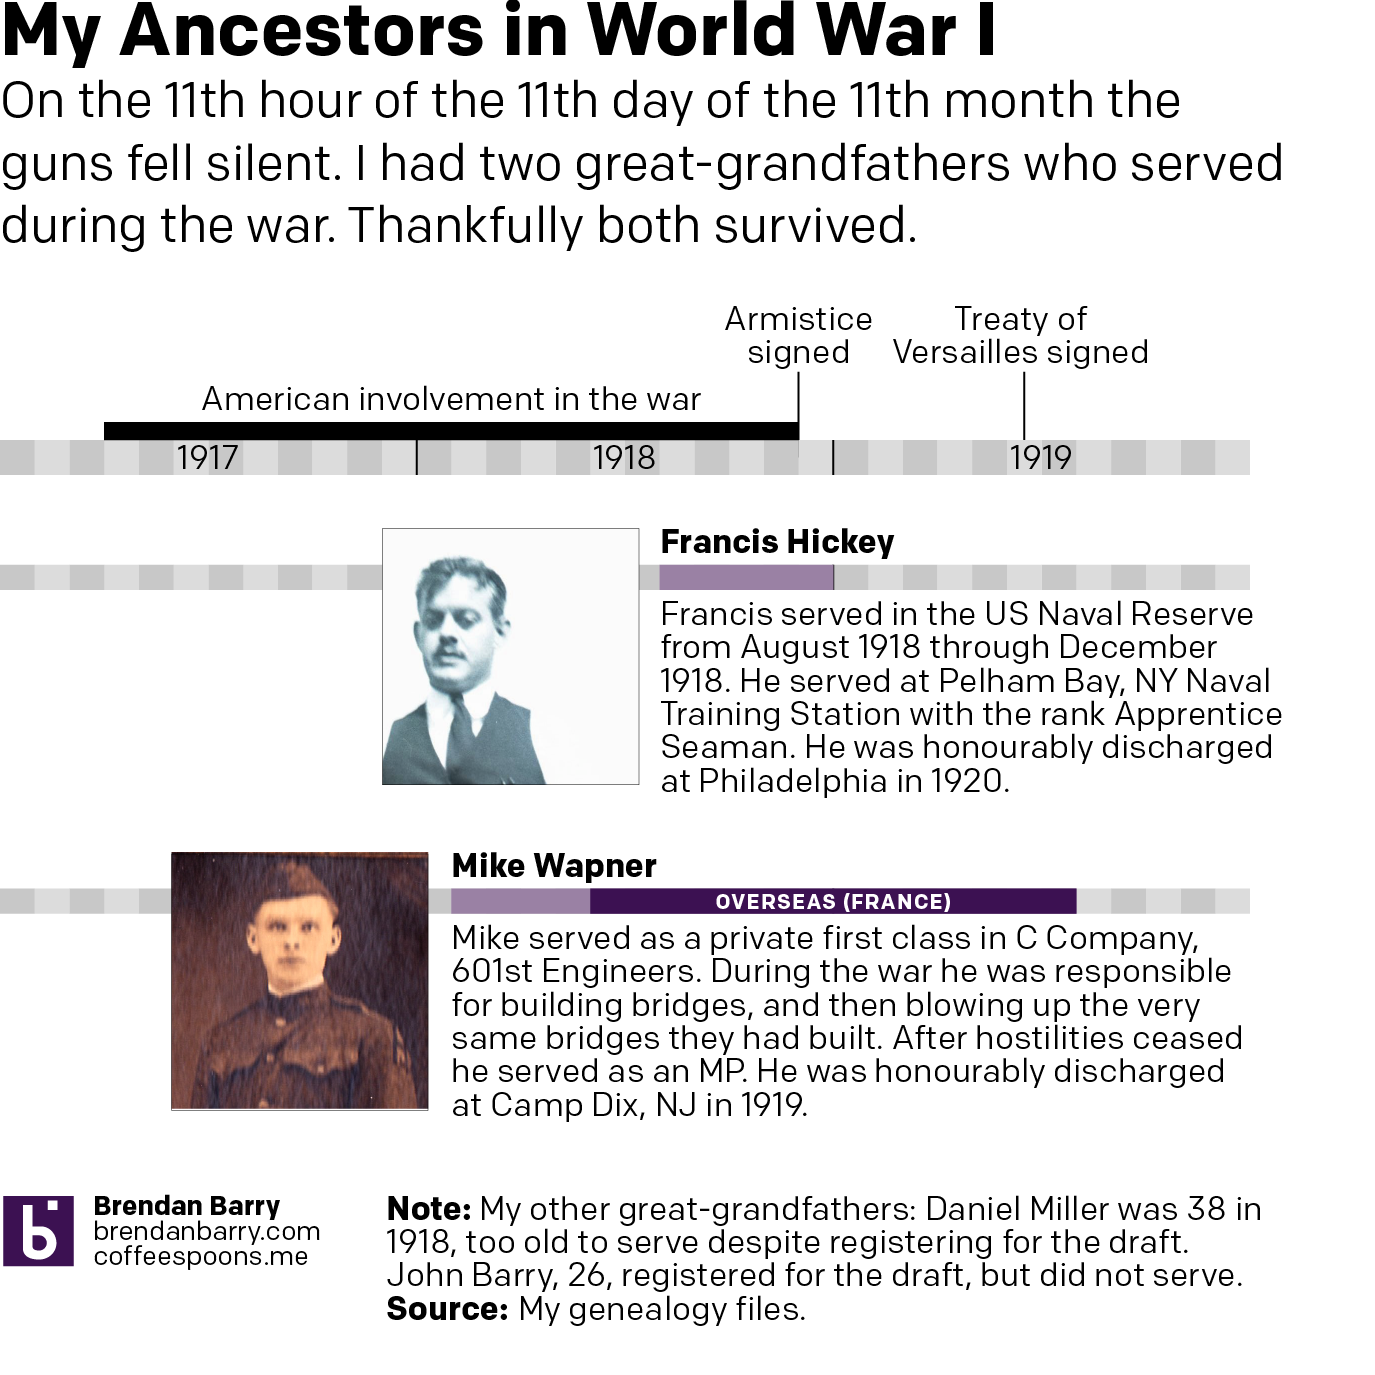
Yesterday was Armistice Day, a bank holiday hence the lack of posting. So I spent a few hours yesterday looking at my ancestors to see who participated in World War I. It turned out that on my paternal side, my one great-grandfather was too old and the other was both the right age and signed up for the draft, but was not selected.
And so the only two that served were my maternal great-grandfathers. One served a few months in the naval reserve towards the end of the war. My other great-grandfather served for a year, a good chunk of it in France. This I largely knew from my great aunt, who had told us stories about how he had told her about blowing up bridges they had just built to prevent Germans from capturing them. And then how after the war he served as military police, arresting drunk American soldiers in France. But I had never realised some of the documents I had collected told more of the skeletal structure like units and ranks. Consequently, I decided to make this graphic.
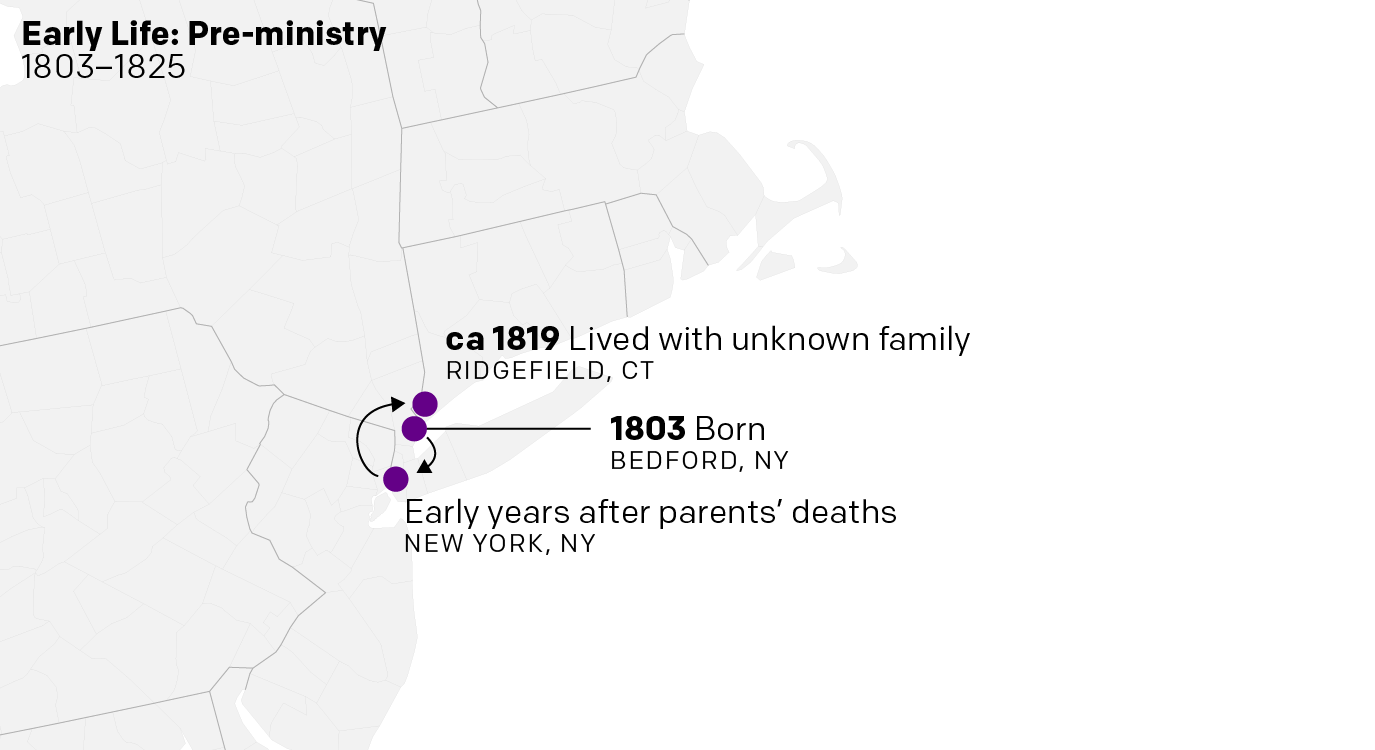
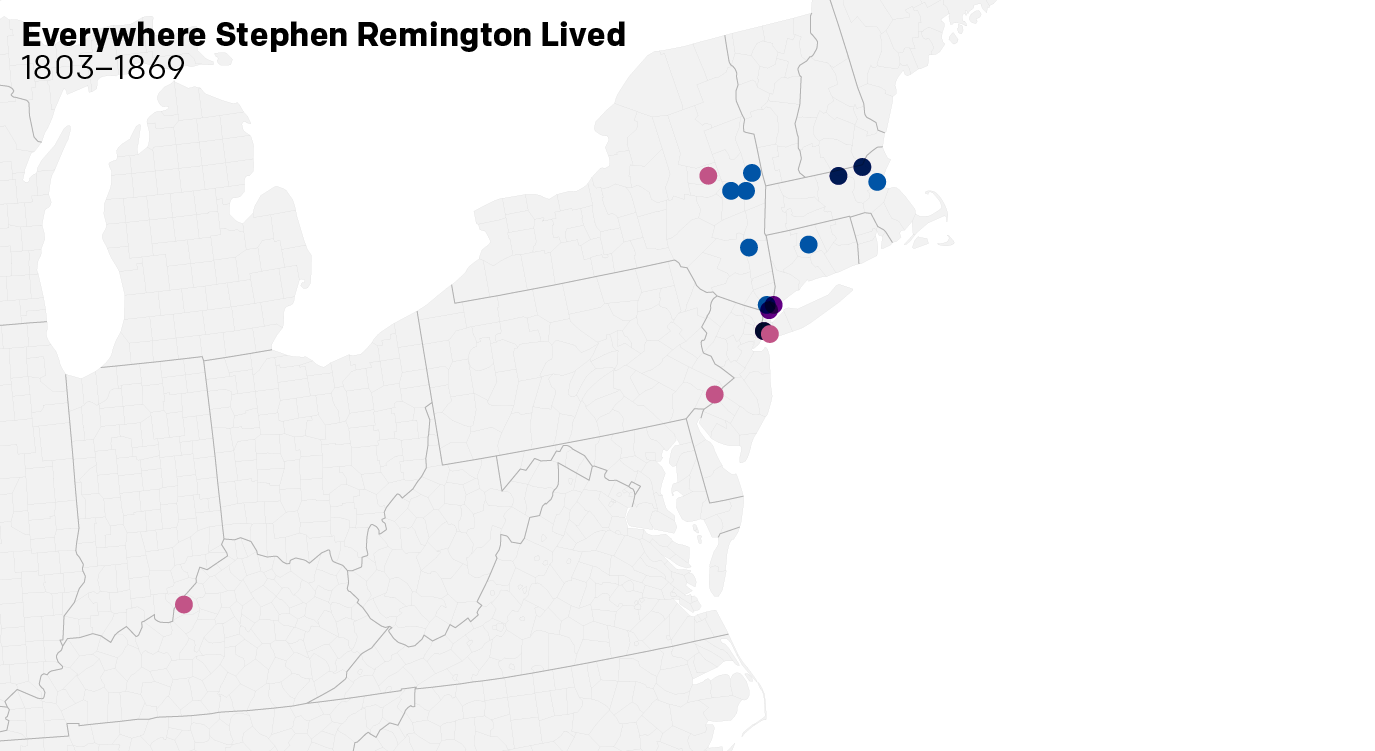
As many of you are aware, one of my personal interests is in genealogy and my family history. And sometimes, data visualisation can help make sense of my research. This past weekend, I was looking through some of my notes on my great-great-great-great-grandfather, a man named Stephen Remington.
One of the outstanding questions is who was his wife, a woman named Eliza Ann. Her surname might be either Garretson or Caustin. So I used a timeline of Stephen’s residences to see if any his residences overlapped with similar surnames. It sort of did, but not until after the year he married her. So still more work is needed.
But then I decided with a few tweaks I could actually plot out where he lived, because he lived all over. His earliest years are a bit of a mystery, because his parents are both unknown and they both died during Stephen’s youth.
Ridgefield was home to a small cluster of Remingtons. Were they related?
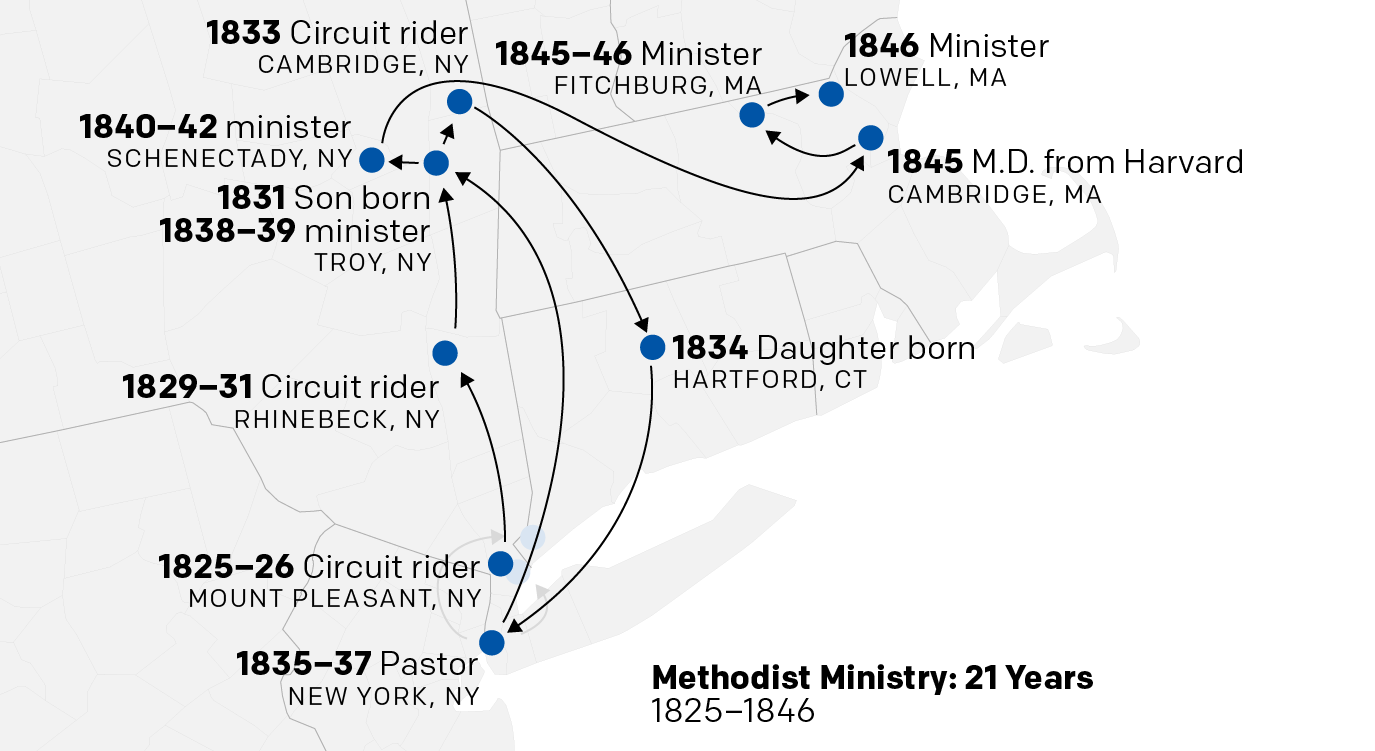
In his earlier years he was what was called a circuit rider. Before there were large, dense settlements of people, the rural and frontier people relied upon essentially travelling ministers. The ministers had a responsibility for a small (sometimes large) area. And early in Stephen’s life his circuit riding kept pushing him north up the Hudson River with occasional postings back to New York City.
Rhinebeck is the town demanding my closer attention for Eliza’s sake.
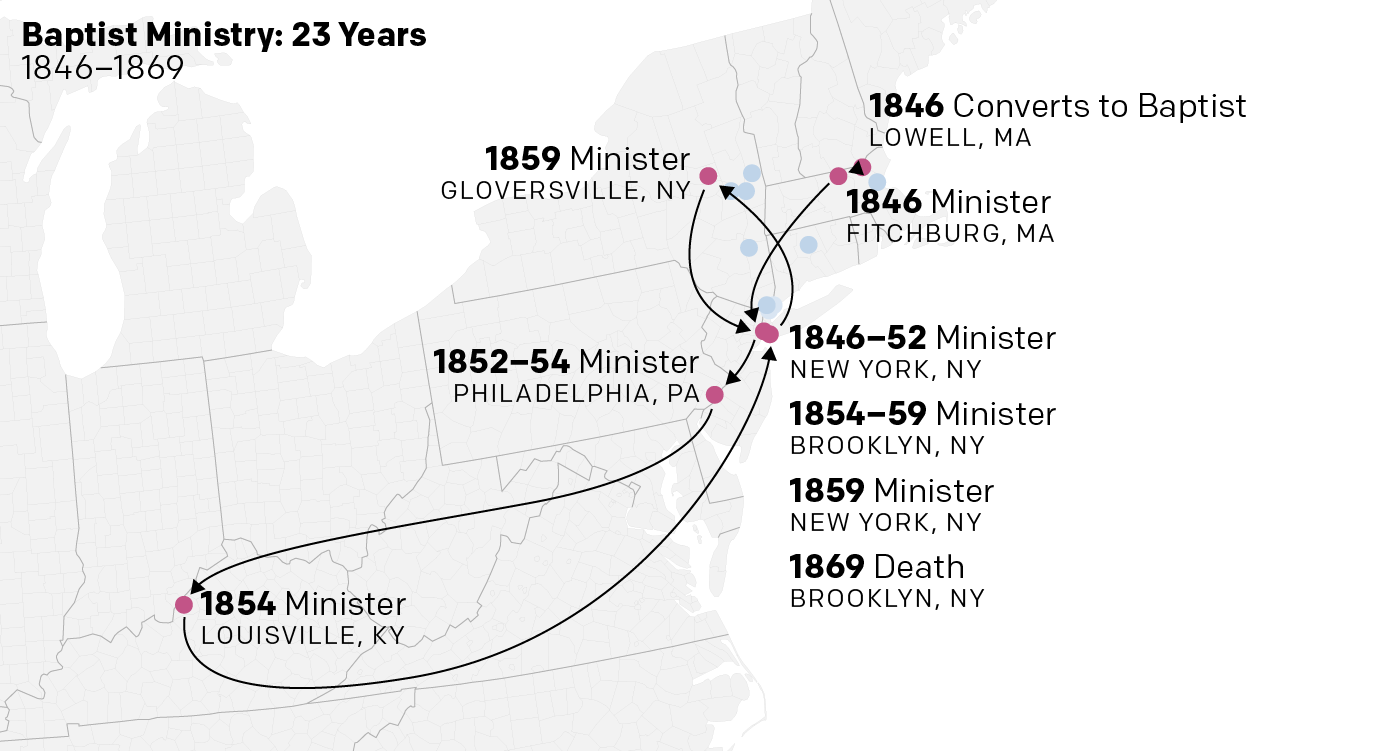
Eventually, however, he ended up preaching in Massachusetts, where he separately earned his medical doctorate from Harvard University. He practiced medicine on the side for years. Then in 1846 he converted from the Methodist church to the Baptist church. He wrote about it in a notable book/pamphlet: Reasons for Becoming a Baptist.
From then he became an itinerant pastor, never staying at a single congregation for more than five years or so. He travelled from New York to Philadelphia to Louisville for several months then back to New York.
Evidently his time in Louisville was short, possibly because of anti-slavery views.
He preached as a Baptist for twenty-plus more years before finally settling in Brooklyn, where he died at the age of 66. He lived all over the mid-Atlantic, especially the Hudson River Valley. And while he returned to places over the years, notably New York City, he appears to have never stayed in one place longer than maybe five years.
That was a lot of places for Stephen to hang his hat.
As for Eliza, she died in 1850. But I wonder if she may be related to a cluster of Garretsons that lived in Rhinebeck, which included the famous Reverend Freeborn Garretson, a circuit riding Methodist minister.
The daughter born in Hartford is my direct ancestor. She eventually married a man in New York City with the surname Miller. Then, after having a son (my next direct ancestor), she upped and moved to Wisconsin and married another man with the surname Miller, who was not related to the first. There is talk of a divorce, but no record of it. Could she have been a bigamist? That’s a story for another day.
Moving away from climate change now, we turn to the lovely land of Afghanistan. While the Trump administration continues to negotiate with the Taliban in hopes of ending the war, the war continues to go worse for Afghanistan, its government, and its allies, including the United States.
It is true that US and NATO ally deaths are down since the withdraw of combat troops in 2014. But, violence and sheer deaths are significantly up. And as this article from the Economist points out, the deaths in Afghanistan are now worse than they are in Syria.
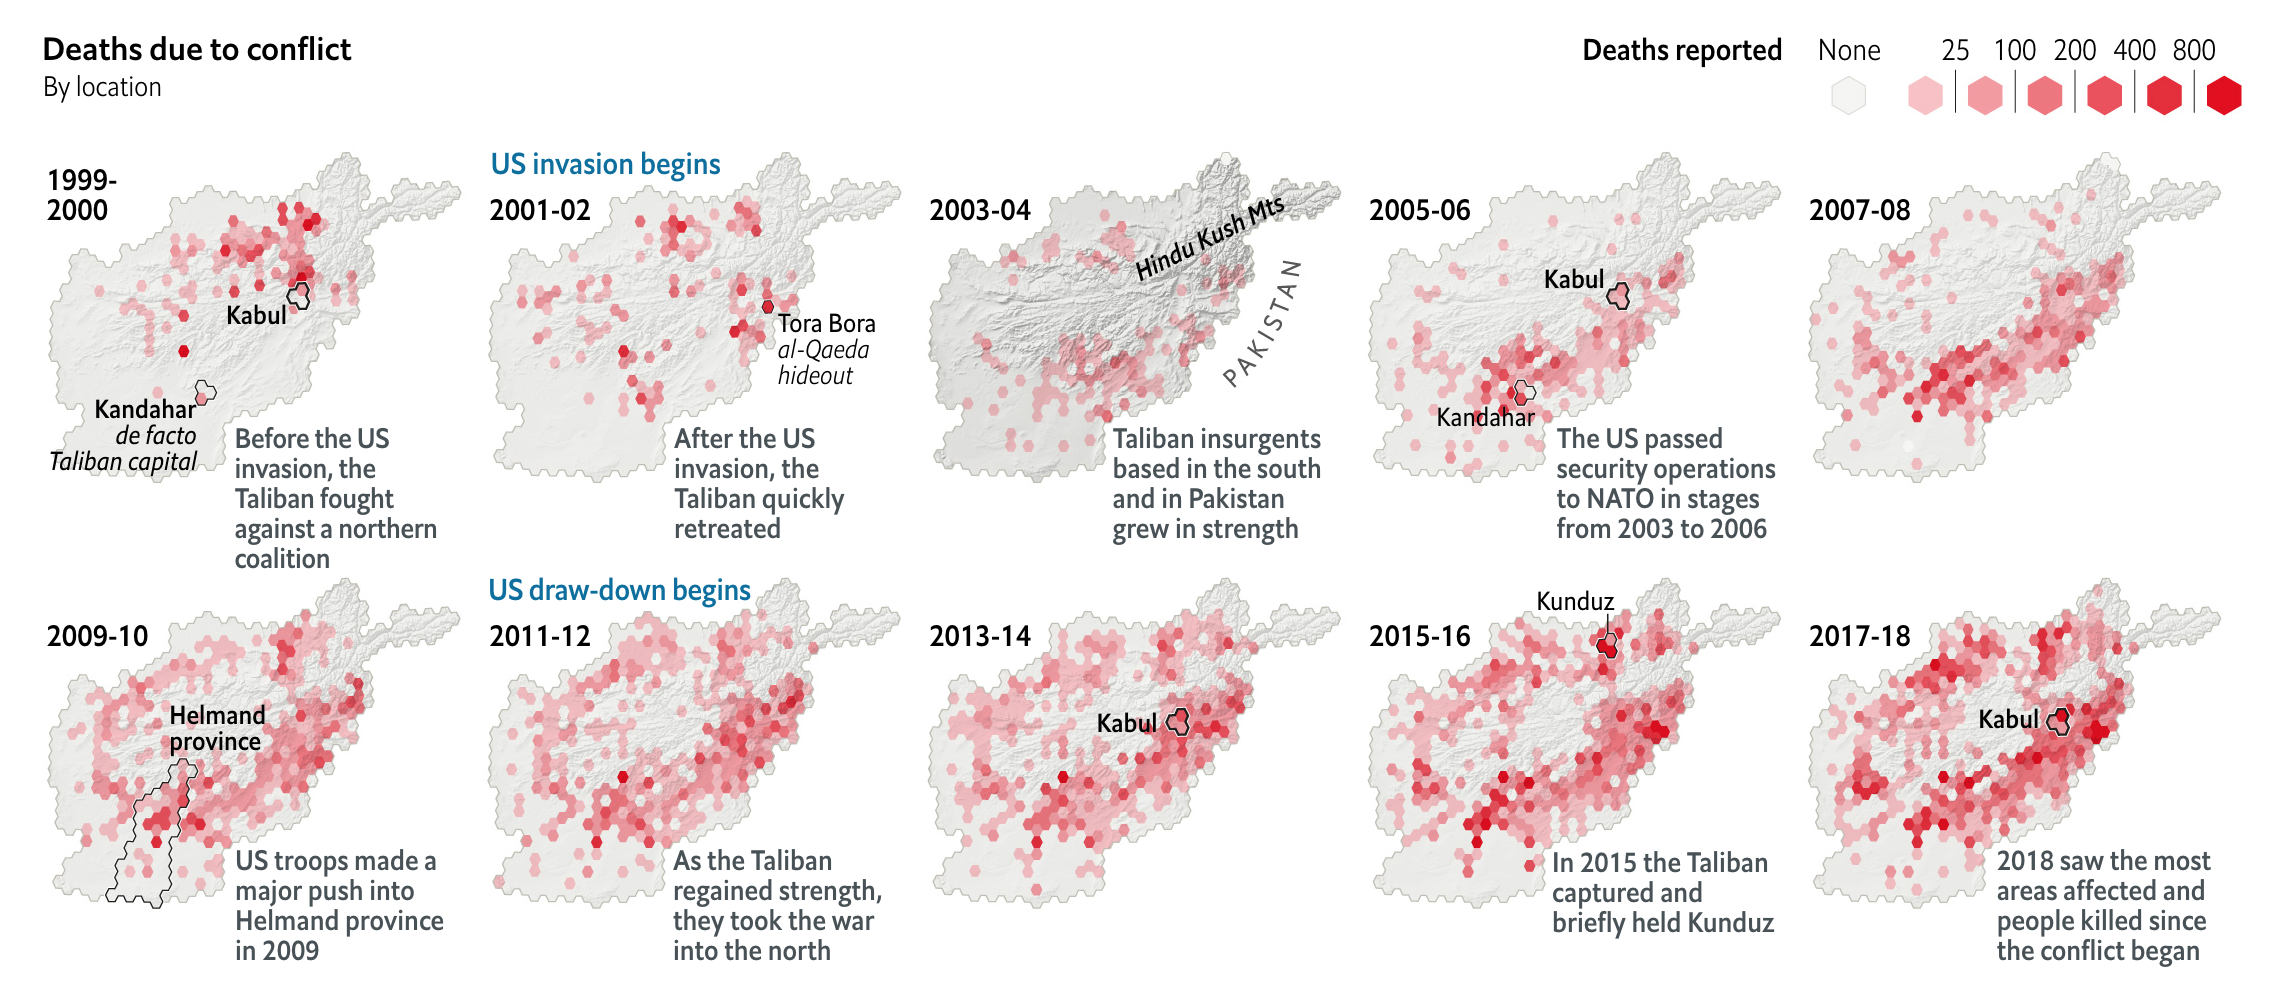
The beginning of the article uses a timeline to chart the history of Afghan conflicts as well as the GDP and number of deaths. And it is a fascinating chart in its own right. But I wanted to share this, a small multiples featuring graphic looking at the geographic spread of deaths throughout the country.
Getting hotter (because red obviously means heat)
It does a nice job by chunking Afghanistan into discrete areas shaped as hexagons and bins deaths into those areas. All the while, the shape remains roughly that of Afghanistan with the Hindu Kush mountain range in particular overlaid. (Though, I am not sure why it is made darker in the 2003–04 map.)
To highlight particular cities or areas, hexagons are outlined to draw attention to the population centres of interest. But overall, the rise in violence and deaths is clear and unmistakable. And it has spread from what was once pockets in the south to the whole of the country that isn’t mountains or deserts.
Tamerlane would be proud.
Credit for the piece goes to the Economist graphics department.
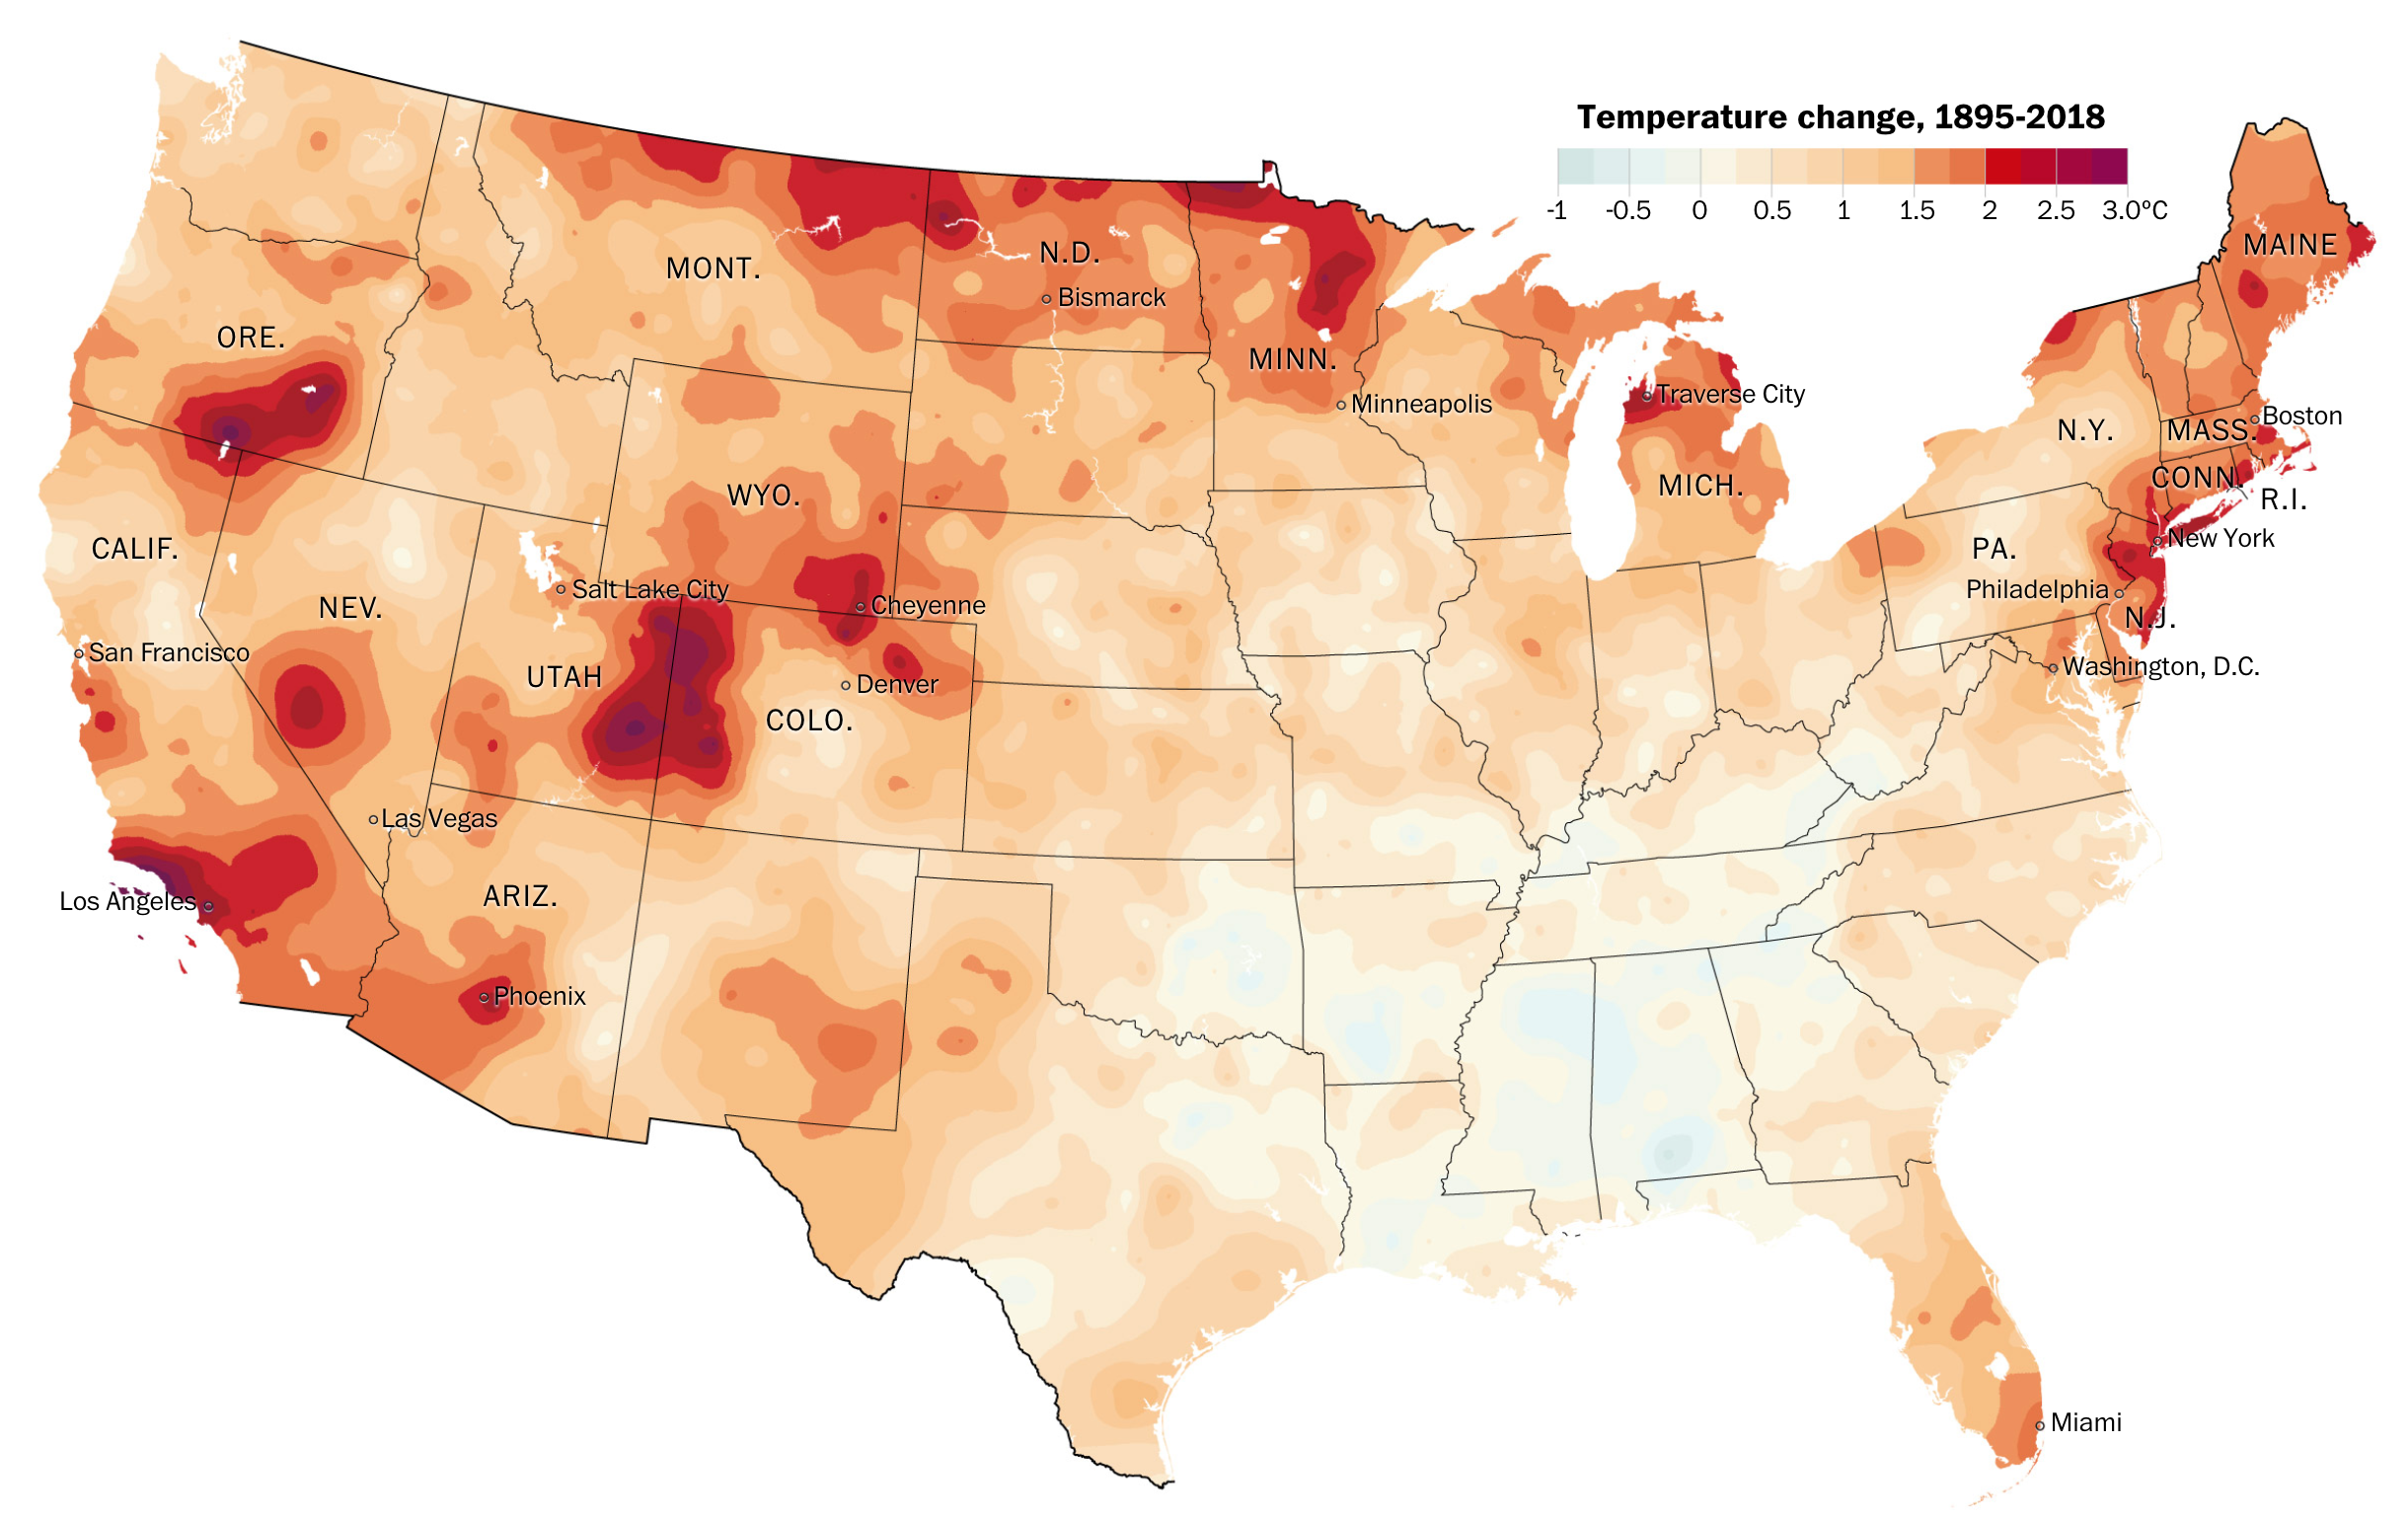
Last week we looked at a few posts that showed the future impact of climate change at both a global and US-level scale. In the midst of last week and those articles, the Washington Post looked backwards at the past century or so to identify how quickly the US has changed. Spoiler: some places are already significantly warmer than they have been. Spoiler two: the Northeast is one such place.
The piece is a larger and more narrative article using examples and anecdotes to make its point. But it does contain several key graphics. The first is a big map that shows how temperature has changed since 1895.
The Southeast is an anomaly, but its warming has accelerated since the 1960s
The map does what it has to and is nothing particularly fancy or groundbreaking—see what I did there?—in design. But it is clear and communicates effectively the dramatic shifts in particular regions.
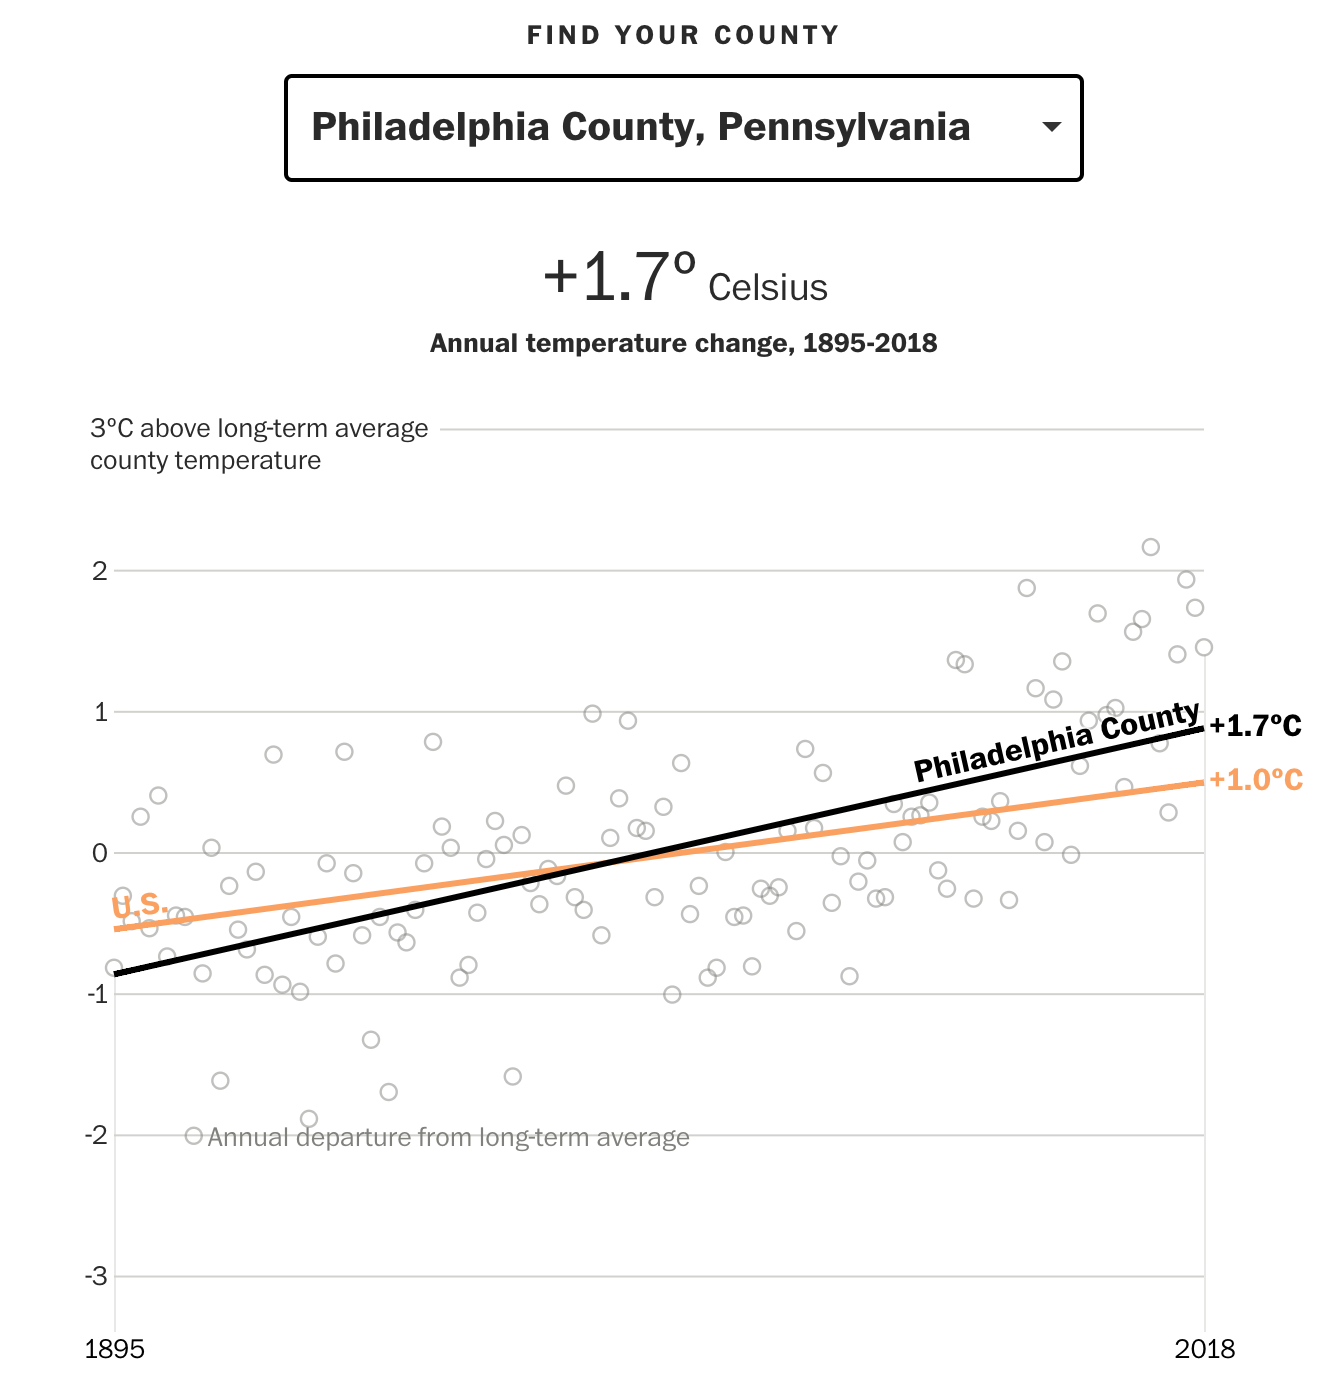
The more interesting part, along with what we looked at last week, is the ability to choose a particular county and see how it has trended since 1895 and compare that to the baseline, US-level average. Naturally, some counties have been warming faster, others slower. Philadelphia County, the entirety of the city, has warmed more than the US average, but thankfully less than the Northeast average as the article points out.
This ain’t so good
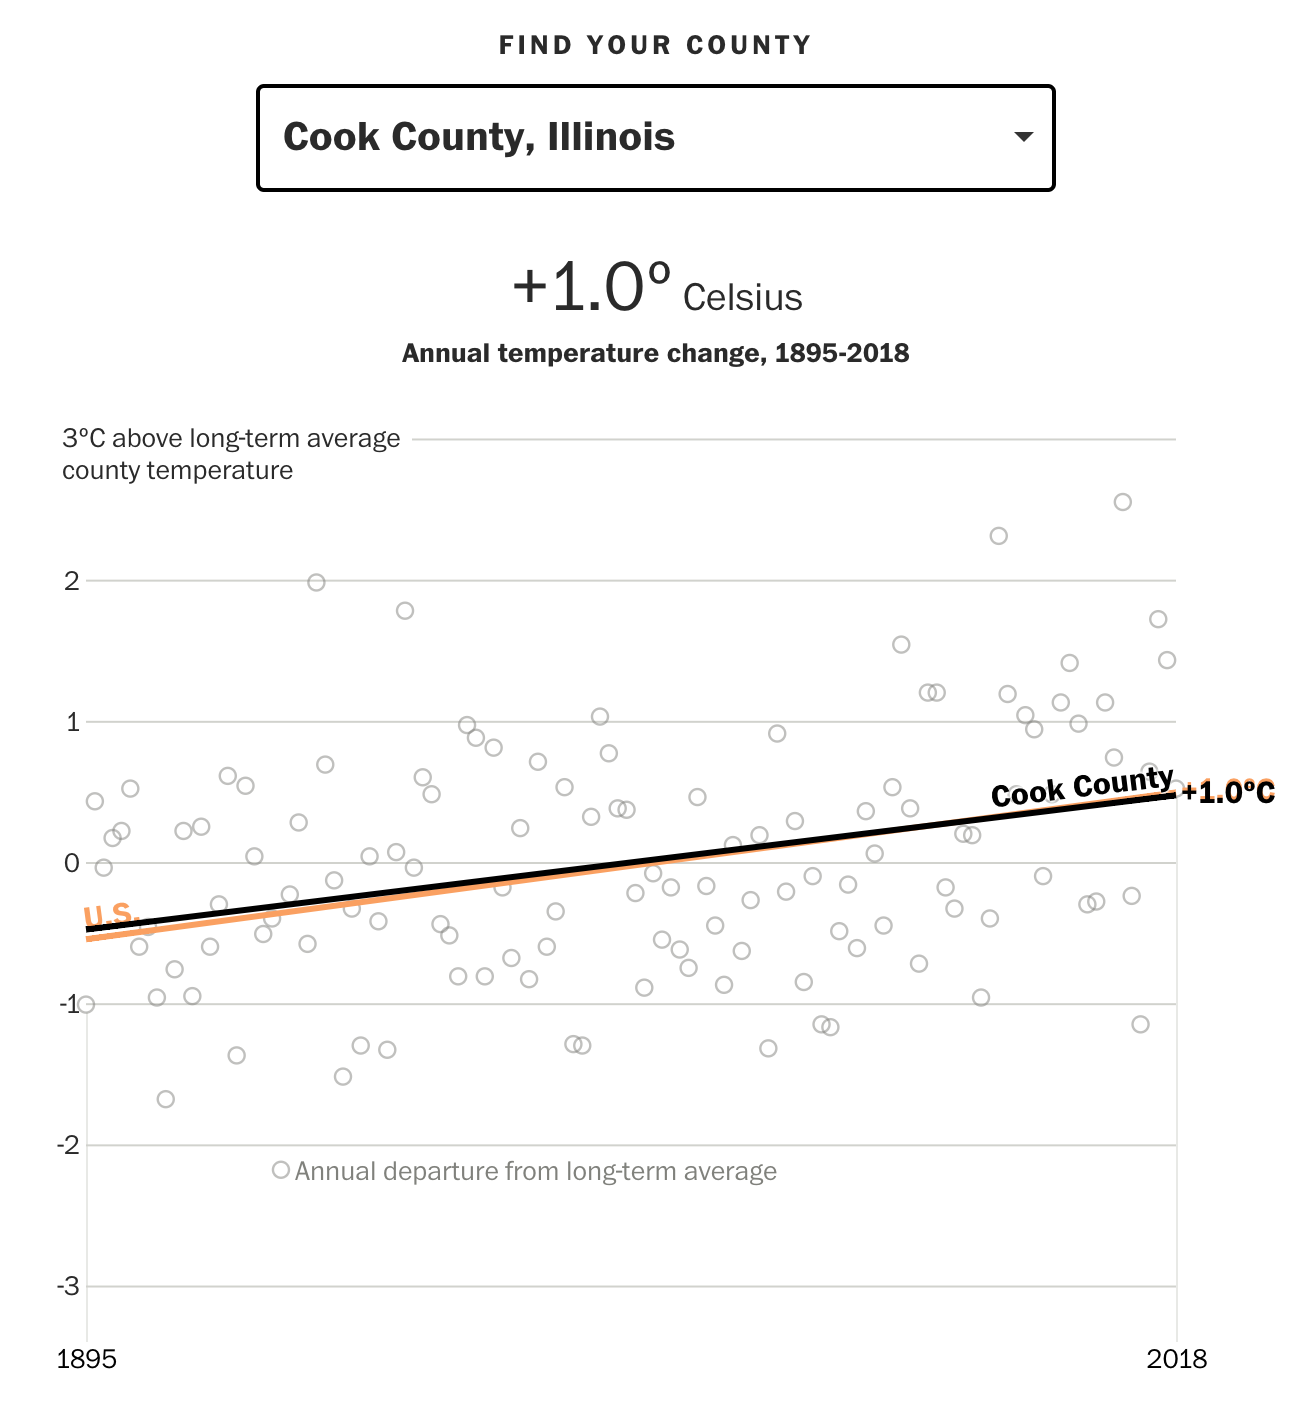
But, not to leave out Chicago as I did last week, Cook County, Illinois is right on line with the US average.
Nor is this, but it’s average
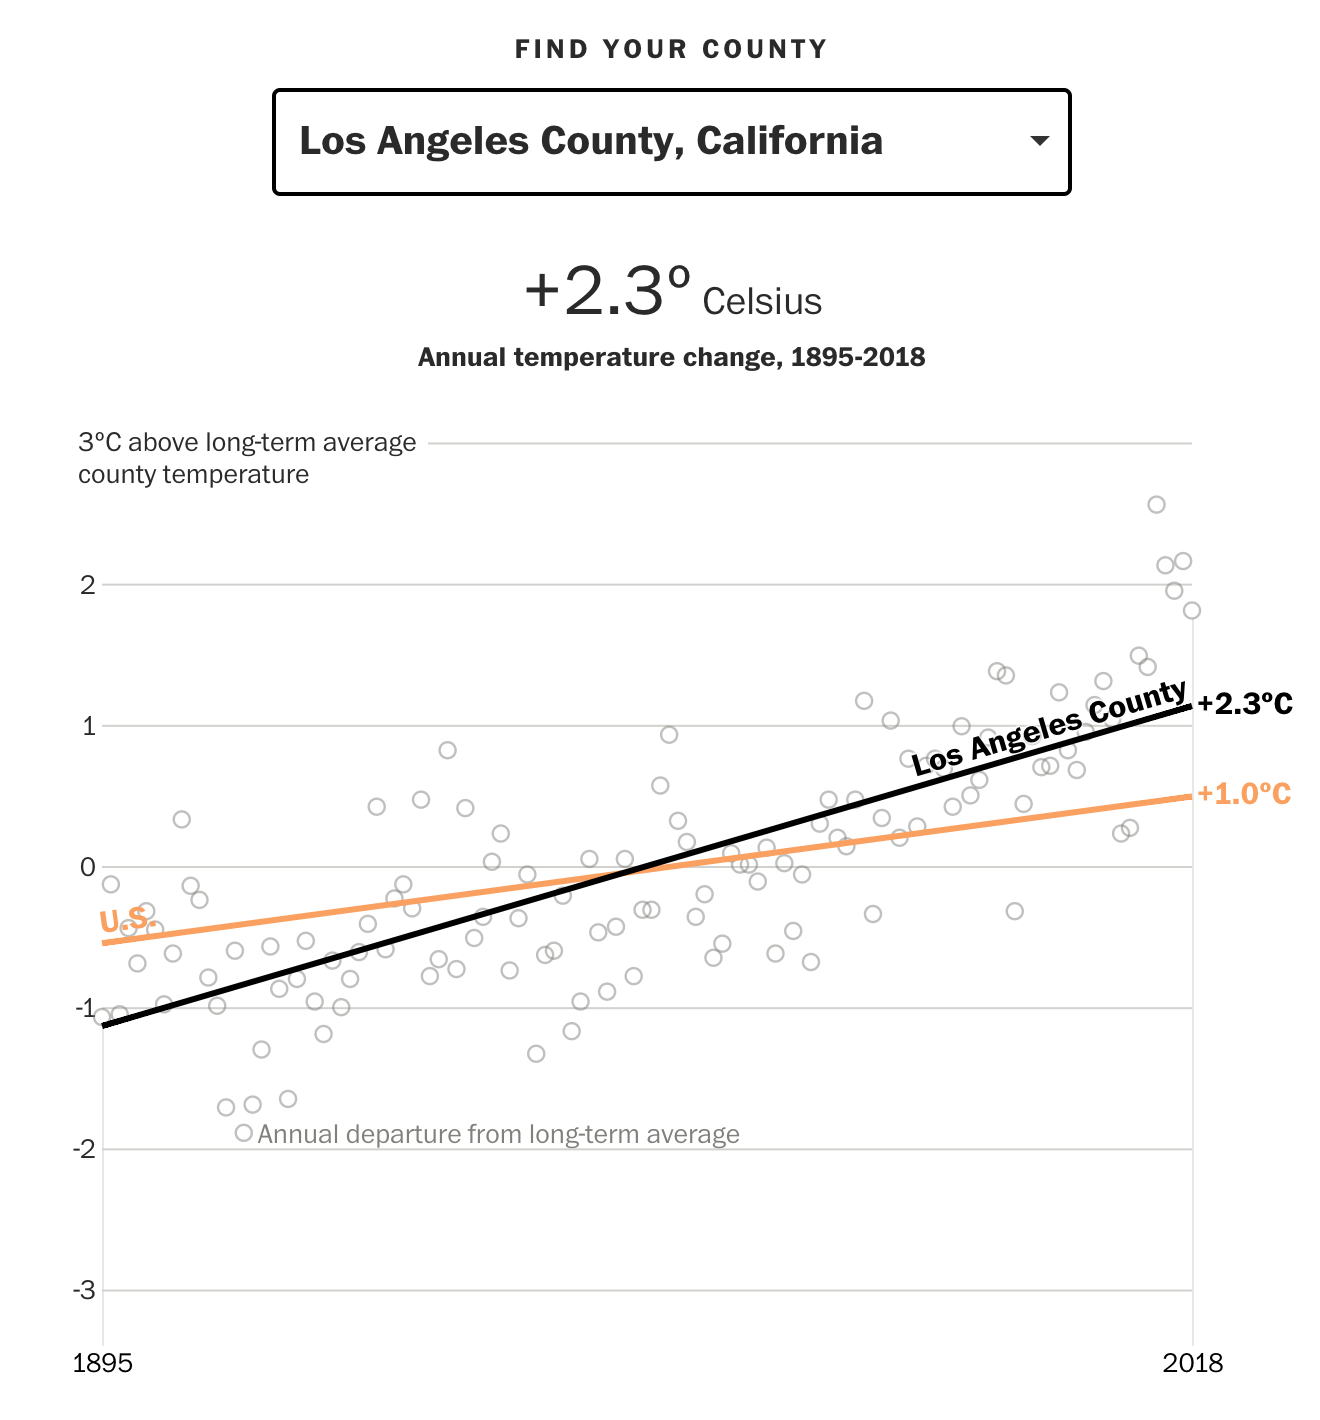
But the big cities on the West Coast look very unattractive.
Tinseltown is out of the question
The interactive piece does a nice job clearly focusing the user’s attention on the long run average through the coloured lines instead of focusing attention on the yearly deviations, which can vary significantly from year to year.
And for those Americans who are not familiar with Celsius, one degree Celsius equals approximately 1.8º Fahrenheit.
Overall this is a solid piece that continues to show just what future generations are going to have to fix.
Credit for the piece goes to Steven Mufson, Chris Mooney, Juliet Eilperin, John Muyskens, and Salwan Georges.
Yesterday in a post about Angela’s forced journey from Africa to Jamestown I mentioned that the Pilgrims arrived at Plymouth Bay just one year later in 1620. From 1620 until 1640 approximately 20,000 people left England and other centres like Leiden in the Netherlands for New England. Unlike places like Jamestown that were founded primarily for economic reasons, New England was settled for religious reasons. Consequently, whereas colonies in Virginia drew young men looking to make it rich—along with slaves to help them—New England saw entire families moving and transplanting parts of towns and England into Massachusetts, Rhode Island, Connecticut, and New Hampshire.
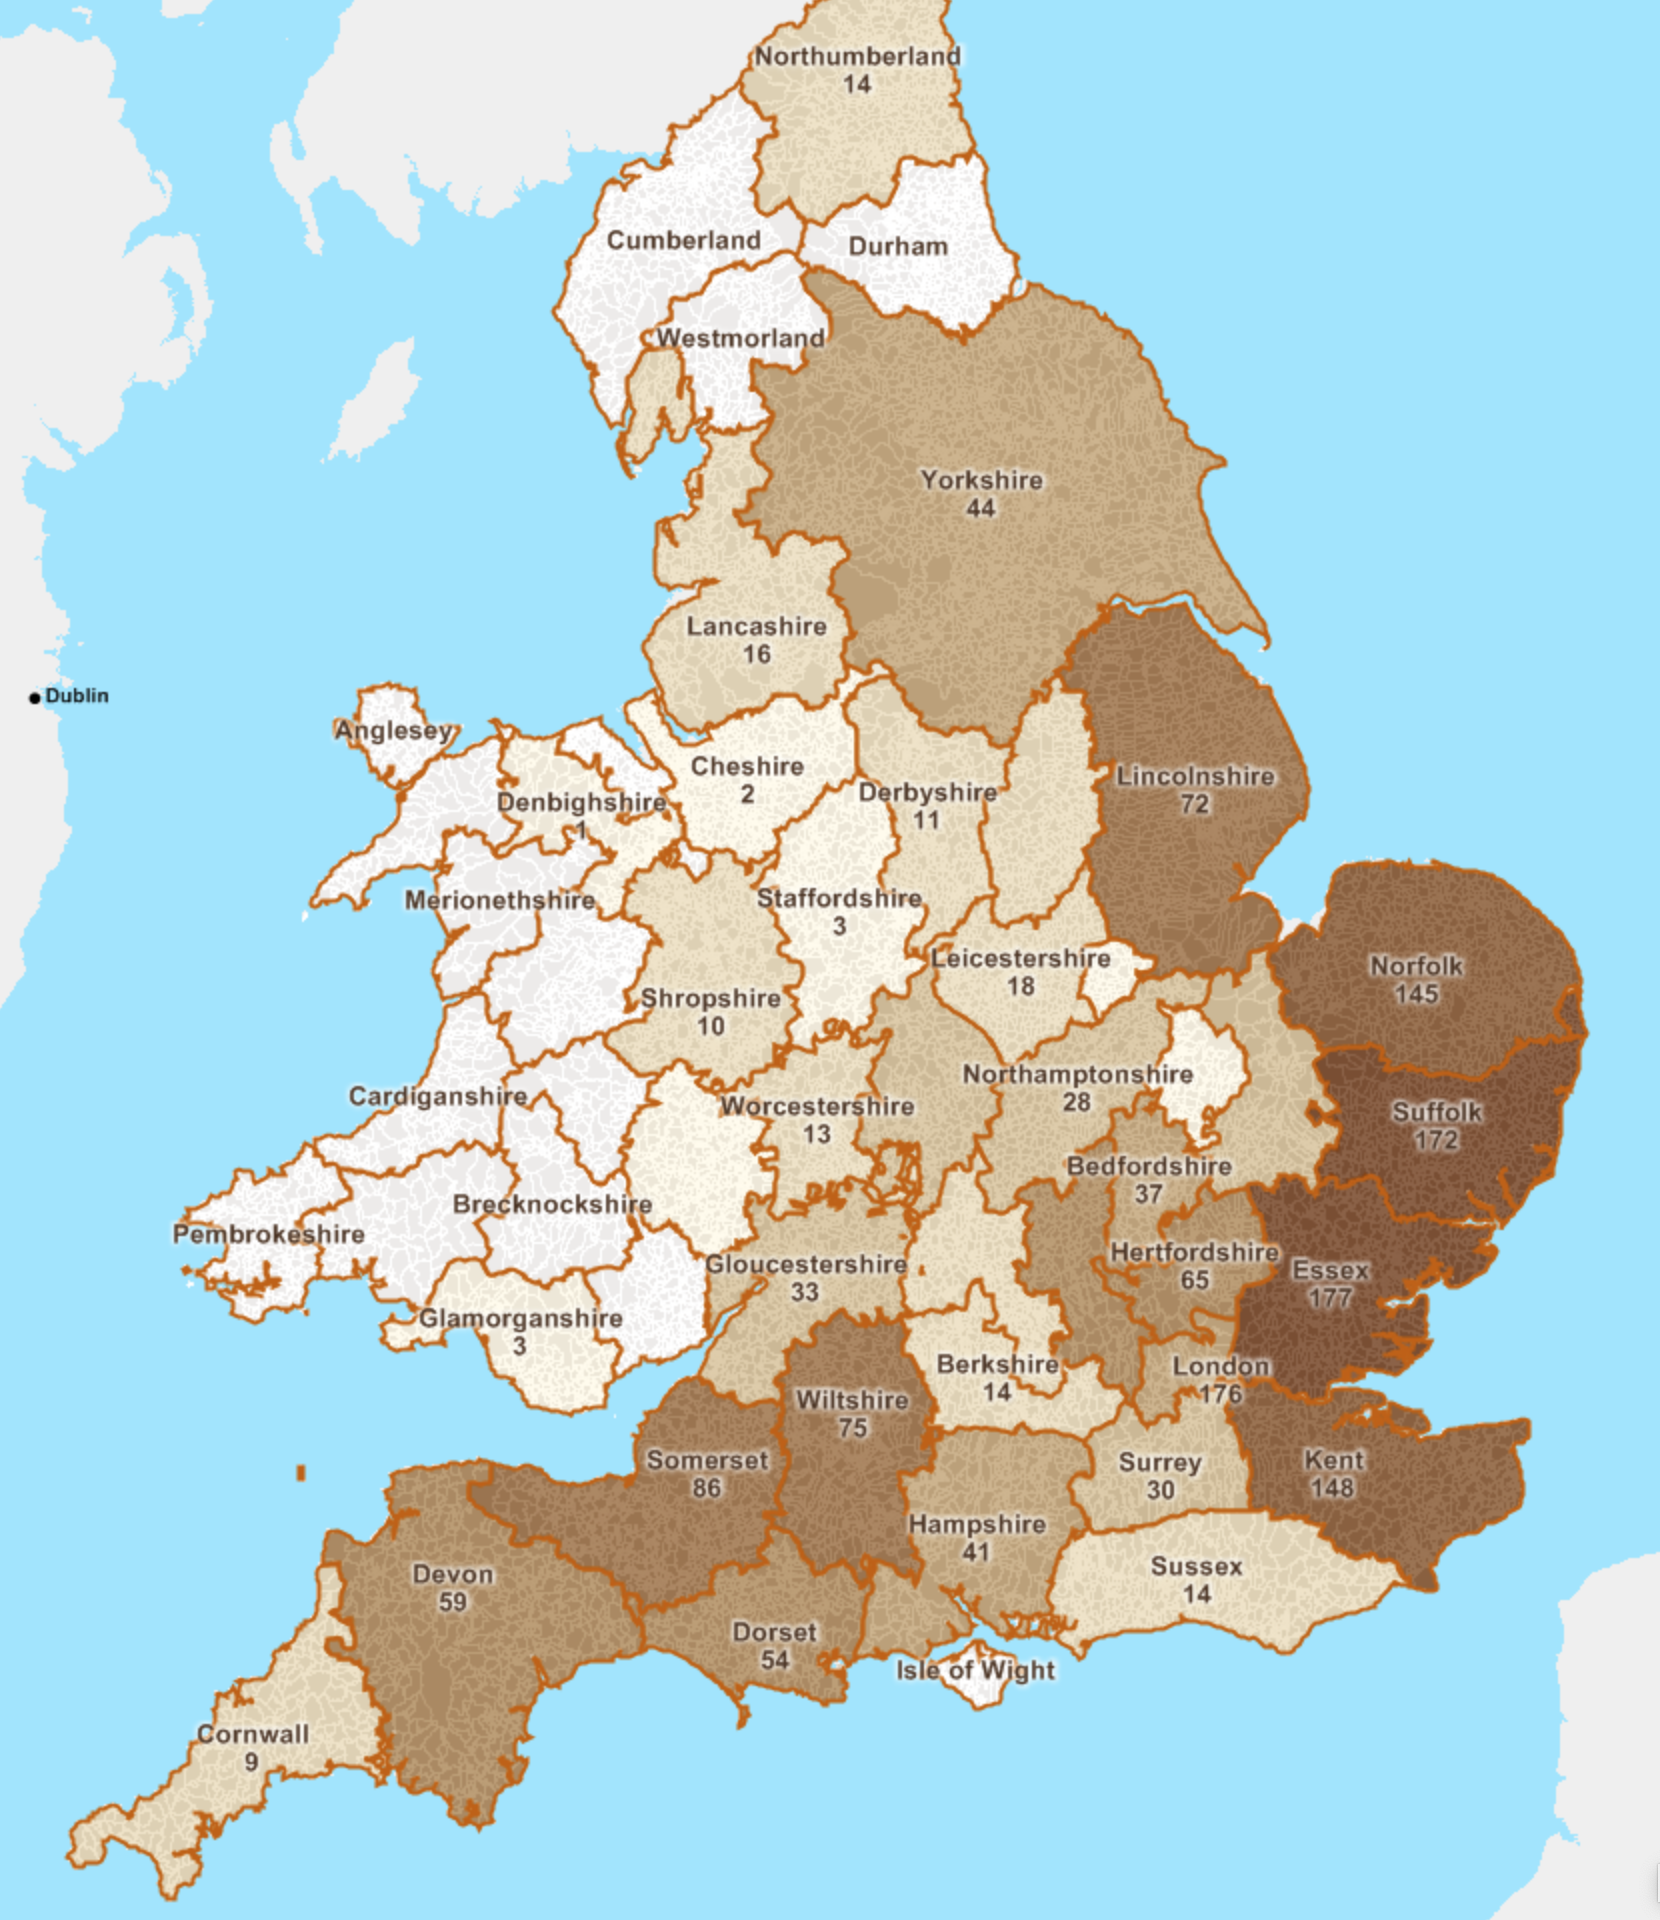
New England kept fantastic records and we know thousands of people. But we do not know whence everyone arrived, but we do know a few thousand. And this mapping project from American Ancestors attempts to capture that information at the English parish level. At its broadest level it is a county-level choropleth that shows, for those for whom we have the information, the majority of the migration, called the Great Migration, came from eastern England, with a few from the southwest.
Quite a few from Norfolk, Suffolk, and Essex
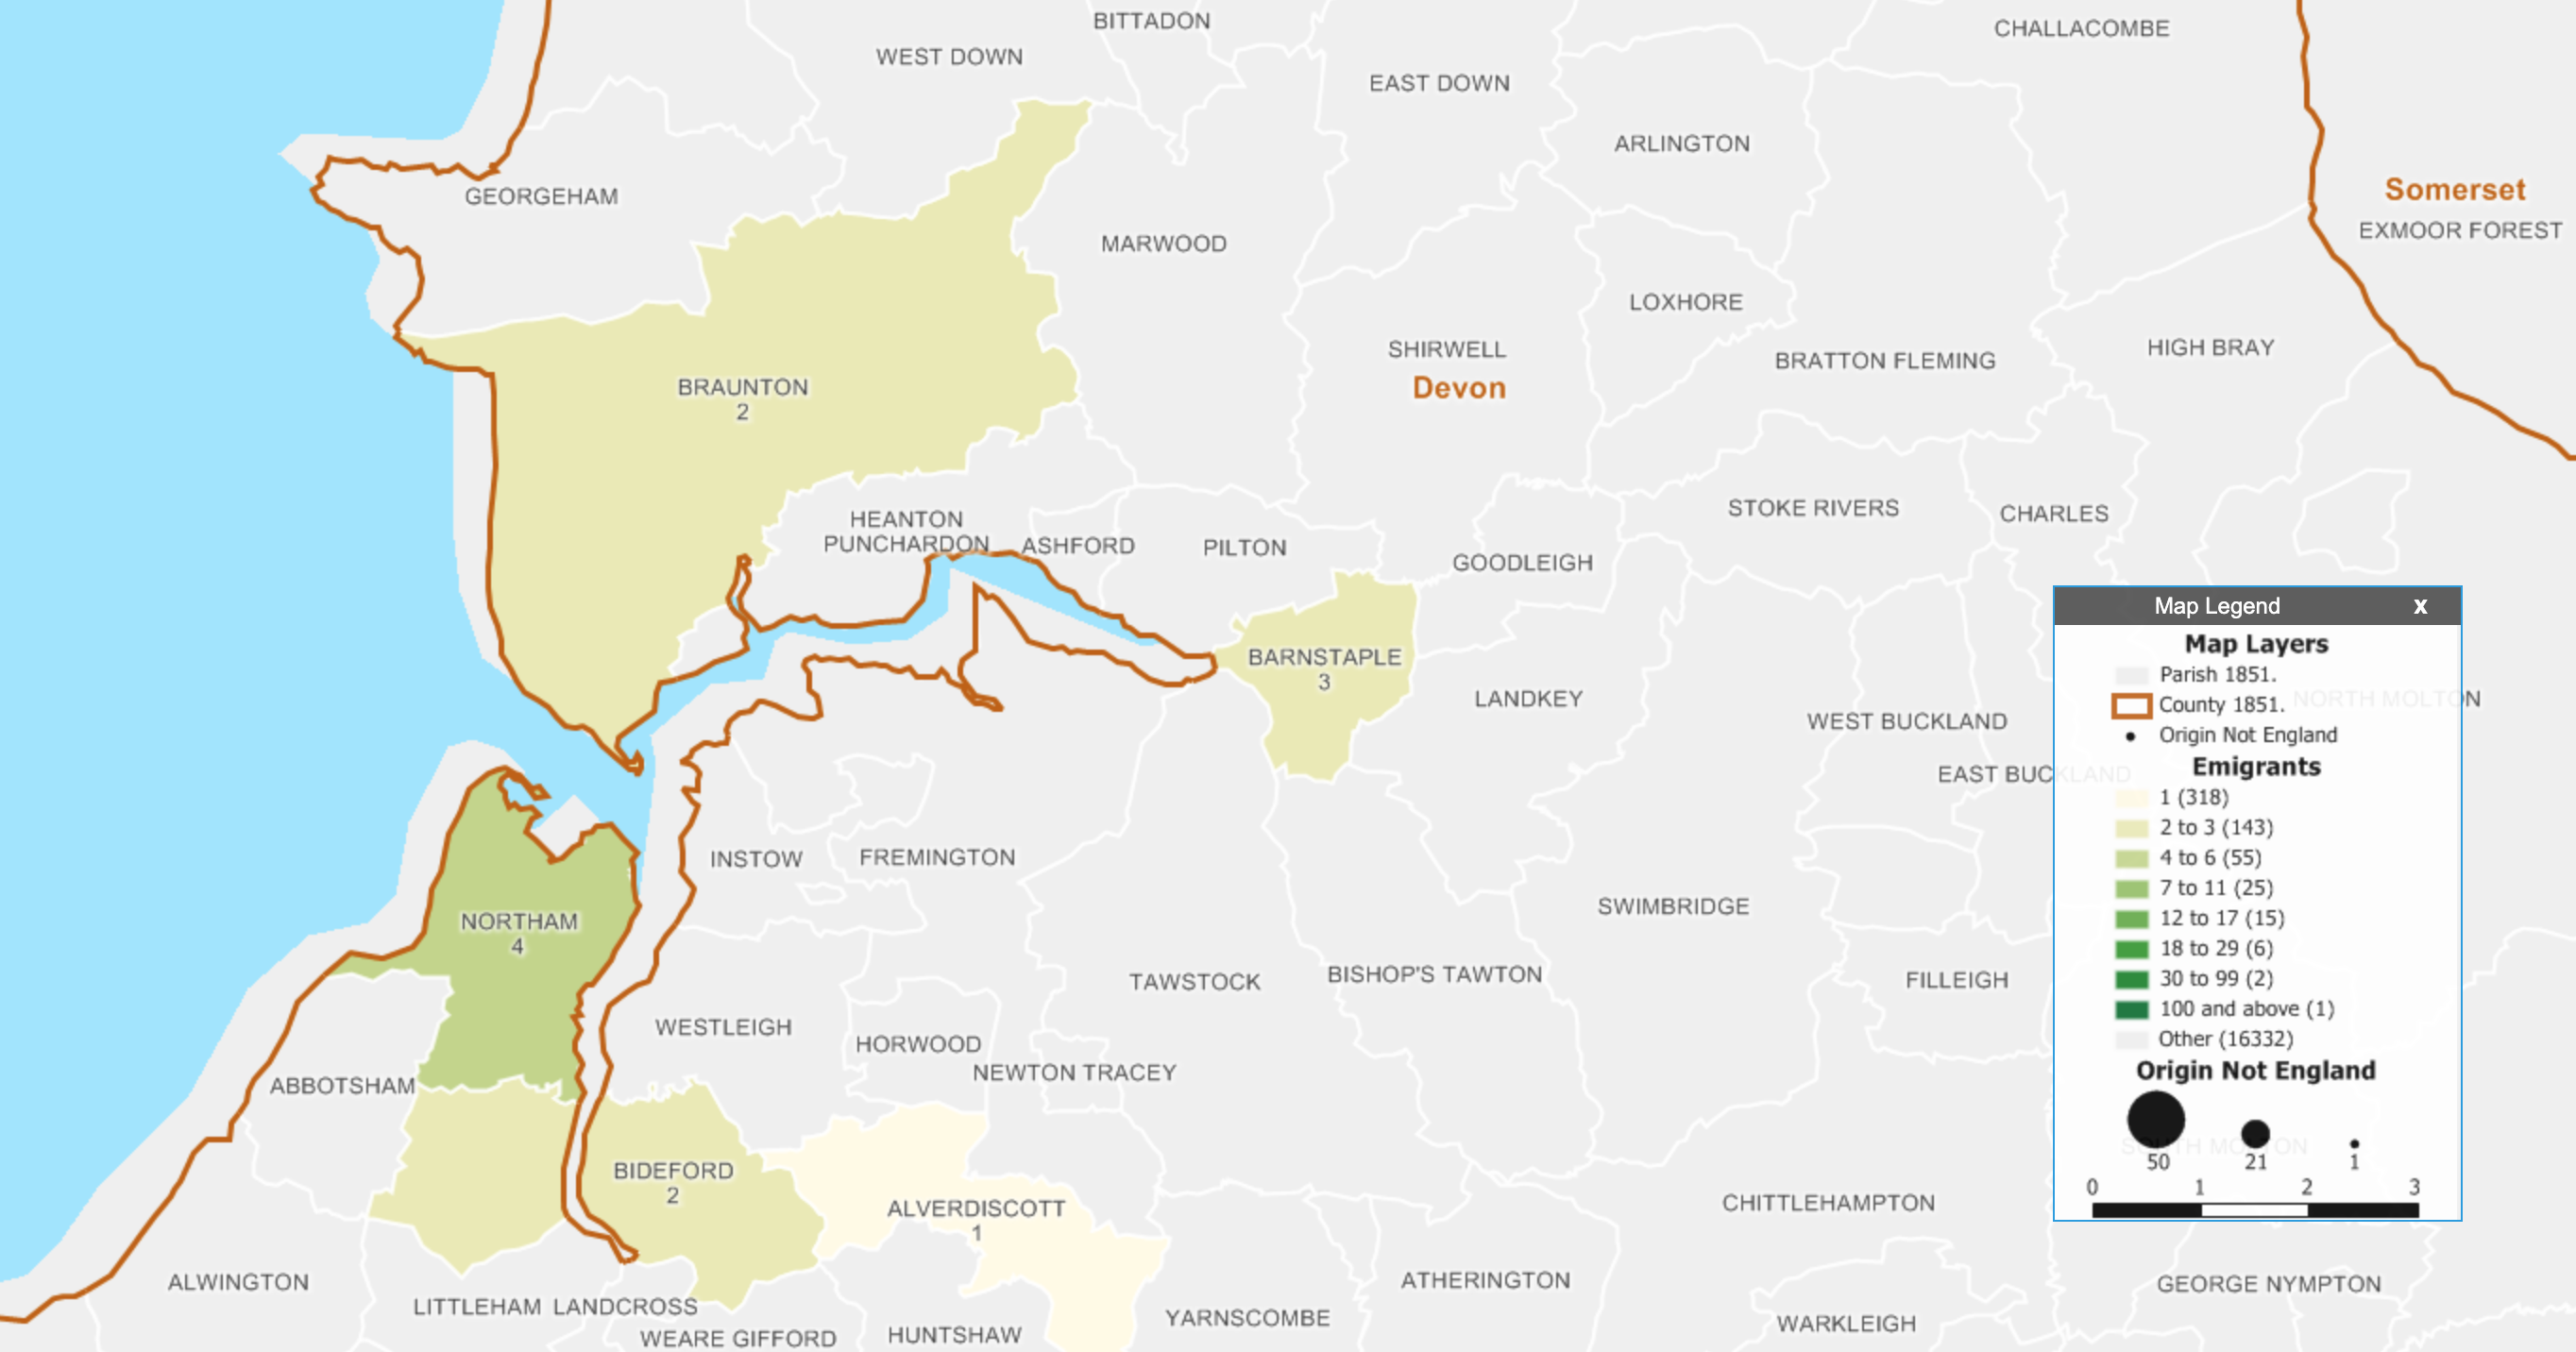
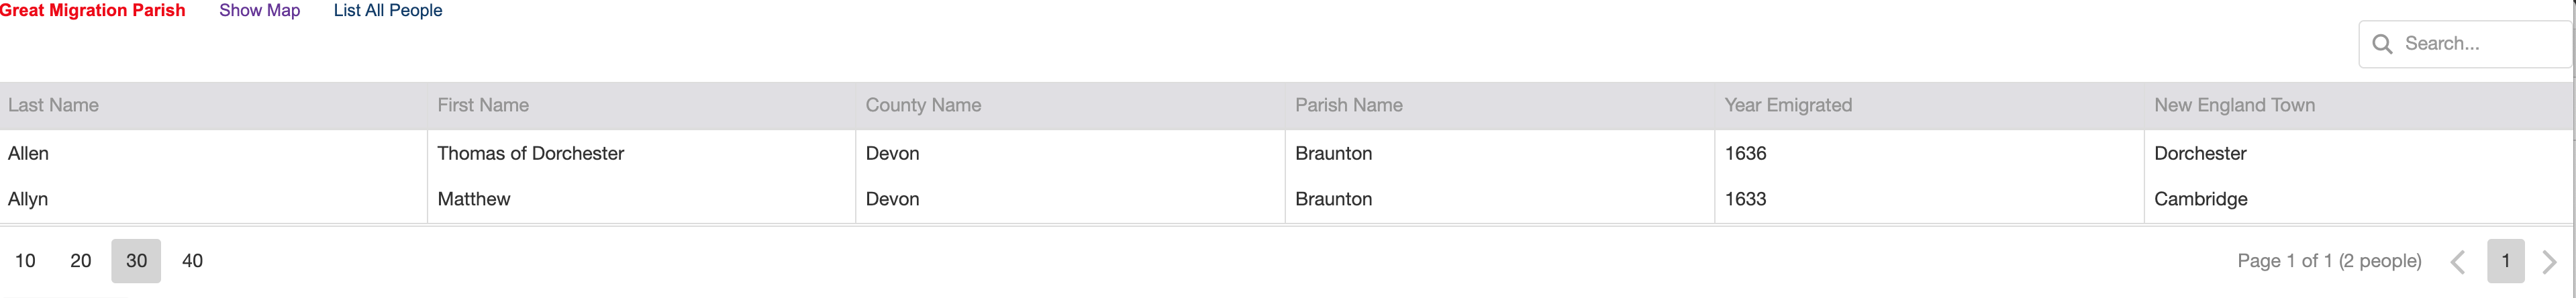
You can also search for specific people, in which case it brings into focus the county and the parishes within that have more detail. In this case I searched for my ancestor Matthew Allyn, who was one of the founders of Hartford, Connecticut. He came from Braunton in Devon and consequently appears as one of the two people connected to that parish.
Devon did not have nearly as many people emigrate as the eastern counties
But was Thomas related to Matthew? We don’t know.
Overall, it’s a nice way of combining data visualisation and my interest/hobby of genealogy. The map uses the historical boundaries of parishes prior to 1851, which is important given how boundaries are likely to change over the centuries.
This will be a nice tool for those interested in genealogy and that have ancestors that can be traced back to England. I might be biased, but I really like it.
Credit for the piece goes to Robert Charles Anderson, Giovanni Flammia, Peter H. Van Demark.
Today we move from royalty to slavery. Earlier this week the Washington Post published an article about an African woman (girl?) named Angela. She was forcibly removed from West Africa to Luanda in present-day Angola. From there she was crammed into a slave ship and sent towards Spanish colonies in the Caribbean. Before she arrived, however, her ship was intercepted by English pirates that took her and several others as their spoils to sell to English colonists.
The article is a fascinating read and for our purposes it makes use of two graphics. The one is a bar chart plotting the Atlantic slave trade. It makes use of annotations to provide a rich context for the peaks and valleys—importantly it includes not just the British colonies, but Spanish and Portuguese as well.
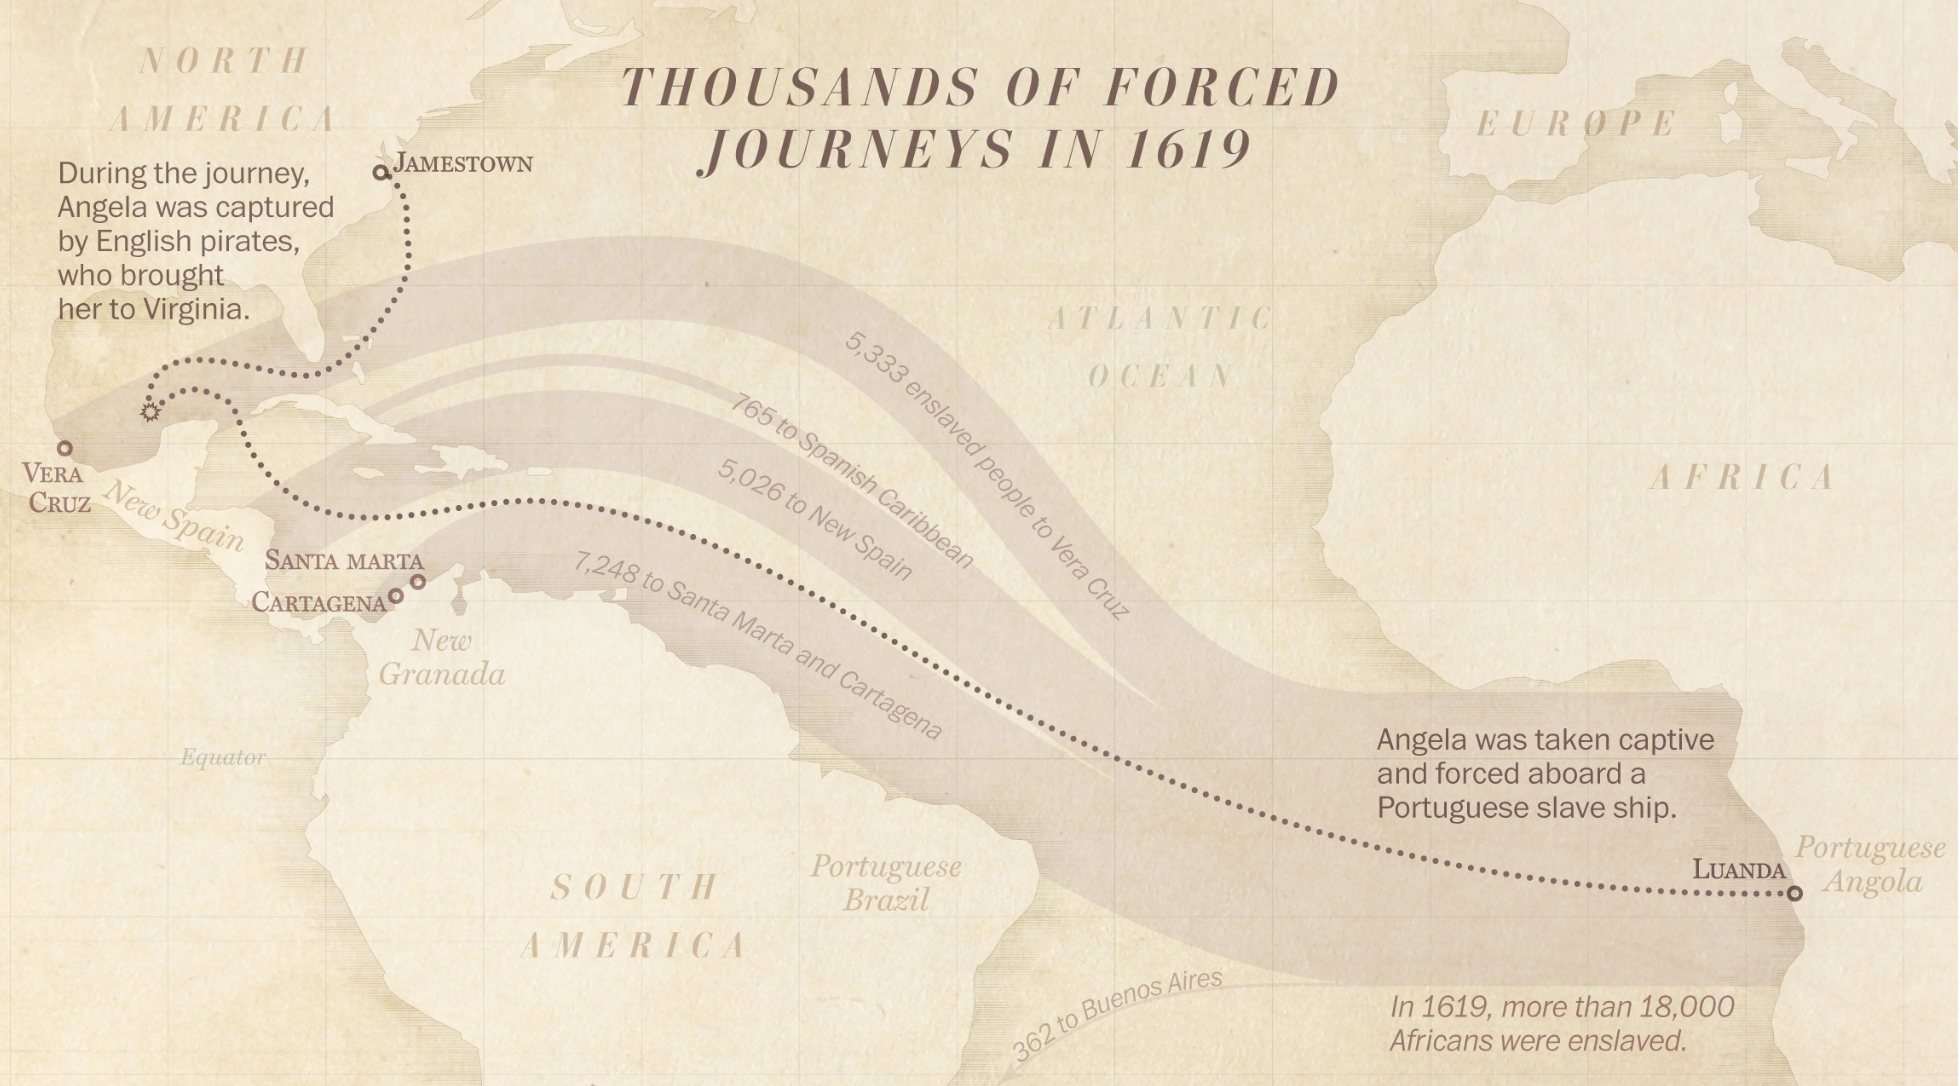
My favourite, however, is the Sankey diagram that shows the trade in 1619 specifically, i.e. the year Angela was transported across the Atlantic.
Too many people took similar routes to the New World.
It takes the total number of people leaving Luanda and then breaks those flows into different paths based on their geographic destinations. The width of those lines or flows represents the volume, in this case people being sold into slavery. That Angela made it to Jamestown is surprising. After all, most of her peers were being sent to Vera Cruz.
But the year 1619 is important. Because 2019 marks the 400th anniversary of the first slaves being brought into Jamestown and the Virginia colony. The Pilgrims that found Plymouth Bay Colony will not land on Cape Cod until 1620, a year later. The enslavement of people like Angela was built into the foundation of the American colonies.
The article points out how work is being done to try and find Angela’s remains. If that happens, researchers can learn much more about her. And that leads one researcher to make this powerful statement.
We will know more about this person, and we can reclaim her humanity.
For the record, I don’t necessarily love the textured background in the graphics. But I understand the aesthetic direction the designers chose and it does make sense. I do like, however, how they do not overly distract from the underlying data and the narrative they present.
Credit for the piece goes to Lauren Tierney and Armand Emamdjomeh.
Oh, hello. Apologies for the break from posting, however, after the Thanksgiving holidays I fell ill. Consequently I spent the entirety of December either sick or on holiday. Neither of which is conducive to posting. But I have largely recovered and so we begin a new year with a new post.
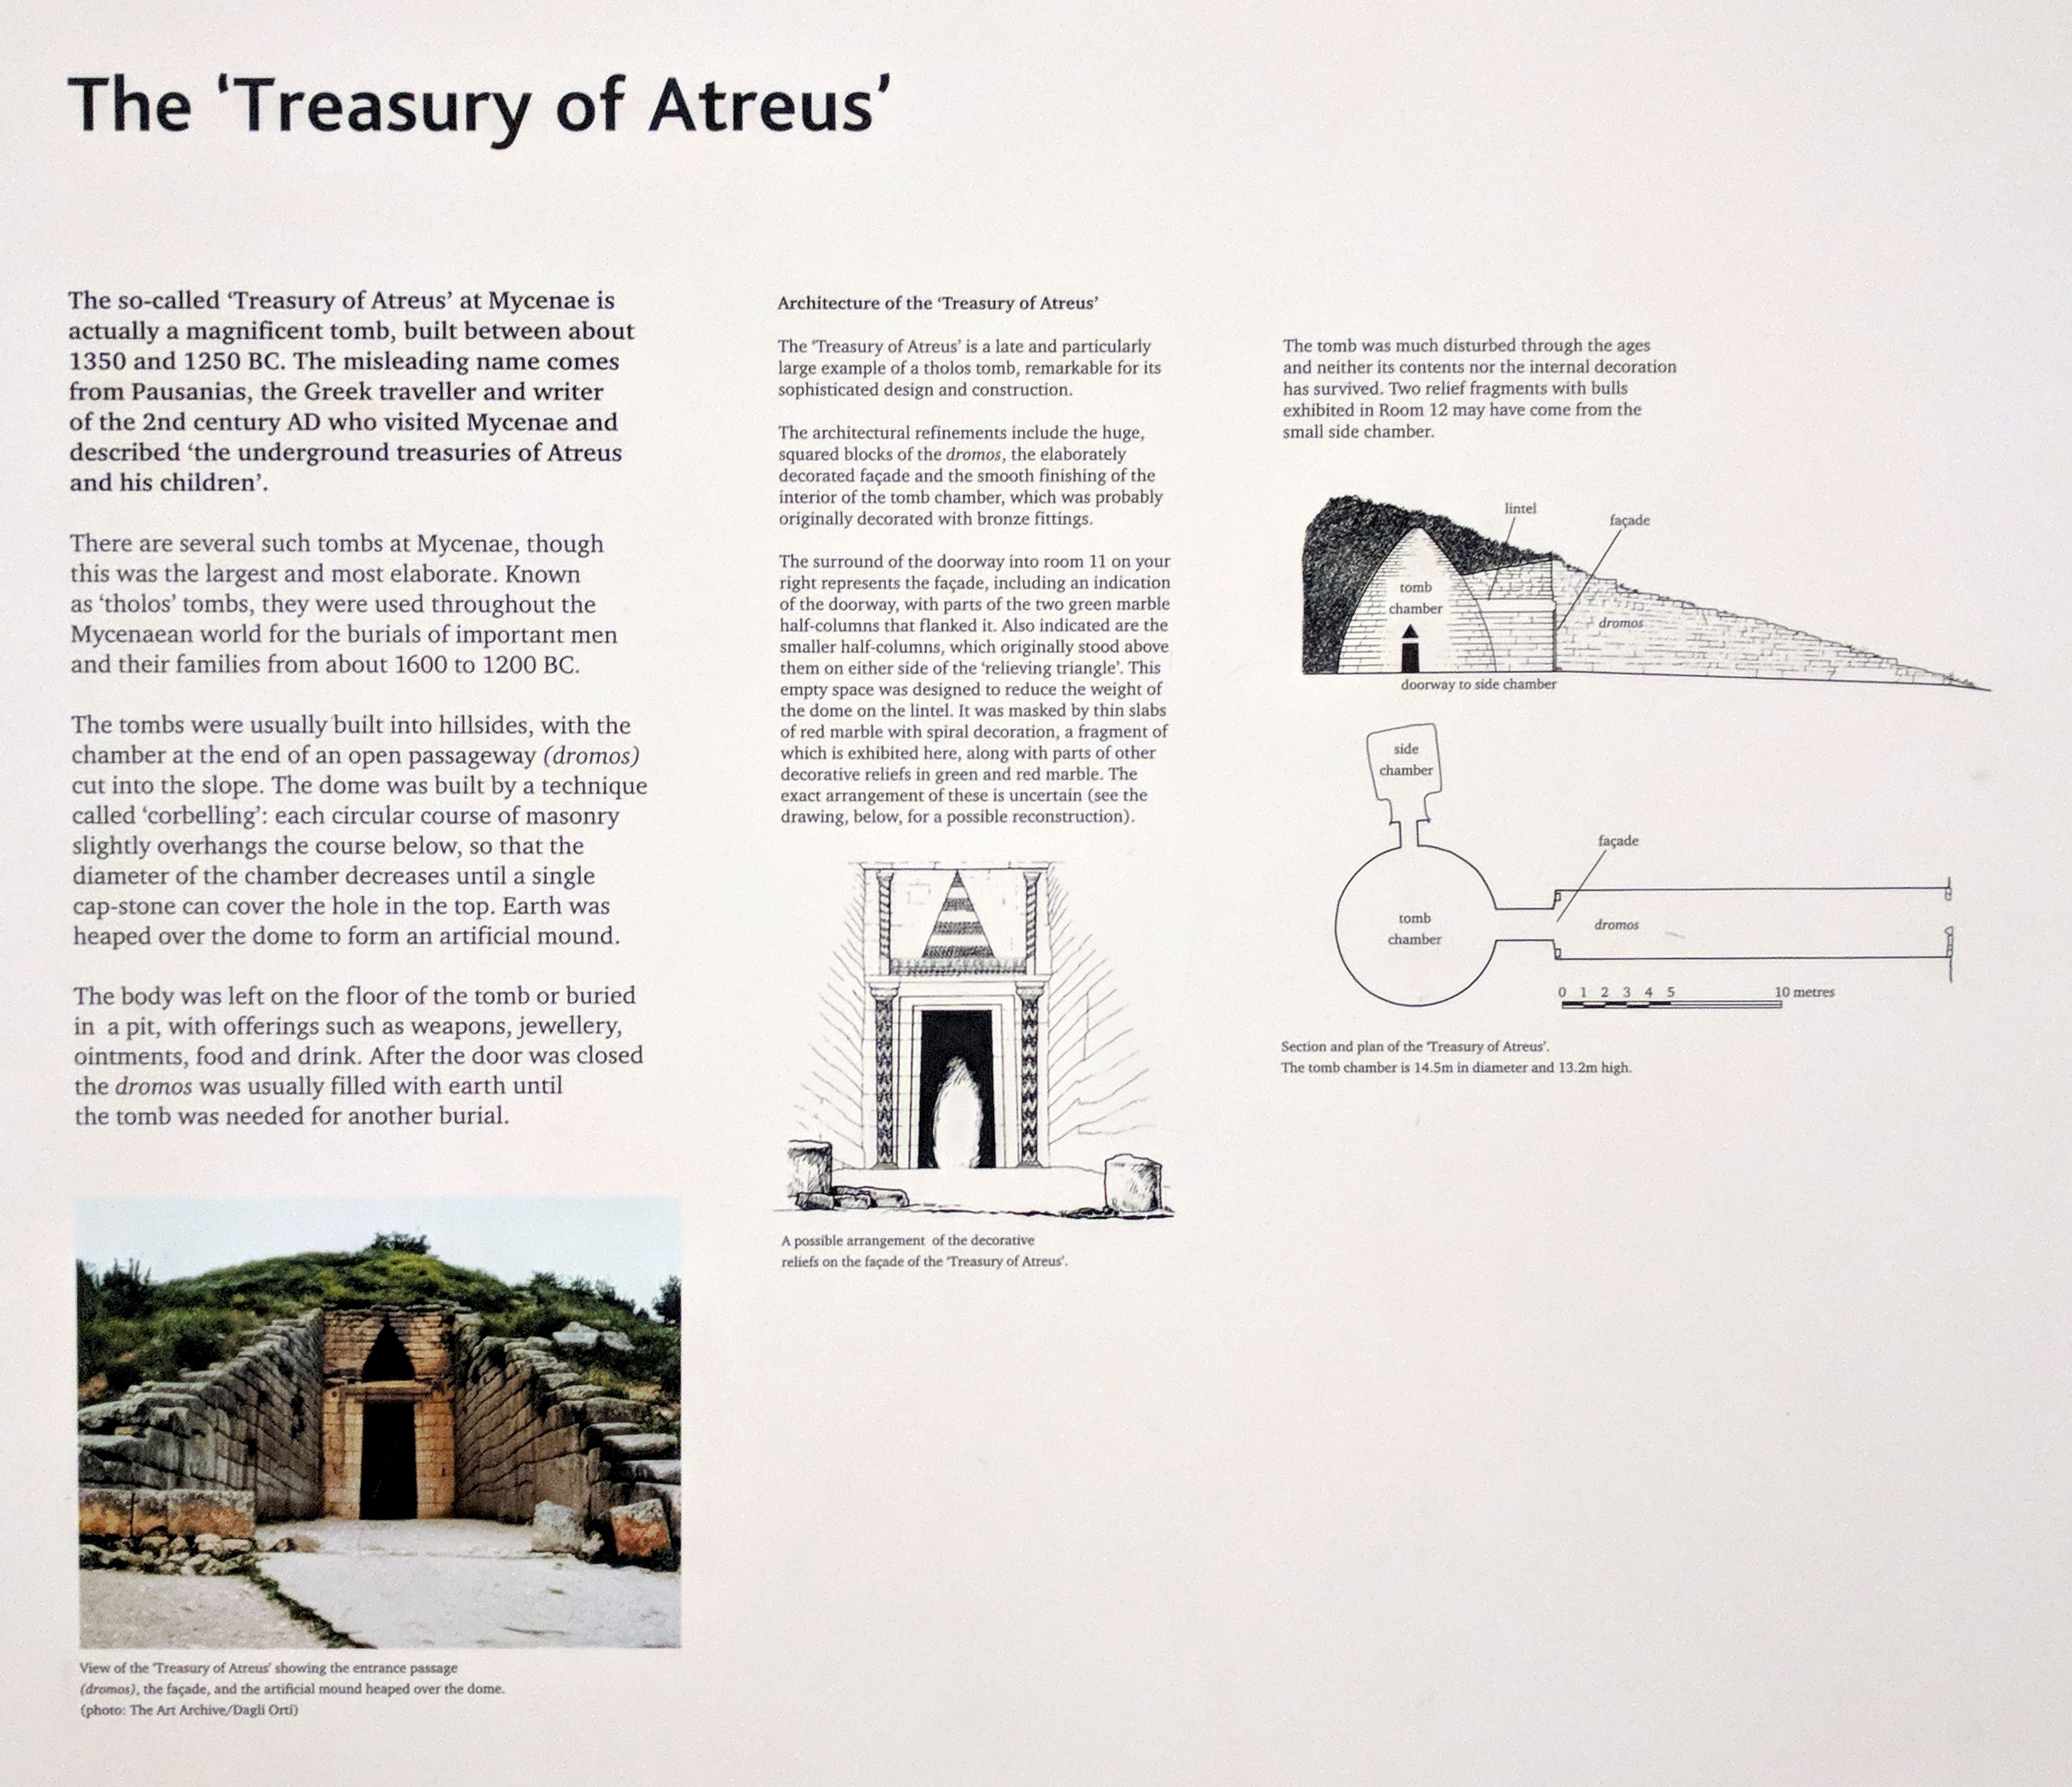
This piece comes from my visit to the fantastic British Museum. It describes the Treasury of Atreus. It was neither a treasury nor of Atreus. Instead it served as a tomb for an unknown man, but someone of great importance. The signage displays the structure of the tholos, or tomb, and how it was oriented.
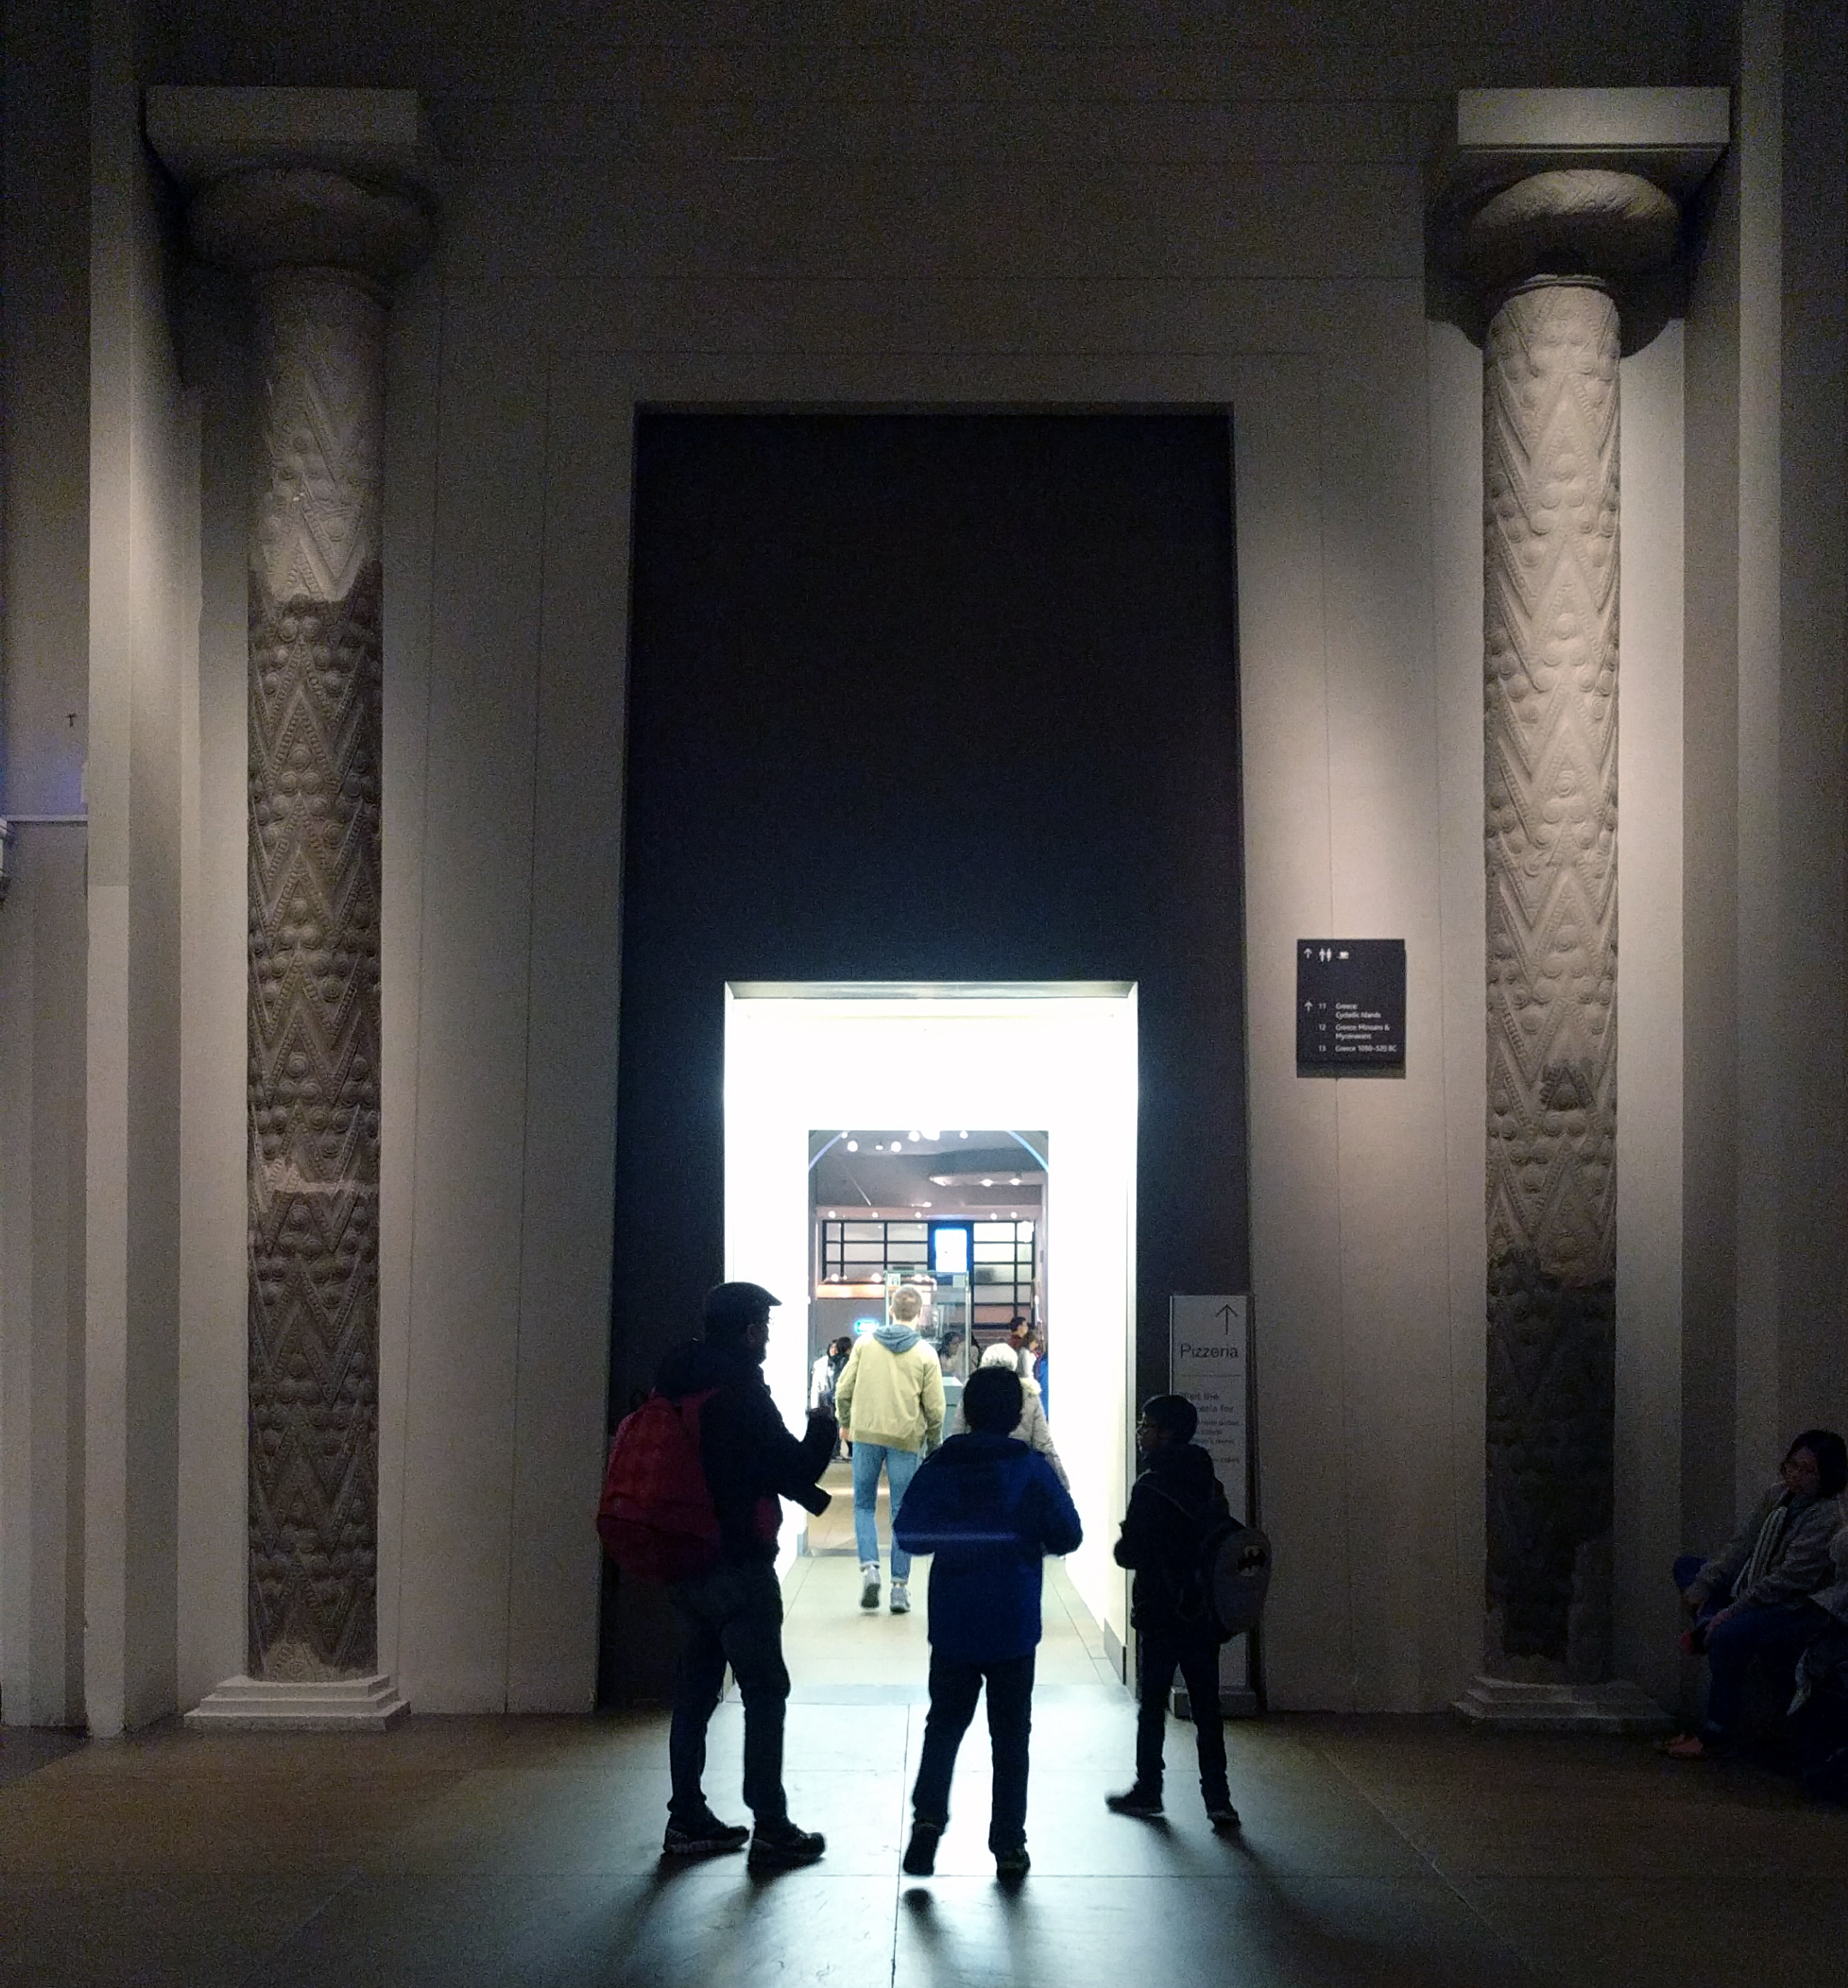
The sign explaining the Treasury and the fragments to the right along with the massive columns .
Signs like these make exhibits far more insightful, for me at least. The design of the tholos could be explained solely through words, however a graphical representation does wonders for me and, likely, others who learn better visually.
This sign could be like any sign, however, until I read the small sentence explaining the doorway to the right of the sign represents the facade of the Treasury with the two columns part original and part reconstruction. When you realise that and then see it, the true scale of the Treasury becomes known.
The actual columns, or parts thereof, of the Treasury of Atreus
Credit for the piece goes to the British Museum’s design staff.
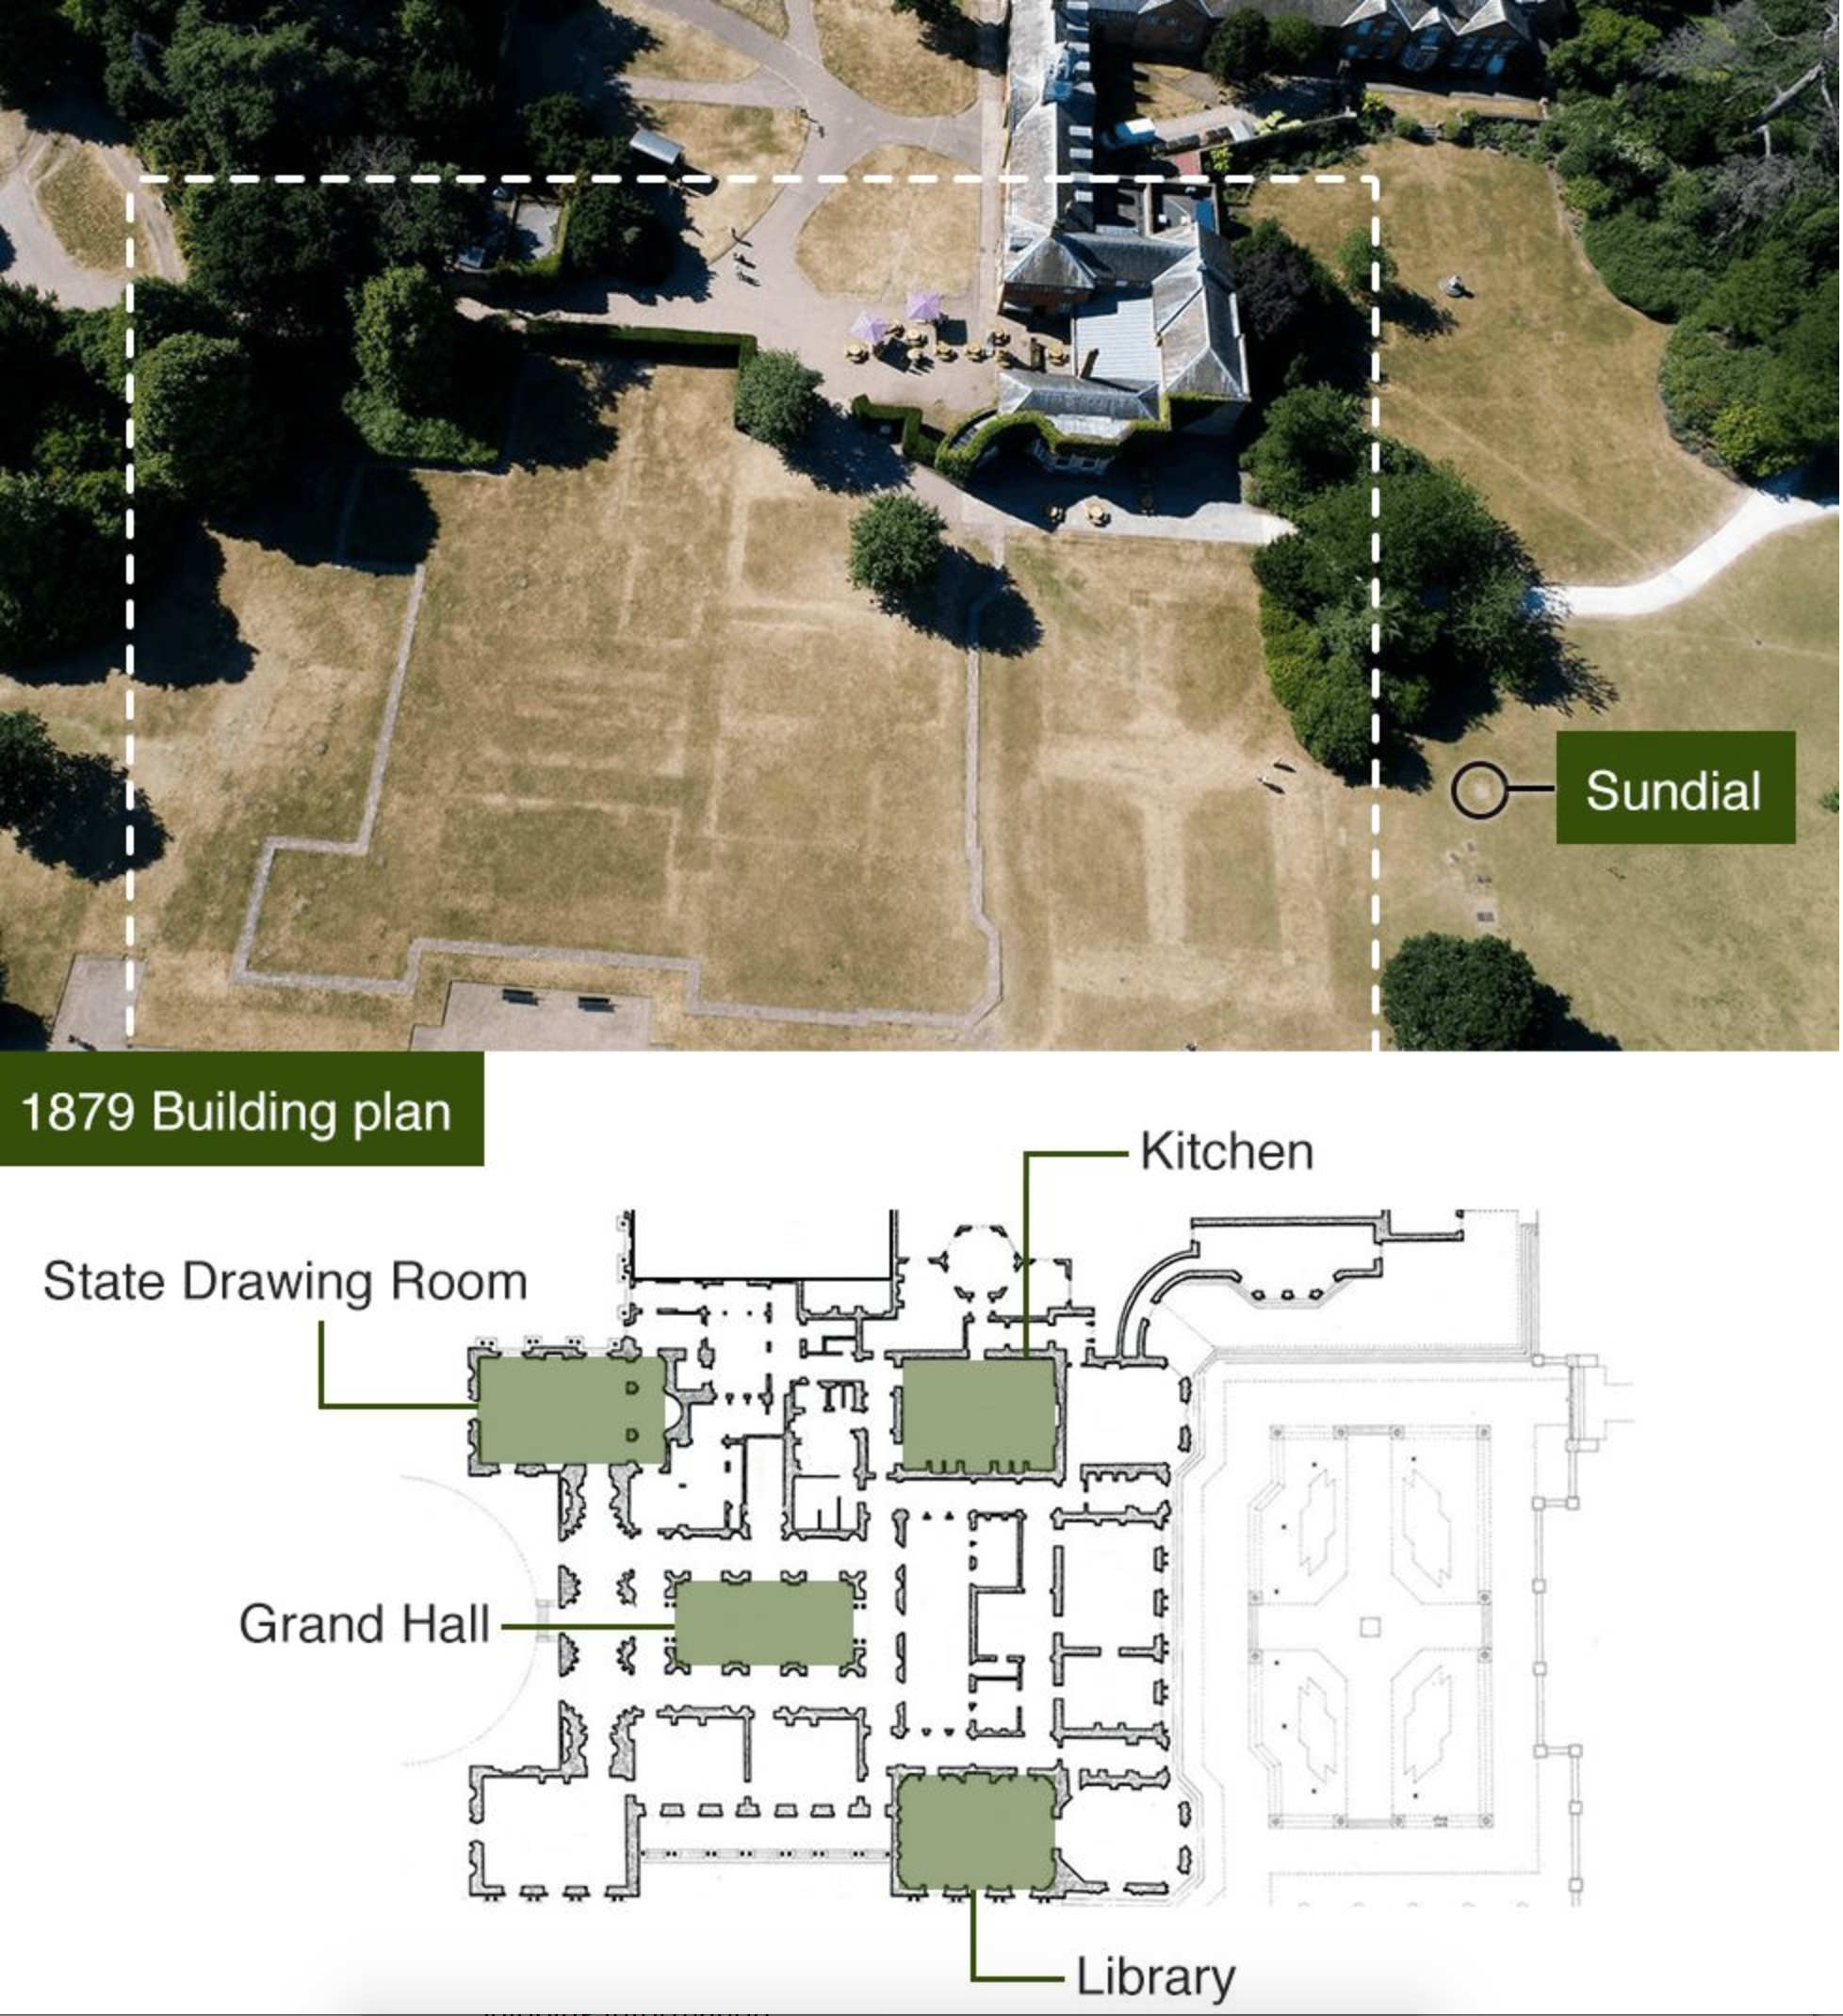
The United Kingdom has been…well, enjoying is not the right word for me, so let’s just say witnessing a heatwave. And it is having some unexpected consequences. In short, things like grass will behave differently in extreme conditions when planted on soil vs. when growing atop stone, wood, or other non-natural features. This helps identify foundations and alike for long-forgotten structures. The BBC has a nice piece looking at some work just like this discovered across the British Isles.
The house was known about, but the details are still fascinating.
Credit for the piece goes to Paul Hancock and PH Aerial Photograph.