Forecasting Snowfall

So that fishy little storm the Weather Channel called Nemo—you may have heard of it—put a little snow across New England. Last week the New York Times published an interactive infographic that looked at when and where the snow would be falling, from New Jersey to New York to Maine.
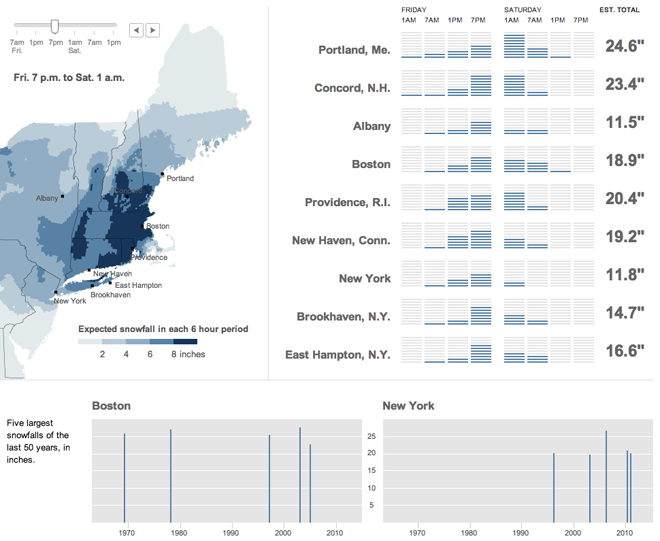
The storm at or near its worst

The times are cut into six-hour blocks and show in the upper left where the snow would be falling by rate per six-hours. To the right of the map is a series of bar charts that show the snowfall pattern in more or less of a wave. Beneath all of it are a comparison of when, over the last several decades, the largest snowstorms hit Boston and New York (and how much snow each city received). A comparison of the map before to the end of the storm, except for parts of Maine.
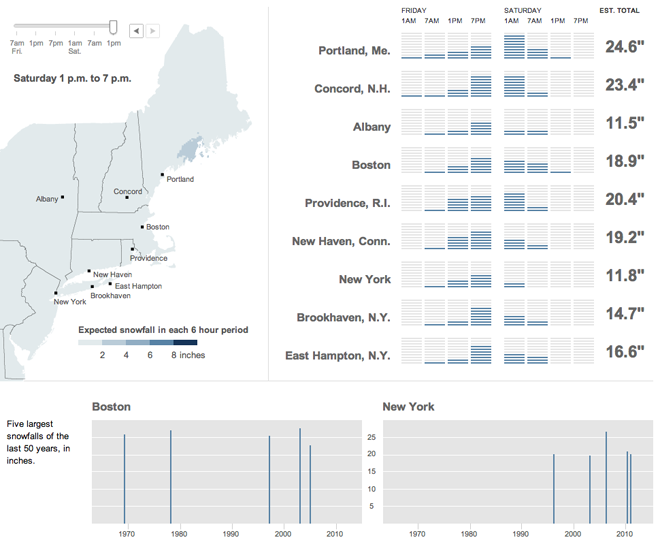
The forecast for after the worst had passed

Credit for the piece goes to Tom Giratikanon, Matthew Ericson, Xaquin G.V., Archie Tse, and Jeremy White.

Whence the Popes Came

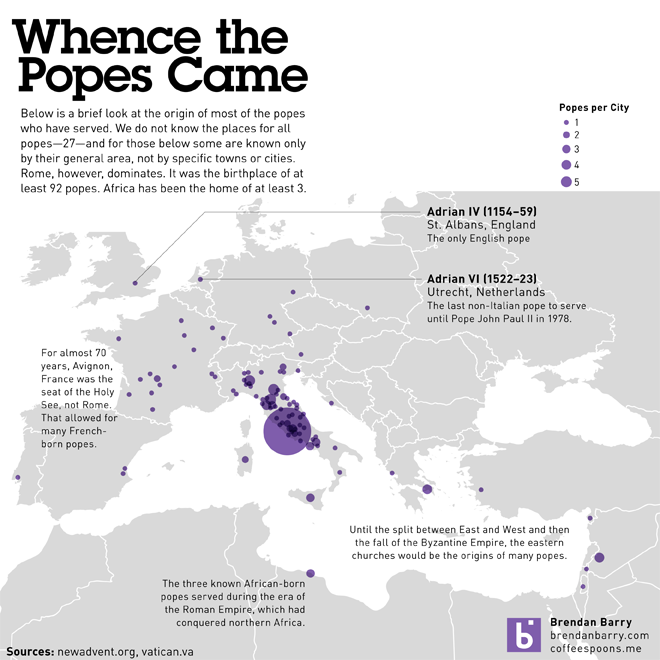
For the first time in centuries, a sitting pope is to resign. Typically most popes have served until their death. The question for many will now be who will be the next pope. Will it be a cardinal from Latin America? From Africa?

I looked at the origins of the all the popes since Peter. (Although the earliest few centuries are sketchy at best with not a whole lot of data.) As it turns out, there have already been probably three popes from Africa. Granted, they all lived during the Roman Empire, but still…that has to count for something…right?…No?…okay. Fine. Well in that case, you have plenty of Italians, in particular Romans to serve. (At least historically speaking.)

Whence the Popes Came

Detroit

Detroit’s population has fallen drastically while its economy has been all but eviscerated with the near-collapse of the American automotive industry. But it was not always that way. The National Post looks at Detroit over the years, starting in 1950. It’s the mapping and charting out of the decline and fall of what was once a great city.

Cropping of the fall of Detroit

Credit for the piece goes to Kristopher Morrison and Richard Johnson.

Taxes

Let’s face it, governments need money to function. If you want a large military, you have to fund it. If you want pension system, you have to fund it. If you want medical care for the old, the sick, and the poor, you have to fund it. If you want to give everyone unicorns made of rainbow beams, you have to fund it. And…well…nevermind.

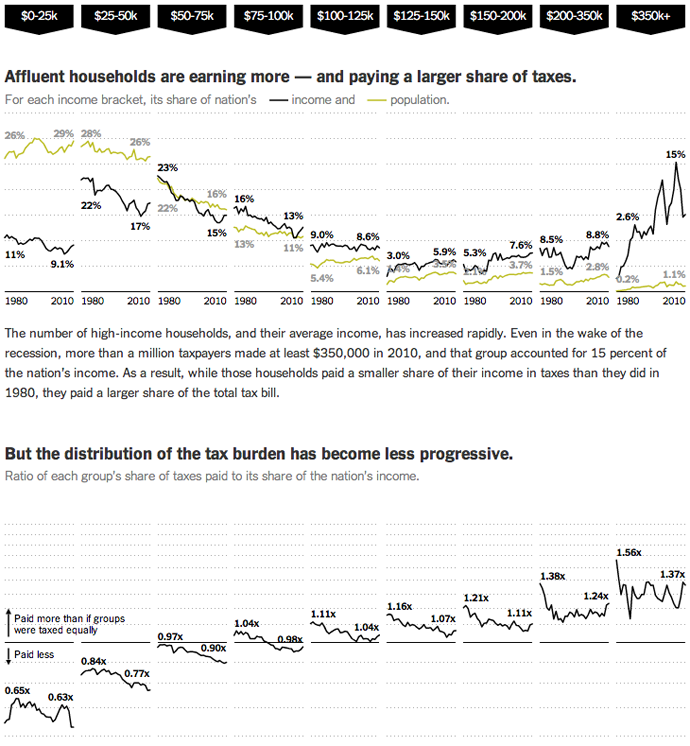
The point is taxes. After an election that focused so heavily on them, we’re still debating them. But here are some facts about them from the New York Times. The designers, Mike Bostock, Matthew Ericson, and Robert Gebeloff used small multiples of line charts—and lots of them—to look at who pays taxes by income band and how they pay different types of taxes. I found particularly interesting the points made near the bottom of the piece about how the progressive tax system is increasingly less so.

How the American tax system is becoming less progressive

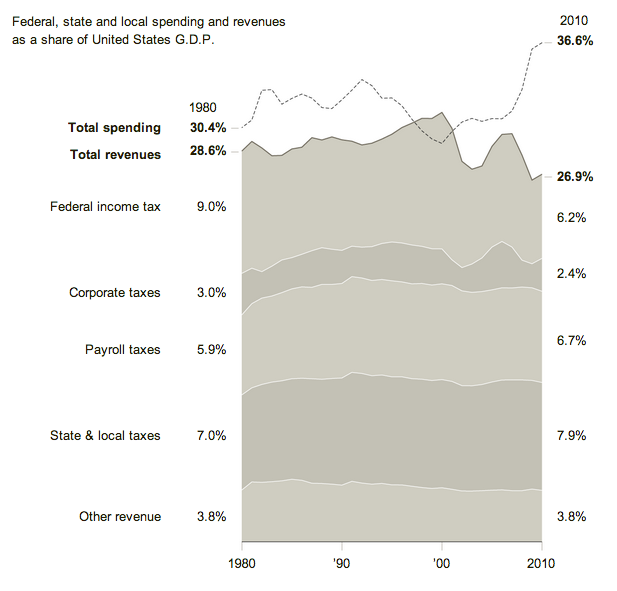
But how do these taxes compare to spending? In a separate graphic for the same article, a stacked bar chart compares revenue to expenditure. With the exception of the balanced budget during President Clinton’s administration, we have been outspending our revenue since 1980. While statements to the effect of the US national budget needs to be managed like a US household budget are both overly simplistic and naive, there is a truth in a long-term mismatch between revenue and expenditure might cause problems. That is why many see the deficit and our debt as a medium-term problem facing the United States.

Spending versus revenue

Credit for the first piece goes to Mike Bostock, Matthew Ericson, and Robert Gebeloff.

Electoral College Victories

Despite the claims of a select few, President Obama’s victory in the electoral college last week was not narrow. While it was not a blowout landslide, it was a clear and convincing win. But to show how it compared across American political history, I quickly charted electoral college results since the time of George Washington.

It is worth keeping in mind that prior to 1804, electors did not distinguish their votes between president and vice president, so those numbers look a little bit different than they might seem today.

Electoral College Results

History of Congress

Today is Election Day. Did you vote yet? If not, why the hell not?

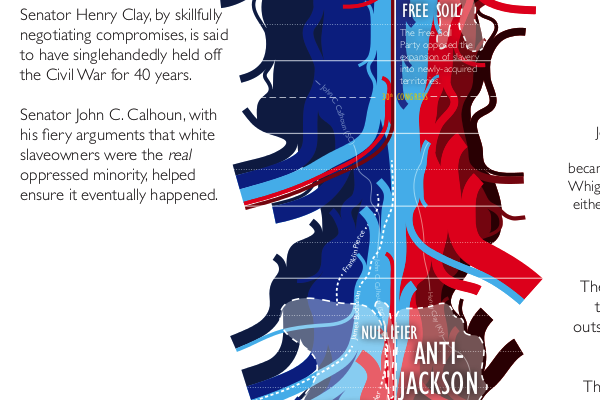
But you are not just voting for president, you are also voting for senators (in some states at least, like Pennsylvania), your congressman or congresswoman, state assemblies, ballot initiatives, &c. And in that spirit, this last pre-vote result post comes from xkcd and looks at the history of Congress and how it leaned right or left over all the years. It’s big, but worth a look.

History of Congress
History of Congress

Credit for the piece goes to Randall Munroe

Show Me Some Swing

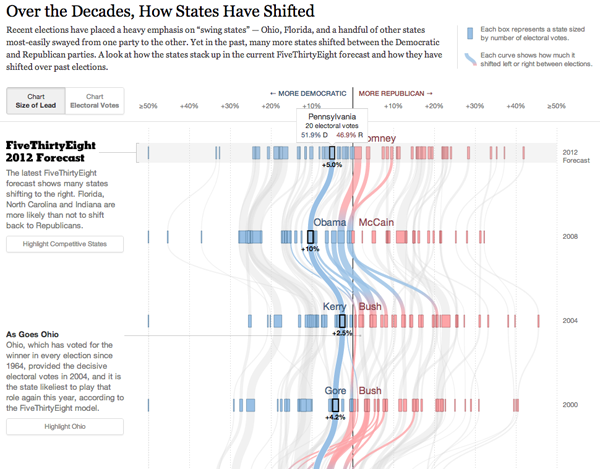
Problems with my access to the tubes of the internets prevented me from posting this piece last week. But it’s still good and still relevant, especially in the wake of last night’s presidential debate. The New York Times and the FiveThirtyEight forecast came together to create this interactive flow chart, if you will, of the ebb and flow of electoral politics.

Show Me Some Swing
Show Me Some Swing

Two different views, one based on electoral votes and the other on the margin of victory, determine the basic chart type. But both let you watch swings states vacillate between Republican and Democratic support. Context is provided to the side of the main graphic to explain just what was going on in particular elections.

Credit for the piece goes to Mike Bostock, Shan Carter, and Amanda Cox.

The Growth of the Non-payers of Federal Income Tax

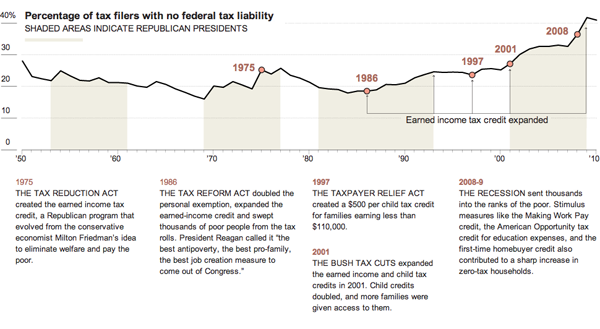
Today will be an unusual day in that it shall have two posts. This first post is following up on yesterday’s about the 47% of Americans who do not pay federal income tax. The Earned Income Tax Credit was created to incentivise people to work. A tax on your income, after all, does the opposite. Why make more money when you pay more of it to the government? By not taxing the poorest Americans, you remove that pressure and instead push the poor towards working for the things they can now purchase. And in so doing, one reduces the level of poverty as those who were poor slowly pull themselves up by their cliched bootstraps.

This is not a liberal idea. One of the earliest proponents of the idea behind the Earned Income Tax Credit programme was none other than Milton Friedman whose laissez-faire economic policies can hardly be called in line with the Democratic platform. And as the following timeline from the New York Times illustrates, the expansion of tax credits like the EITC have generally been largest under Republican administrations.

How the EITC increased the rolls of those who pay no federal income tax

Consequently, the implication in Governor Romney’s dinner that the growth has been Democratic is incorrect. In fact, much of the growth behind this “taker” society can be attributed to Republican policies in previous administrations. We should debate whether Friedman-like policies, but we shouldn’t accept candidates’ placement of blame when it is so broadly applied.

Tax policy is an important part of a nation’s fiscal and economic health. We should have these debates. But we should have these debates understanding the facts. Not false “facts”. Not opinionated “facts”. Not invented “facts”. We should hold our candidates to arguing with the facts. Campaigns need not be driven by facts. Campaigns can be driven by broader narratives. But when policies and platforms are scrutinised, they should hold up to the facts.

Indo-European Language Origin

Polonius once asked Hamlet what he was reading. Hamlet replied “Words.”

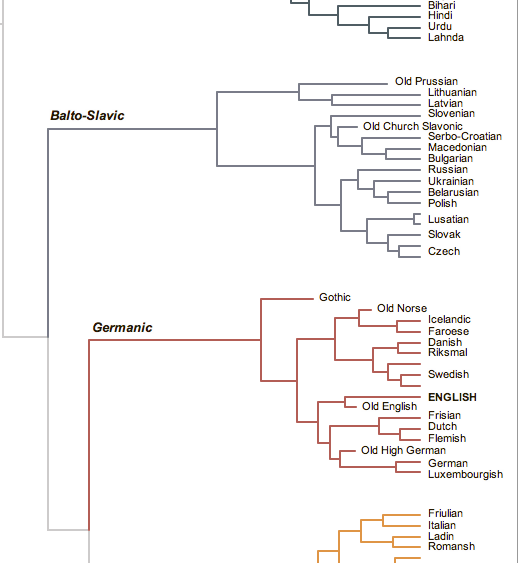
I still love that scene. But, it turns out that we now have an even better idea of where our words came from. It turns out that it is more likely that our shared Indo-European languages originated not in the steppes of Russia but rather Anatolia in Turkey. The New York Times created a graphic that looked at just how the Indo-European family of languages can be broken out.

Branches of our family tree