Women in the US Senate

Women are half the population, but only twenty percent of the upper chamber of the United States Congress. As this great interactive timeline from the New York Times shows, at least that inequity has been narrowing over the last several elections.

The infographic comes in two main views. The first highlights women in the Senate and assigns them chronologically and then colours them by party. Important or notable senators are annotated appropriately. This view also shows the breakdown of women in the Senate at any one time in the small chart in the upper-left. Mousing over senators then provides a little bit of information about the woman in question.

Women in the US Senate

But to put it in perspective, by selecting All Senators, the user can see the whole elected history of the US Senate—remember, prior to the 1920s you did not directly elect senators. That makes for a lot of grey bars, i.e. a lot of men.
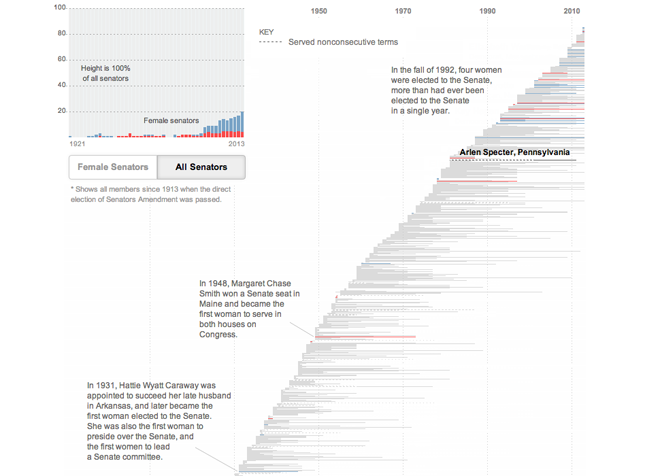
Men and Women in the US Senate

Credit for the piece goes to Hannah Fairfield, Alan McLean and Derek Willis.

The ABCs of the F-35

Certainly in the more illustrative range, a few weeks back the Washington Post published a small piece that looked at the F-35. Somehow it has survived budget cuts and become a monstrous $400 billion defence project. Partly that is because it is being built in three different versions for all the main aircraft-flying service branches: the Air Force (A), the Marine Corps (B), and the Navy (C). The Post piece highlights some of the key differences between the  versions.

The F-35A
The F-35A

Credit for the piece goes to Rajiv Chandrasekaran, Alberto Cuadra, and Bill Webster.

Pro Tip #314: Don’t Stare Into the Sun

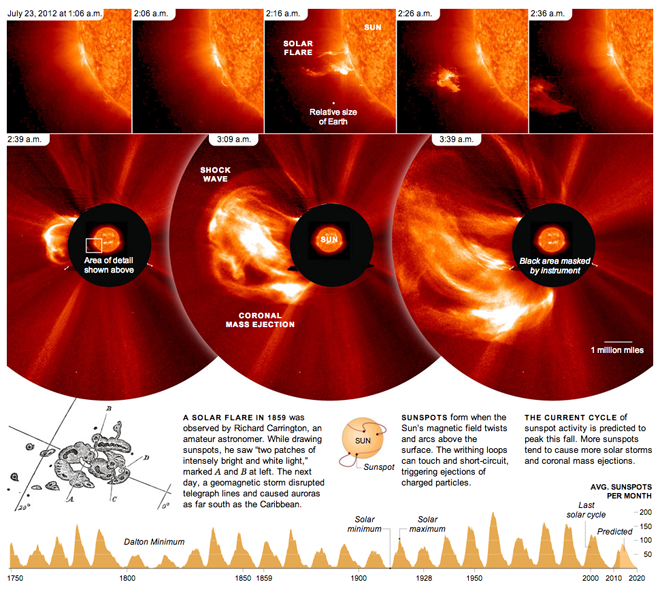
Don’t stare into the sun. It’ll burn your eyes out, kid. Okay, so maybe that’s a stretch of a reference, but, seriously, don’t. Let the professionals do it with (properly shielded) telescopes and such. This piece from the New York Times looks at a solar flare from 2012 and shows how quickly it developed. The bottom of the piece then shows the reader the frequency of solar minimums and maximums along with some explanatory graphics about just what flares and sunspots are and how they are created.

Also note the centre panel in the top row for the relative size of Earth. Yeah, who’s feeling big now? (Not me.)

Don't stare into it…

Credit for the piece goes to Jonathan Corum.

Infographics in Print

I don’t often get to share printed infographic work because so much of the data visualisations and the narratives I see are seen through the interwebs. And since I cannot live in every city in the world and troll through all their newspaper pages for good infographics, I have to see online/digital versions.

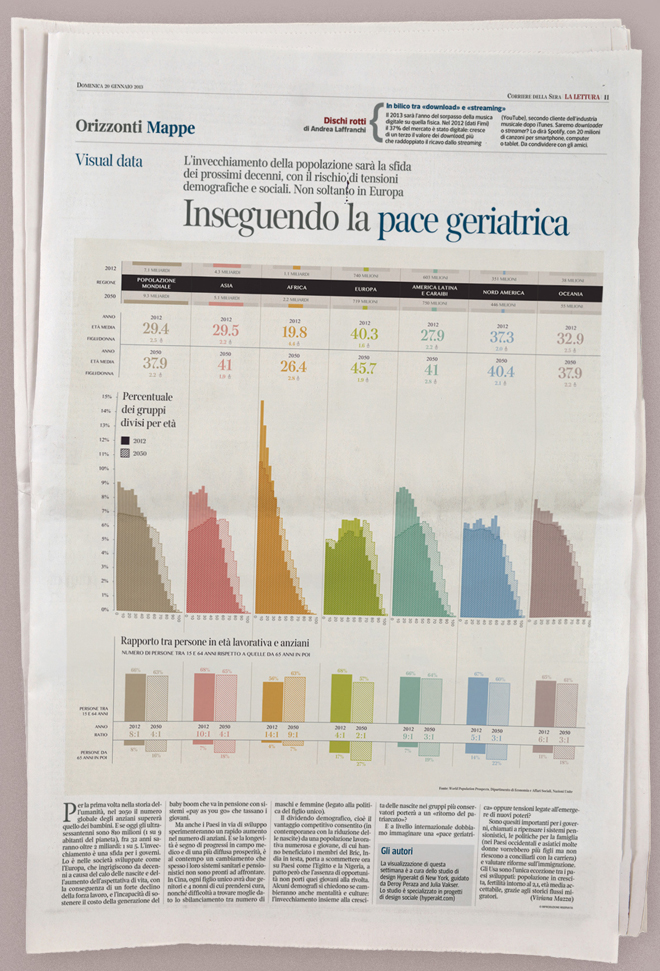
That’s why this work by Hyperakt for the Italian weekly La Lettura is a great find. Hyperakt included a photo of their work in its natural environment, i.e. the printed page. The immediate drawback is that I do not speak Italian and can comprehend very little of the piece. Thankfully, Hyperakt did include a translated version on their page.

Aging Populations
Aging Populations

Credit for the piece goes to Deroy Peraza and Eric Fensterheim.

Feltron 2012 Annual Report

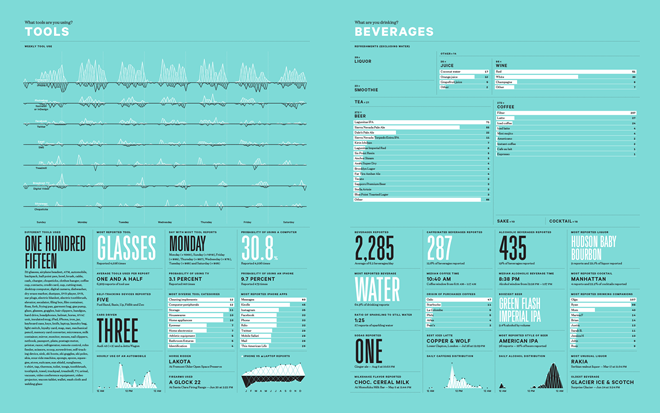
Perhaps the most recent winner in the unsurprising post category is Nicholas Felton’s latest Feltron Report, for 2012. As usual, solid work. Below is the spread for beverages, something which I am known to record and report upon from time to time.

A record of drink consumption sounds familiar…

Credit for the piece goes to Nicholas Felton.

US Trade Balance

The US imports a lot. But it does not export quite as much. The difference between those two figures is what is known as the balance of trade. Quartz looks at the US balance of trade not at an overall level, but between individual countries.

US Balance of Trade
US Balance of Trade

This is not one of my favourite pieces. For starters, while the overall figures are in the accompanying text, it would be useful to include total US imports and exports alongside the graphic as a point of reference.

Secondly, a long-standing issue I have is area comparisons. Sometimes they are needed and useful, a good example is a tree map. But in this piece, the circles do not add up to a recognisable whole. They also do not help when looking at individual countries and their historical trade values. A dotted outline of a circle shows the previous year’s trade. But more often than not, the trade level was so similar that the circles nearly overlap exactly.

The grouping and highlighting functionality hints at a useful application to explore US trade data, but the clumsiness of the circles renders that usefulness moot. .

Credit for the piece goes to David Yanofsky.

Wealth Inequality in the United States

Reality is never what you think. Over at the Washington Post’s Wonkblog I found a post about a YouTube video looking at wealth inequality in the United States. It looks at a study that compared what Americans thought the distribution of wealth in the United States is vs. what they think is an ideal distribution. And then the video compares that to the actual distribution.

The video is rather solid and does a fairly good job at explaining its point. And those unsure about wealth inequality and how it is different from and sometimes more meaningful than income inequality should read the post along with the video.

Wealth inequality
Wealth inequality

Credit for the video goes to a YouTube user named Politizane.

Analysing Amtrak

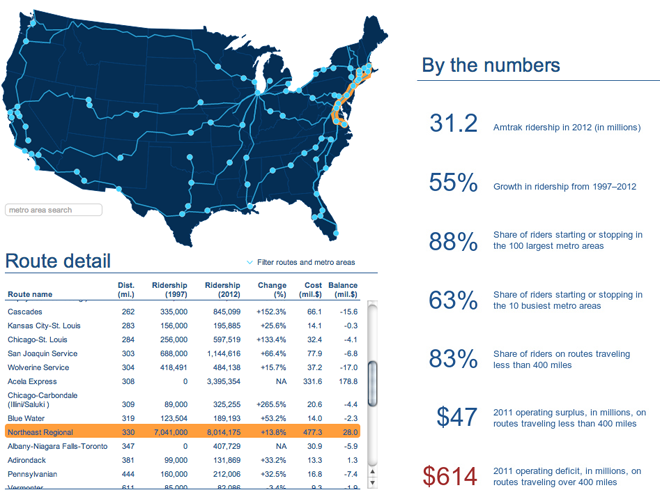
The Brookings Institution released a report investigating the ridership of Amtrak’s various routes in an attempt to identify ways of cutting costs. They also released an interactive piece along with the report that pairs a map with a simple table.

Highlighting a route in the table highlights the route in the map and links the two together for the user. Clicking a dot on the map shows the details for the metropolitan area ridership along with the total number of stations. Lastly, because the table is sortable, the user can identify for themselves the conclusion reached by the report. To become solvent, Amtrak should divest itself of its long-haul routes that run at significant losses and focus on the profitable routes that could subsidise the popular though still minor loss-making routes.

Amtrak routes with the Northeast Regional highlighted

Credit for the piece goes to Alec Friedhoff.

The United States Compared to the Rest of the World

Have you ever wondered how big the United States is? MAPfrappe allows you to compare different geographies in Google Maps.

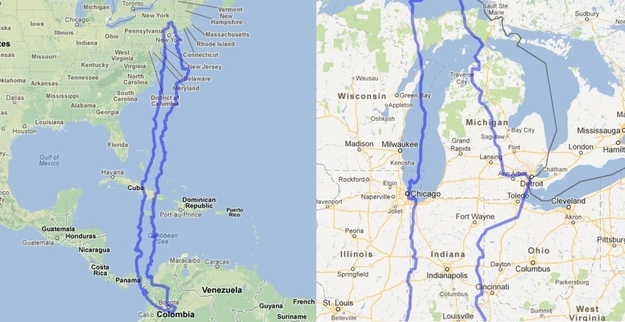
My employer has an office in Chicago and an office in Santiago, Chile. How big is Chile? North-to-south it is quite large. But east to west, the distance is like that of driving from Chicago to Detroit.

The United States compared to Chile

Via BuzzFeed.

Hugo Chávez’s Venezuela

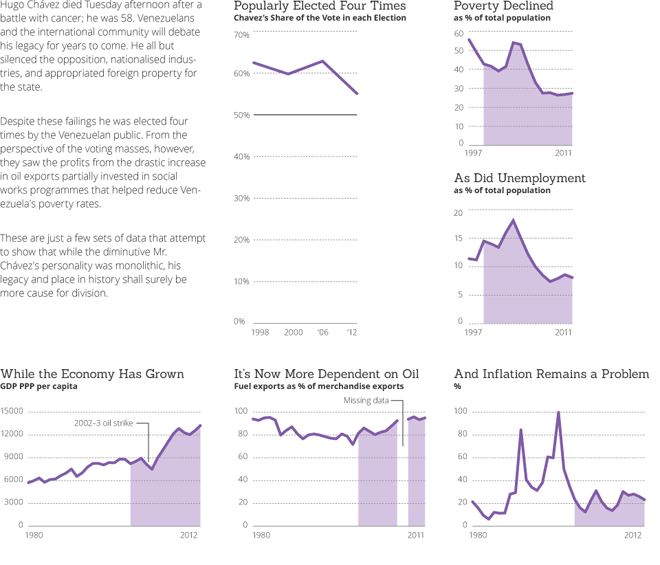
Hugo Chávez died yesterday. He was a controversial president to be certain. Some claim he was a dictator who tolerated no opposition. But he won four elections. Some claim he helped reduce poverty and ease the suffering of the poor. But he eviscerated the middle class and private enterprise. And he has left Venezuela in a precarious situation.

With only several hours’ time to research, design, and create this infographic, I can only offer a brief overview of the Venezuela that Chávez took under his stewardship in 1999 as compared to Venezuela today. But it’s a better starting place for the dialogue than nowhere.

Click for the full image.

Venezuela under Chávez