Nuclear Tests

Last night, in the States’ time at least, North Korea purportedly tested a hydrogen bomb. How does this differ from their previous tests? Well, those were all nuclear fission bombs, this is a nuclear fusion bomb. (Admittedly, I am simplifying a lot here.) Hydrogen bombs, the H-bomb, are more powerful and more efficient in that they emit less radiation. They are still pretty bad news, though. That bit has not changed.

Anyway, the Washington Post put together a nice piece about nuclear weapons testing. The big feature piece is a map of test sites over time. What I really like about it, however, is that they chose to split the world at a different point—the Pacific Ocean opposite the Prime Meridian. I have occasionally argued for using such maps more often given the increasing relevance of Asia and the relative decline of Western Europe. So it is nice to see it put to good use here.

Nuking the Pacific
Nuking the Pacific

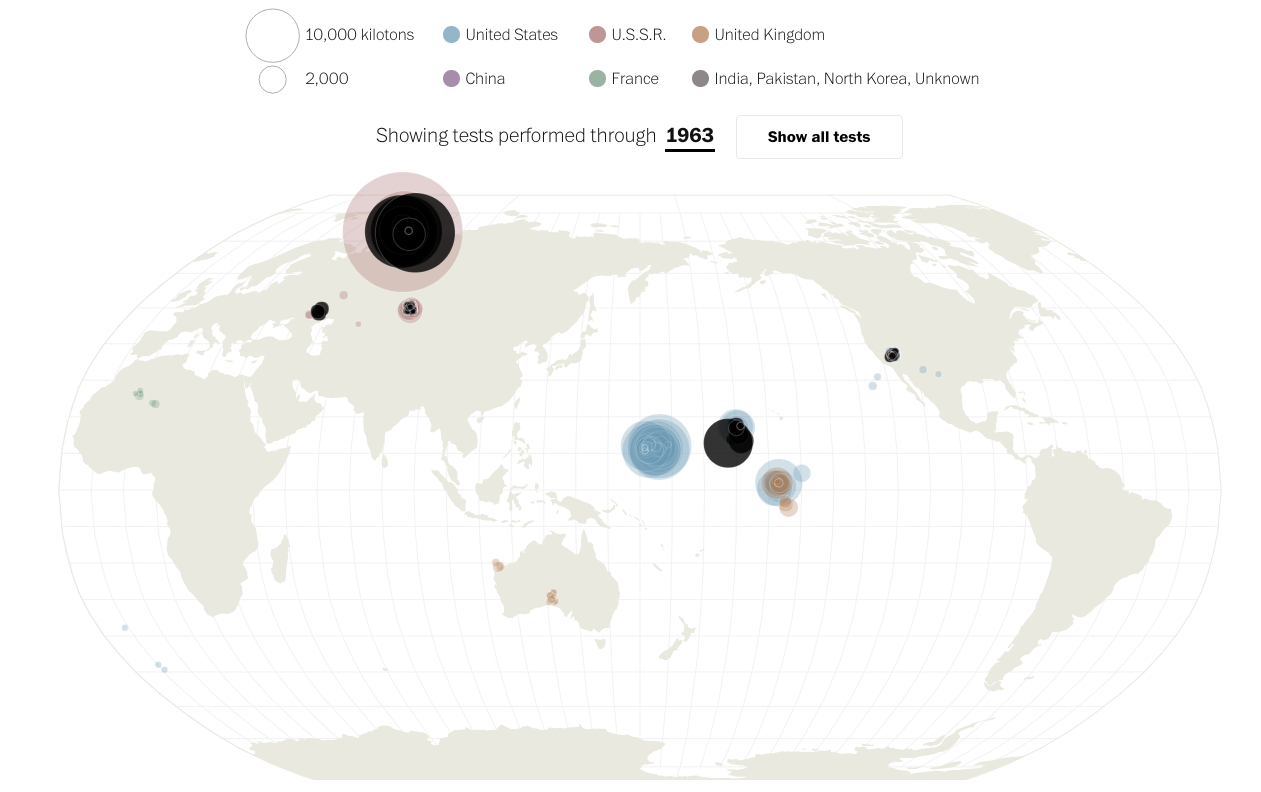
Credit for the piece goes to Kevin Schaul.

Details in Charts

Today we are looking at a smaller piece from the Washington Post. The graphic fits within an article about US stock prices. What the graphic does is show the total scale, i.e. starting the chart on the 0 axis, and then showing in detail the fluctuations near the maximum end of the scale. And yet all of this done as an inset graphic. It need not be a full-width graphic, because the data does not demand it.

The chart is in the details

Credit for the piece goes to the Washington Post graphics department.

Married Men

Sorry for not writing the last few weeks, but I was on a much needed holiday. But I’m back now. And first things first, one of my good mates got engaged whilst I was back in Philadelphia. And so in honour of that we have today’s piece.

Married men
Married men

As the graphic might hint, it’s about marriage. The piece dates from September of last year—2015 and I think I will have to get used to that for a few weeks—and looks at the demographics of marriage mostly in the United States. The chart above in particular looks at men that are married at every age by year, i.e. how many men aged 30 were married in 1960 versus 2013.

Credit for the piece goes to Mona Chalabi.

Syria’s Refugees

We go from one crisis to another, as we go back to Syria. This piece from Bloomberg is very nicely designed and is almost entirely in black and white. We often think that because computer, everything needs to be in a rainbow of shiny, shiny colours. But here we have places where the designers smartly used patterns and smart labelling to avoid the need for colour.

A fantastic black and white map

Credit for the piece goes to Cindy Hoffman, Dave Merrill, Chris Nosenzo, Mira Rojanasakul, and Blacki Migliozzi.

Climate Change in Charts

So yesterday we reimagined a less-than-stellar BBC chart. Today, we look at a good chart from the BBC about climate change, timed to coincide with the start of the Paris climate talks. This comes from an article with six charts related to climate change, but it is the best in my mind.

The trend…not so good.

Nothing but nice design here with the use of colour to highlight the top ten hottest and coldest years over the last 225+ years. But it really comes alive when animated and tells the story how those coldest years occurred at the beginning of the set and the hottest are among the most recent years.

Credit for the piece goes to Emily Maguire,  Tom Nurse, Steven Connor, and Punit Shah.

A Royal Nation

You may recall a year and a half ago a post I wrote up about a New York Times piece looking at the fandoms of baseball in the United States. Well fresh off their hometown Royals’ World Series victory, the folks at the Kansas City Star revisited the graphic—driven by Facebook likes—to see if there had been any change. Sure enough, Royals Nation—or whatever they call it—has made inroads into what was before St. Louis Cardinals territory.

Missouri is a little more blue these days

The only sad part about the article is that they talk of changes in adjacent states, e.g. Kansas, but have no maps for those.

Credit for the piece goes to Jay Pilgreen.

Friday Night in Paris

So Paris happened. But the question is how exactly? Thankfully the New York Times are on it as they try to explain Friday night.

A diagram of the events inside Bataclan theatre

Worth pointing out the list of credits below. Clearly the piece was a team effort.

Credit for the piece goes to Gregor Aisch, Wilson Andrews, Larry Buchanan, Jennifer Daniel, Ford Fessenden, Evan Grothjan, K.K. Rebecca Lai, Haeyoun Park, Yuliya Parshina-Kottas, Graham Roberts, Julie Shaver, Patrick J. Smith, Tim Wallace, Derek Watkins, Jeremy White, and Karen Yourish.

Making Sense of the Syrian Civil War

Well, I mean trying to is this piece by the Washington Post. Included are several diagrams at key phases of the conflict that attempt to show how the various parties interacted with each other.

Look at all the actors on stage…

Ultimately the key takeaway is that Syria is a mess and it is not getting any better. So let’s just add some more lines in there, am I right?

Credit for the piece goes to Denise Lu and Gene Thorp.

Job Gains

You should all know by now I am sucker for small multiples. So it should come as no surprise to you that I liked this piece from Friday from the Wall Street Journal. It looks at payroll and wage growth across various sectors in the American economy. And what I really like is that they took a space at the beginning to explain how to read the charts.

Mining, not so good
Mining, not so good

Credit for the piece goes to the Wall Street Journal graphics department.