Ebola on a Plane

Definitely not really, but far more interesting than snakes. Today’s piece comes from the Guardian. Admittedly, the piece and thus the data is a month old, but it still is an interesting way of looking at the impact of the Ebola outbreak in Africa.

Flight impacts in Sierra Leone

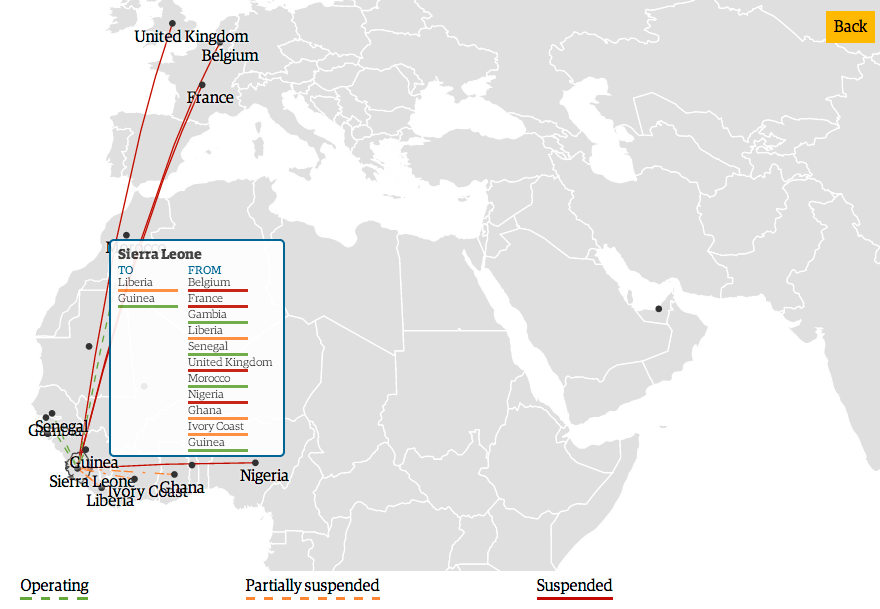
The graphic begins with a map highlighting the spread of the outbreak and some of the immediate measures taken by different governments. By clicking on a button, however, the user can get more details on the specific impact of quarantines and border closures. In this case, I have clicked on Sierra Leone and can see that a good number of flights are either suspended or partially suspended.

Credit for the piece goes to Achilleas Galatsidas and Mark Anderson.

Investigating the NYPD for Excessive Force

Sometimes complaints about excessive police force are frivolous or vindictive in nature. Sometimes, however, they are legitimate. In New York, the Civilian Complaint Review Board is the first line of investigation. It makes recommendations that the NYPD then takes up. Or not. This piece from WNYC looks at how the NYPD has responded to those recommendations.

What the NYPD chose to do with cases in which charges were recommended

In total, the piece is a guided story. Each step morphs the data into a new display. Overall a small, but quite nice piece.

Credit for the piece goes to the WNYC graphics department.

Autonomous Cars

Some days I do not enjoy the thought of driving to the office. For those days, I take mass transit. However, in the future, I may be able to sit back and allow my car to drive me. This illustration from the Washington Post examines just how one example of such vehicles functions.

Autonomous car
Autonomous car

Credit for the piece goes to Alberto Cuadra.

Importing Russian Gas

Today’s post is a graphic from the New York Times that looks at Russia’s hold on energy across Europe. I’m not terribly keen on this particular graphic for a few reasons. First, the design needs to incorporate the actual datapoint so the reader can compare across countries. Comparing the height of each black bar to each other is difficult at best.

Secondly, the data excludes the energy trade between European Union countries. And that strikes me as potentially quite a lot. Just because a country is importing from another EU country does not mean it is importing less.

Russian gas market in the EU

Credit for the piece goes to the New York Times graphics department.

Does the Apple Fall Far from the Tree?

Last week Apple announced its plan for its new Apple Watch. I am not quite a watch aficionado, but I do have a preference for my light, minimalist design watches. So I find this comparison of the new smart watches from Bloomberg quite interesting. The only watch to which I aesthetically gravitate is the Moto 360. But for those of you more interested in some of the specs, they compare those figures via bar charts to the right of the illustration.

A watch comparison
A watch comparison

What about you, readers? Do you have a favourite of the new smart watches? Either based on specs or aesthetics?

Credit for the piece goes to Shawn Hasto and Keith Collins.

When the Baltimore Oriole Abandons Baltimore

Climate change has more of an impact than just extreme weather. For one, not all weather will necessarily be warmer. Two, animals and plants will be affected in terms of their natural habitat. The New York Times recently put together a piece about the impact of climate change upon birds. And it turns out that in less than a century, it is projected that the Baltimore Oriole will no longer find its preferred climate in Baltimore, but rather further north.

Where the birds are and aren't
Where the birds are and aren’t

Credit for the piece goes to K.K. Rebecca Lai, Larry Buchanan, and Derek Watkins.

Cycling Deaths in Australia

Cycling can be quite dangerous. But apparently this summer was quite dangerous over in Australia. So much so that the Guardian did some data reporting on it back in June. Thankfully they included some charts in that reporting, the heat map below being one example.

Cyclist fatalities
Cyclist fatalities

None of the data visualisation in the piece is revolutionary or earth-shattering, but it is a solid piece with some solid charts backing up an interesting story.

Credit for the piece goes to Nick Evershed.

Terror Attacks Throughout the World

Last week many American observed 11 September in remembrance of the terror attacks that brought down the Twin Towers, a section of the Pentagon, and four airliners in total. So this week we are going to see some fantastic work from Periscopic that highlights several other terror groups operating in the world across the last few decades. 

Irish Republican Army attacks

The charts work as a timeline from 1970 through 2013 and then vertically from January through December. Above and below the timeline, respectively, are the numbers of people killed and wounded. When shown as small multiples, the overall piece can show you which groups have been active and lethal, active but without lots of fatal attacks, and those that are fading out or fading in.

Credit for the piece goes to Periscopic.

Soda

Happy Friday, everybody. I cannot say about you, but I certainly love seeing dialects and regional variations of words, phrases, pronunciations mapped out. So thankfully we have some work by Alan McConchie to look at today, specifically versus the soda vs. pop debate. As the screenshot shows, I come from a solidly soda camp. But I was reminded recently at a wedding that the Midwest is, generally speaking, pop country. Midwesterners have to learn to straighten that out.

It's soda in Chester County
It’s soda in Chester County

Credit for the piece goes to Alan McConchie.

Drought Severity

Not here in Chicago at least. But across swaths of the Southwest, people are experiencing droughts. But the New York Times is on it, with a tracker updated weekly.

Nary a drop to spare in Southwest.

Credit for the piece goes to Mike Bostock and Kevin Quealy.