
One of the most pressing questions of the times was answered last week. Is Florida the South? Cue the Tampa Bay Times.
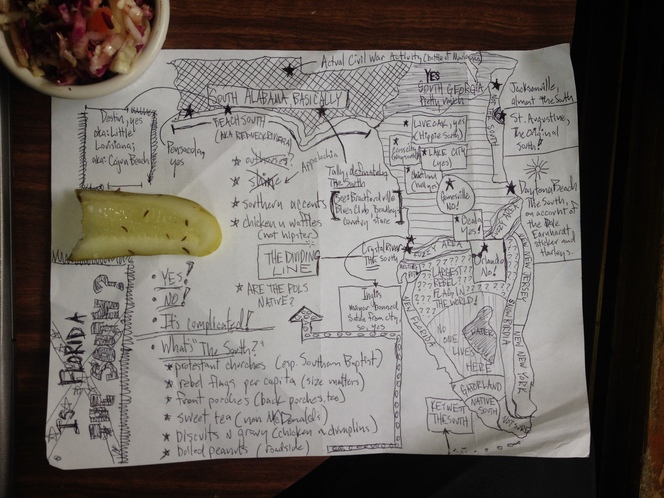
Credit for the piece goes to Ben Montgomery.
One of the most pressing questions of the times was answered last week. Is Florida the South? Cue the Tampa Bay Times.
Credit for the piece goes to Ben Montgomery.
Today’s post comes via a co-worker. LinkedIn’s R&D lab published a tool to map your LinkedIn connections. You login to your account and then receive a social network of map. Mine, seen below, clearly shows three different and generally not inter-connected networks. The orange represents my current employer; the blue is my university network; the green and pink are high school and my employer while in university (they were in the same town).
To be fair, I’m not a frequent user of LinkedIn. So for those of who you use it more regularly to make connections, contacts, and acquaintances will find yourselves with more complex networks.
Credit for the piece goes to LinkedIn.
Today we dive into state-level politics north of Chicago, in the state of Wisconsin. The Milwaukee Journal Sentinel published an in-depth article looking at the political divide in the Milwaukee metropolitan area. While one could publish an article of that nature with just lots and lots of words, the Journal Sentinel chose to use maps and charts to support their arguments.
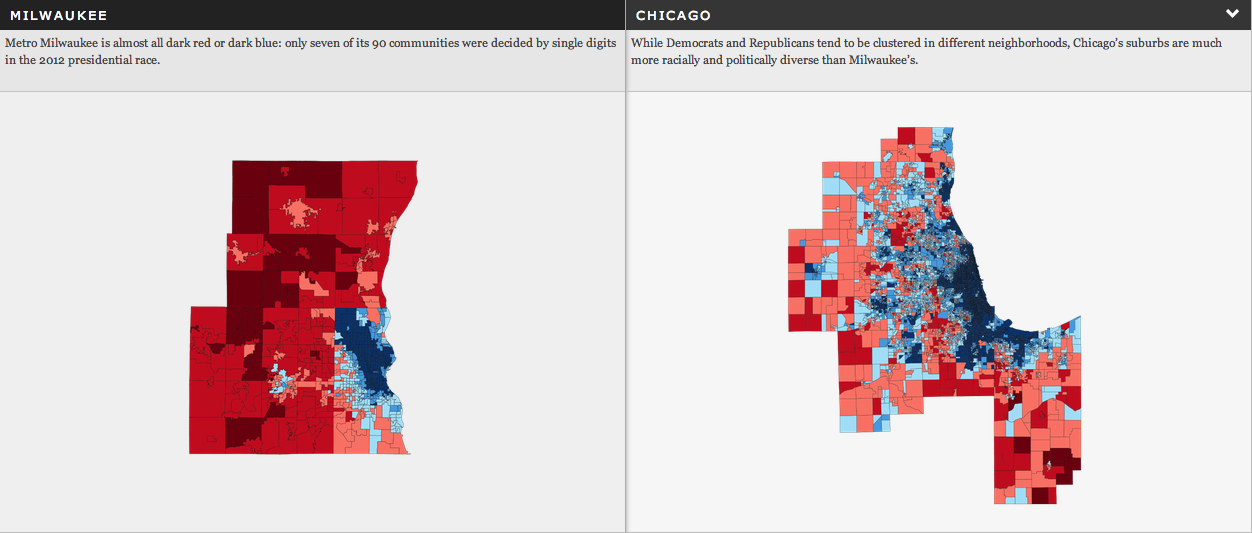
Credit for the piece goes to Craig Gilbert and Allan James Vestal.
This past weekend was some good Red Sox baseball. Okay, so we only won two of three from Oakland, but that second game was fantastic. John Lester dominated. Last fall I mentioned a studio called Statlas that was visualising the World Series. They continue to update and tweak their product and so it was great to see Lester’s performance documented.
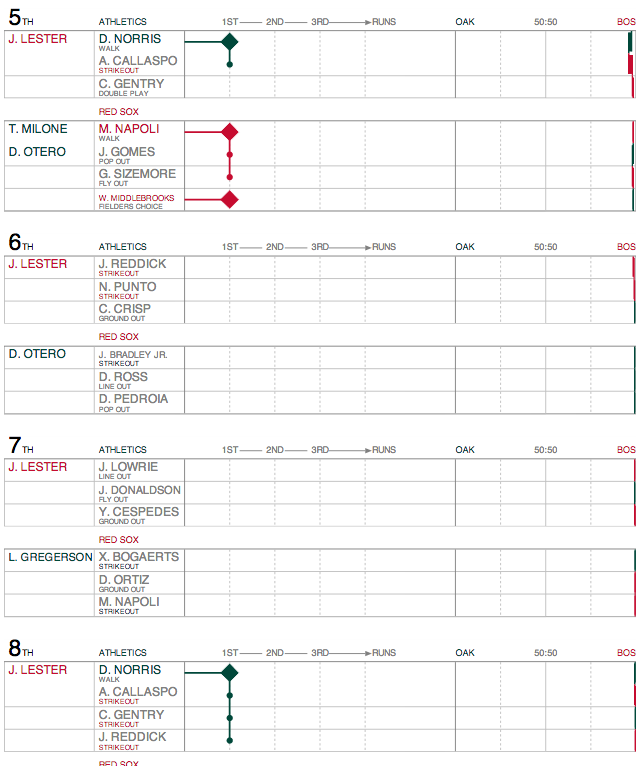
Though, as you can see, Lester so dominated the Athletics, you can see almost nothing happening from Oakland’s batters. But, I will skip the near ninth-inning implosion of Boston’s relief corps that nearly cost us the game. Mostly because the visualisations of the game tell a great story. And so if you like baseball and data visualisation, you should check it out.
Credit for the piece goes to Statlas.
Today I am going to take a day-long step away from data visualisation. The Harvard Business Review recently published a short piece looking at some of the symbolism—I mean symbology clearly—we use on the internets.
Credit for the piece goes to the Harvard Business Review.
…forty minutes late with an iced coffee? It’s what we millennials do since we don’t understand that time exists between 04.00 and 10.30. Don’t believe me? Well, Nate Silver over at FiveThirtyEight crunched the numbers and it turns out that there is some truth in the humour. Cities with a younger, more millennial workforce tend to see workdays start later.
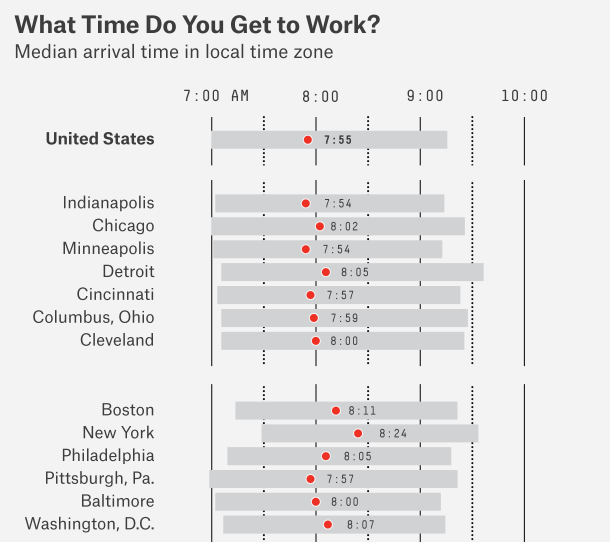
Credit for the piece goes to Allison McCann.
Things continue to deteriorate in eastern Ukraine. And along the other borders of Ukraine, NATO is boosting its presence with planes, ships, and soldiers. This graphic from Jane’s details the recent deployment of aircraft to the theatre.
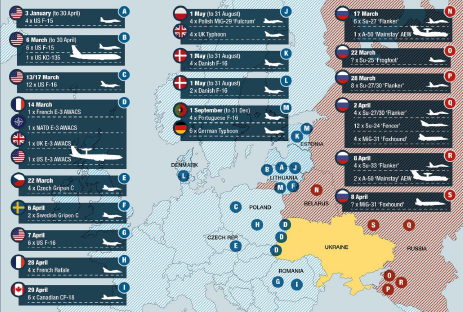
Credit for the piece goes to IHS Jane’s Defence Weekly.
Rebels in Syria have recently acquired American-made anti-tank missiles. But for those who don’t know how exactly the TOW missile system works, the Washington Post illustrated it. In theory, these weapons will give the rebels an advantage over Syrian armour.

Credit for the piece goes to Richard Johnson.
As troops and tanks and rumble around the Ukrainian–Russian border, I was left to wonder just how NATO has been doing with defence spending. So I took defence spending as a share of total GDP. In general, NATO countries have been spending less since the end of the Cold War. The Baltic states are a bit of an exception. I would guess that is based on their fears of their big Russian neighbour. A fear that, as Ukraine shows, is not entirely irrational. The United States, of course, has been spending a lot because of Afghanistan and Iraq. As for Russia, after the collapse of its economy in the late 1990s, it’s been spending more and more on the military.
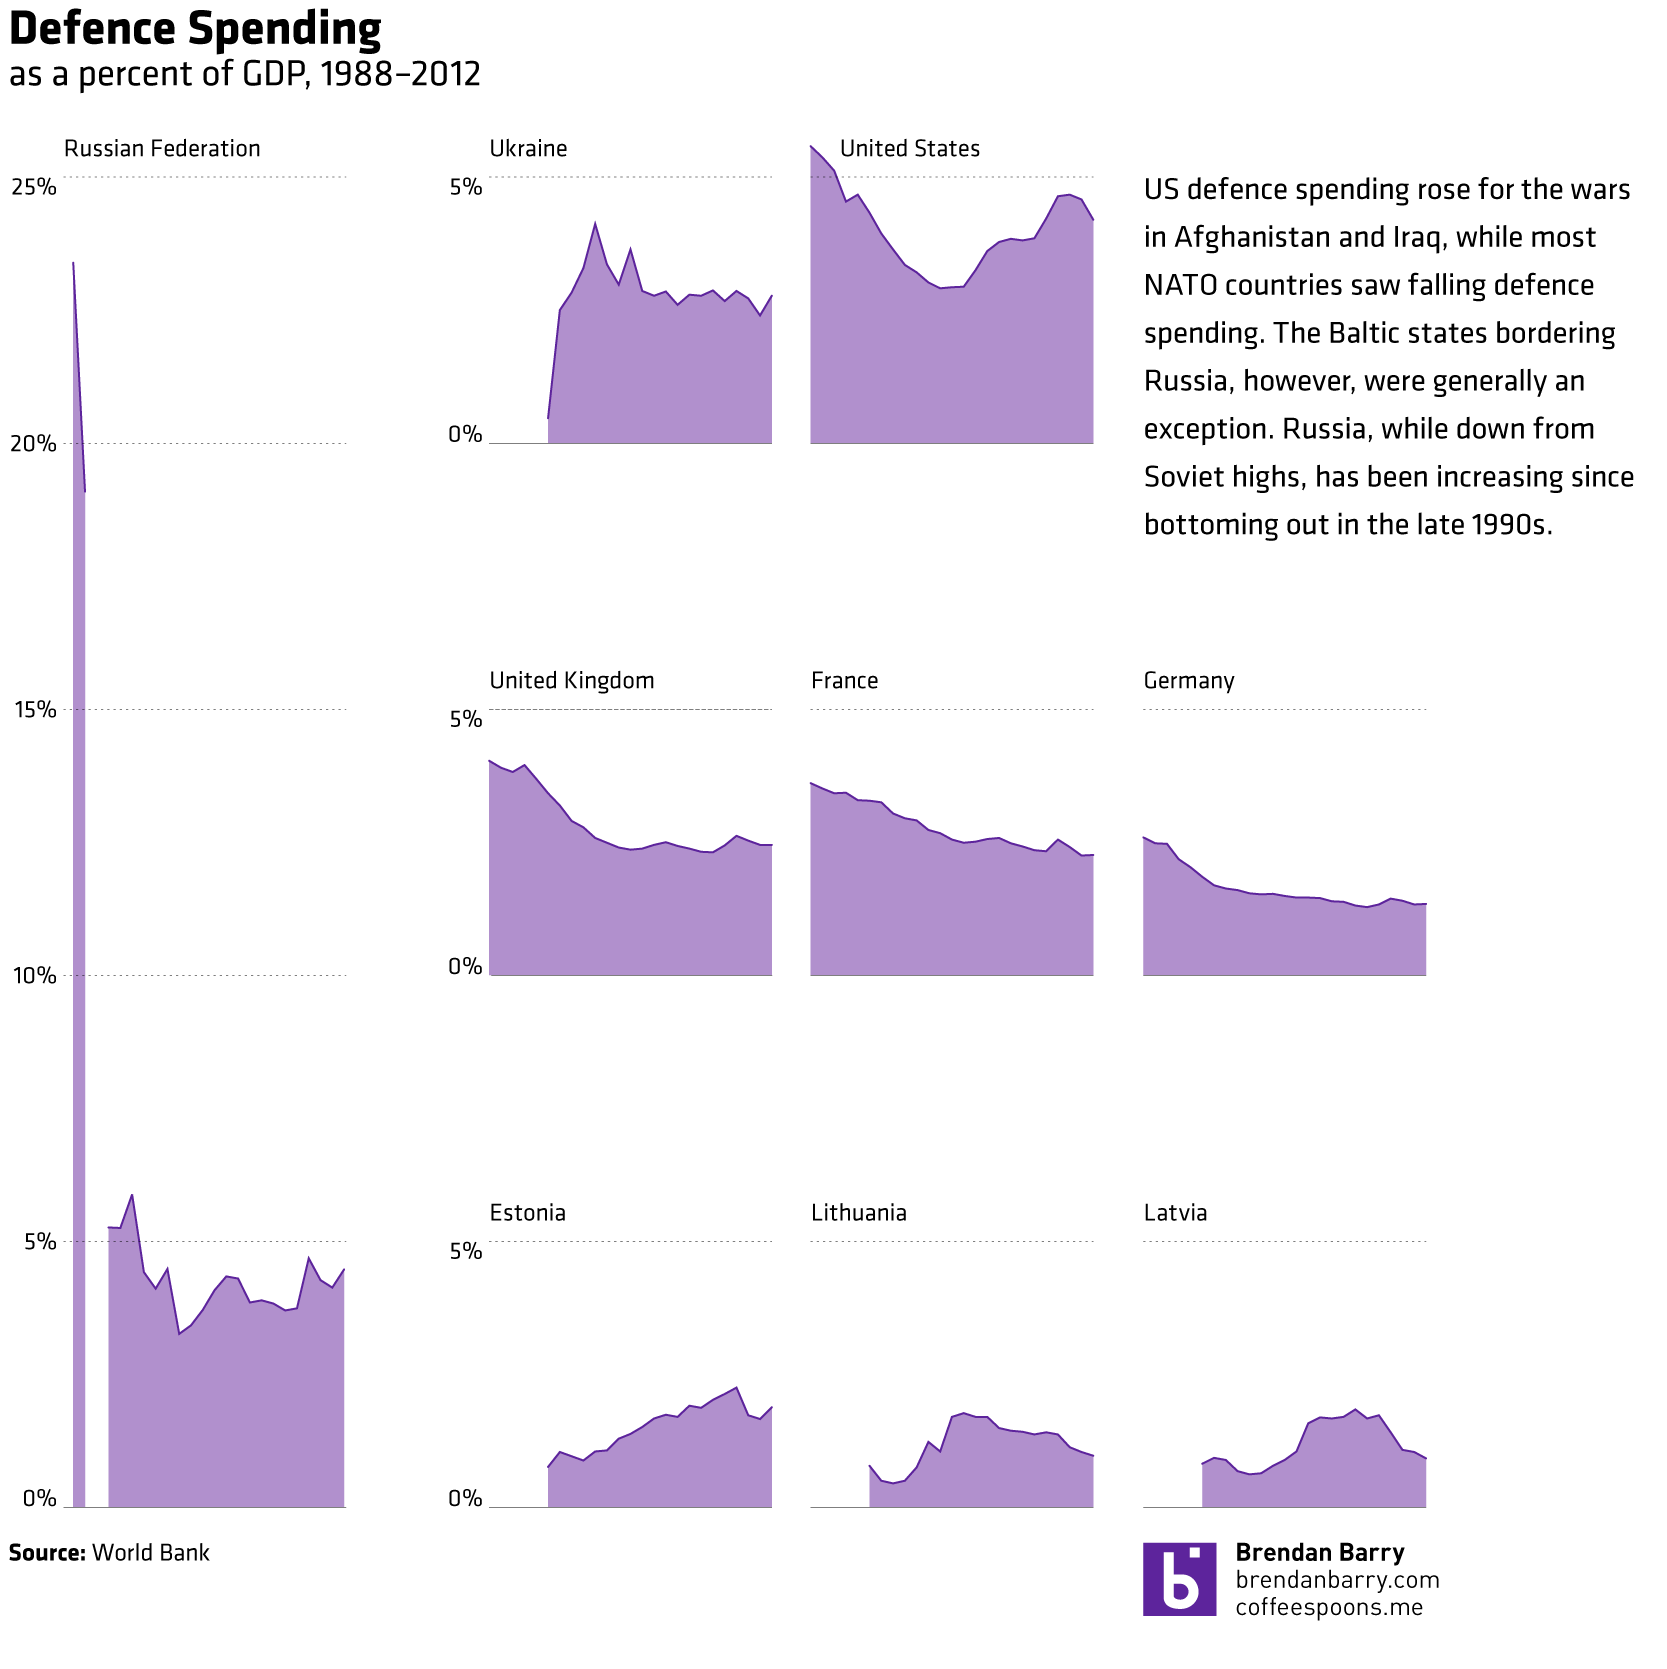
The data comes from the World Bank.
Today’s post is a small interactive map—nothing fancy there—about indoor plumbing. As it turns out not every home in the United States has it. Of course, last weekend I ended up driving through those dark counties in western Pennsylvania. And I can believe it. And I can definitely say I saw a few outhouses.
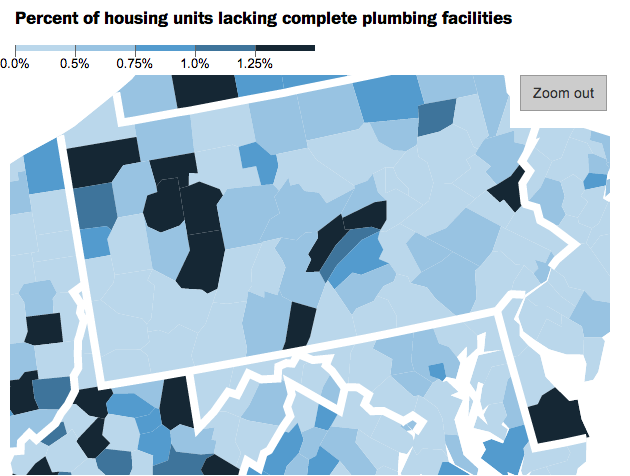
Credit for the piece goes to Christopher Ingraham.