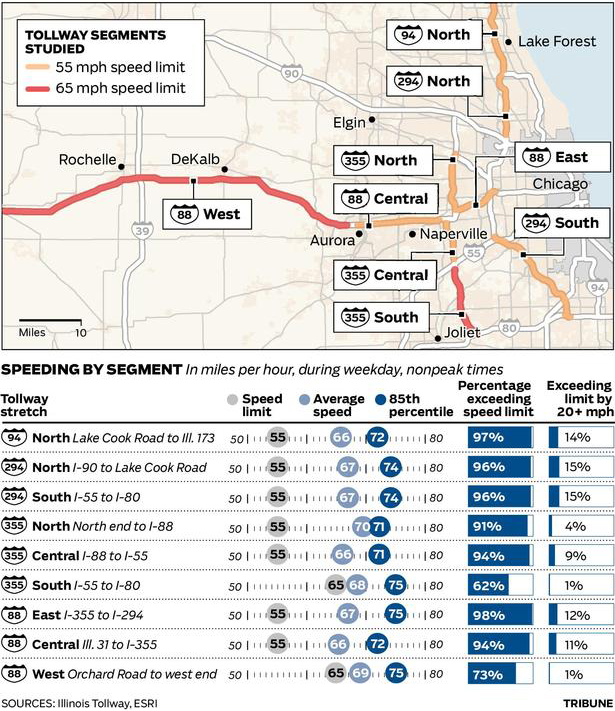
The Illinois Tollways will be raising speed limits starting 1 January. Part of that process includes researching current driving habits and patterns. This graphic by the Chicago Tribune looks at some of the results. While the map part is necessary to show the routes themselves and the limits on those routes, the more interesting part is the dot plot below.
Illinois Tollway speeds
Credit for the piece goes to the Chicago Tribune’s graphic department.
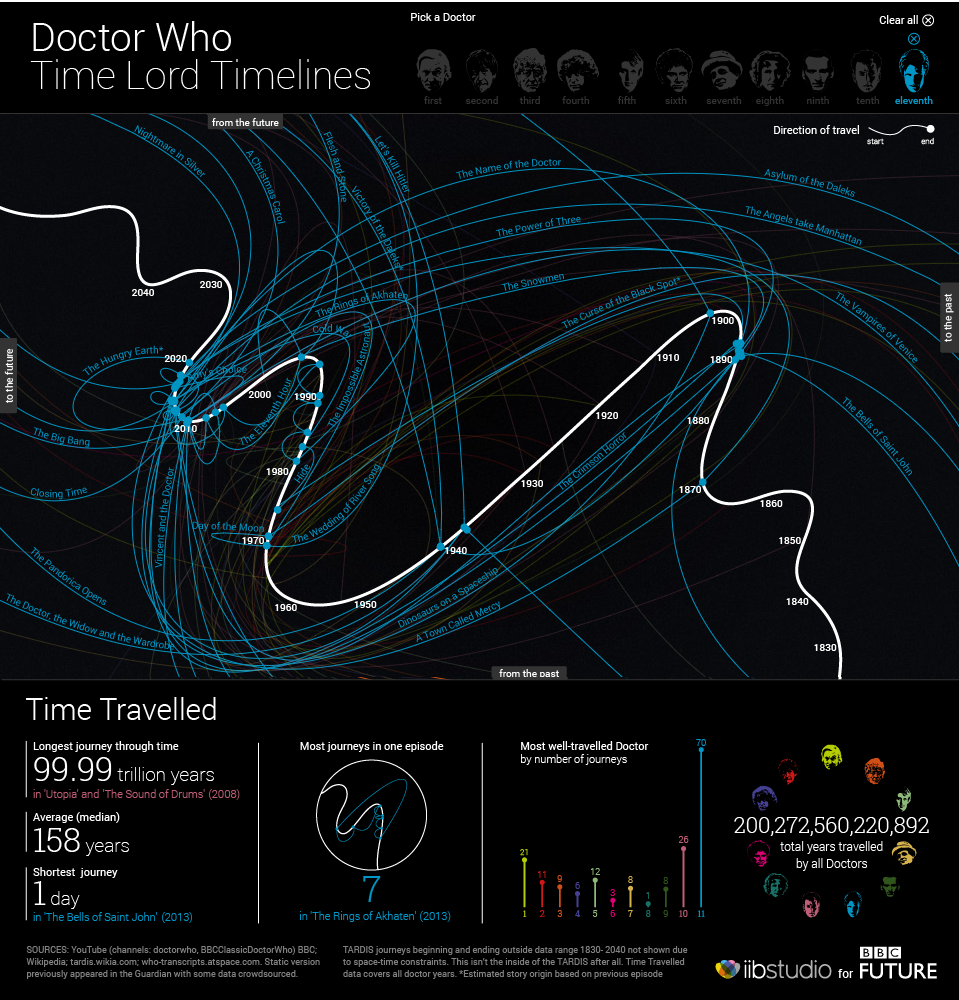
Following last week’s post about Doctor Who comes another because, since this is the last post of the week, you might as well enjoy it. This interactive graphic from the BBC looks at the Doctor travelling across time. And while you might dismiss it as being silly fun, pay close attention to the layering of timelines and the information provided in each line, i.e. click on one. Additionally, the bottom panel contains some broader context. Overall, this is a very smart piece.
The Doctor’s Travels
Credit for the piece goes to iibStudio and the BBC graphics department.
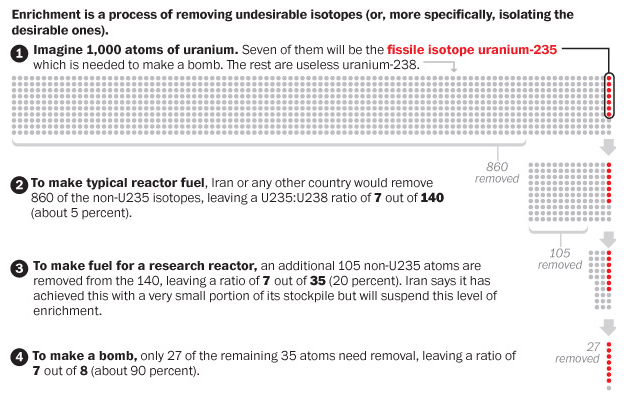
This past weekend, the US and allies reached an agreement with Iran on the Iranian nuclear programme. In this graphic the Washington Post explains the several steps necessary to take uranium and make it useful for a reactor, a research reactor, and nuclear weapons. Admittedly, a simplified diagram, but still quite useful.
Enriching uranium
Credit for the piece goes to the Washington Post graphics department.
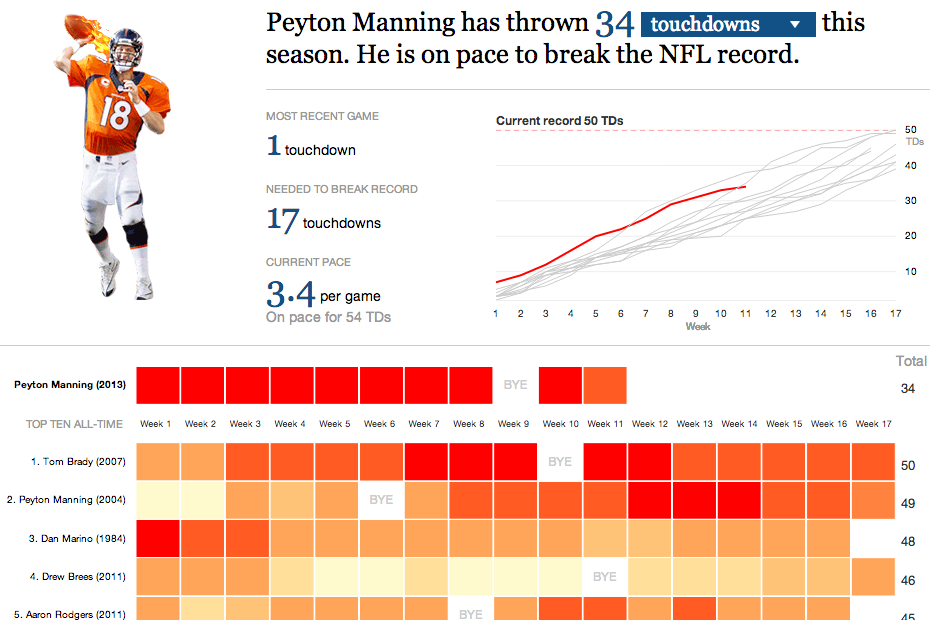
On Sunday night the Denver Broncos played the New England Patriots. The contest sported two of the game’s best quarterbacks: Tom Brady and Peyton Manning. This interactive graphic by the Guardian detailed how, in this season alone, Manning is putting up record numbers.
Comparing Manning’s stats
Credit for the graphic goes to the Guardian US interactive team.
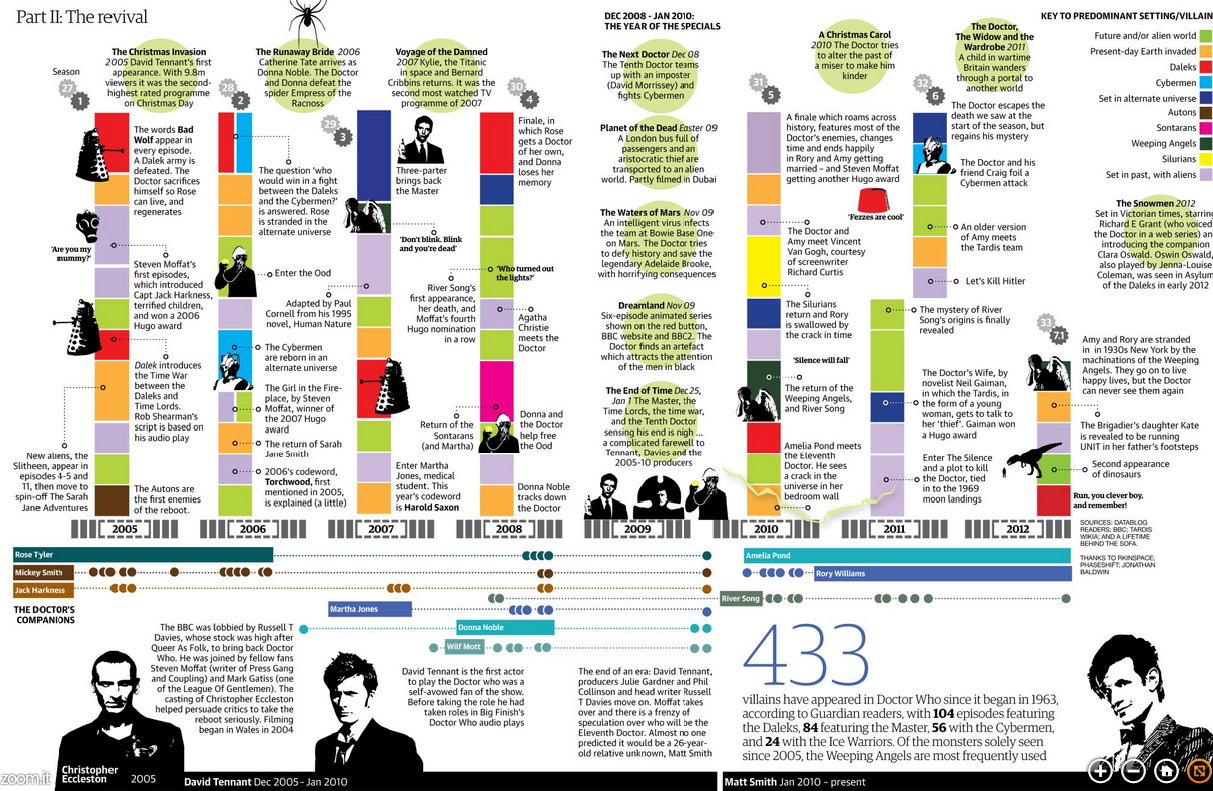
Doctor Who? Exactly. This weekend, Saturday in fact, is the 50th anniversary of British sci-fi show Doctor Who. That is not to say it has been airing for 50 years. In the 1990s and early 2000s the show was off the air, living on only in audio broadcasts and novelisations. But in 2005, the show was relaunched and it slowly began to acquire a new generation of followers. Some, like your author, have watched it in the States first via SyFy since 2006.
Still 50ish years of television about time travelling through space in a blue police box makes for lots of data. And so back in March Simon Rogers created this infographic to explain some of the history of the show.
The Guide to Doctor Who
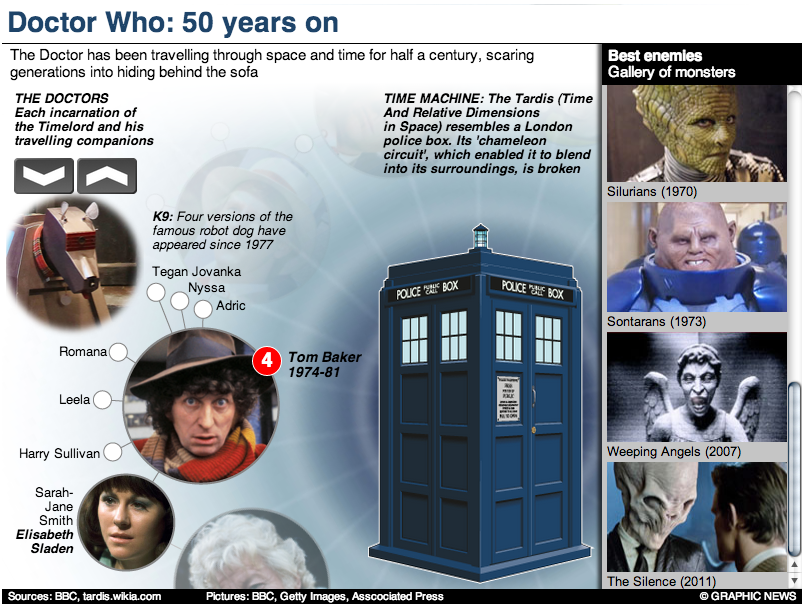
If you intend on watching the 50th special this weekend—or Monday in some movie theatres here in the States—and you want to brush up on the timeline of the Doctor and his travelling companions, the Guardian also has this graphic.
The Guardian’s gallery of Doctors
But of course the BBC, which produces Doctor Who, has a more in-depth site about the history of the character and the show. Did I mention the content is displayed within the TARDIS? I know, it’s bigger on the inside.
The BBC’s inside the TARDIS
Have you ever watched the show? Do you have a favourite Doctor? A favourite companion?
Credit for the first Guardian piece goes to Simon Rogers.
Credit for the second Guardian piece goes to the Guardian’s Graphic News team.
Credit for the BBC piece goes to Christopher Ashton, Christine Jeavans, Helene Sears, Tian Yuan, Nick Davey, and Ben Fell.
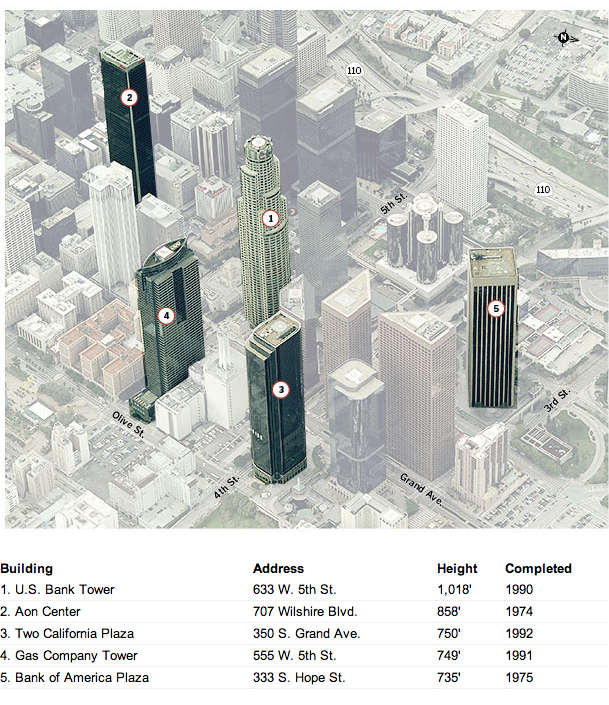
I have always had an interest in architecture. And so this piece from the Los Angeles Times is just because I like to indulge myself every so often, a look at the five tallest buildings in Los Angeles.
Map of the five tallest buildings
Credit for the piece goes to Scott J. Wilson, Matt Moody, and Anthony Pesce.
I have received a few questions in the non-blog world about why certain people have been receiving notices in the post that they are about to lose their insurance plans. The short answer for many of those people is that they likely bought individual, private plans and those plans fall short of the new minimum requirements. But, if you are not satisfied with that explanation, the New York Times does a much better job explaining it than I ever could. It is a piece worth a quick read.
The private insurance market
Credit for the piece goes to Larry Buchanan, Alicia Parlapiano, and Karen Yourish.
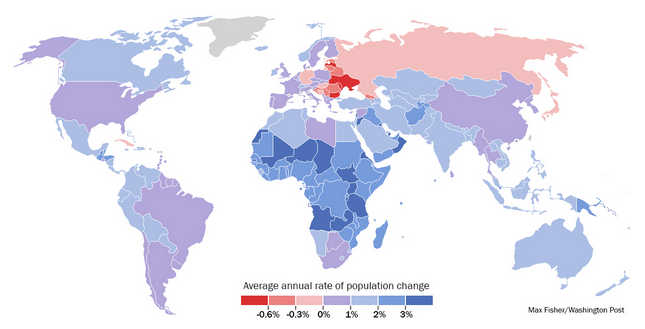
Last week the Washington Post published a piece that looked at demographic trends and their impact on the world’s different geographies. None of the graphics in the piece are revolutionary, nor are they mind-blowing fantasticness. They are, however, clear and concise and show the story. In fact the overall piece is well done because while the graphics show the trends and trajectories, the written word above and below the graphics explains some of the underlying causes and potential effects. In short, a solid piece that is worth the read.
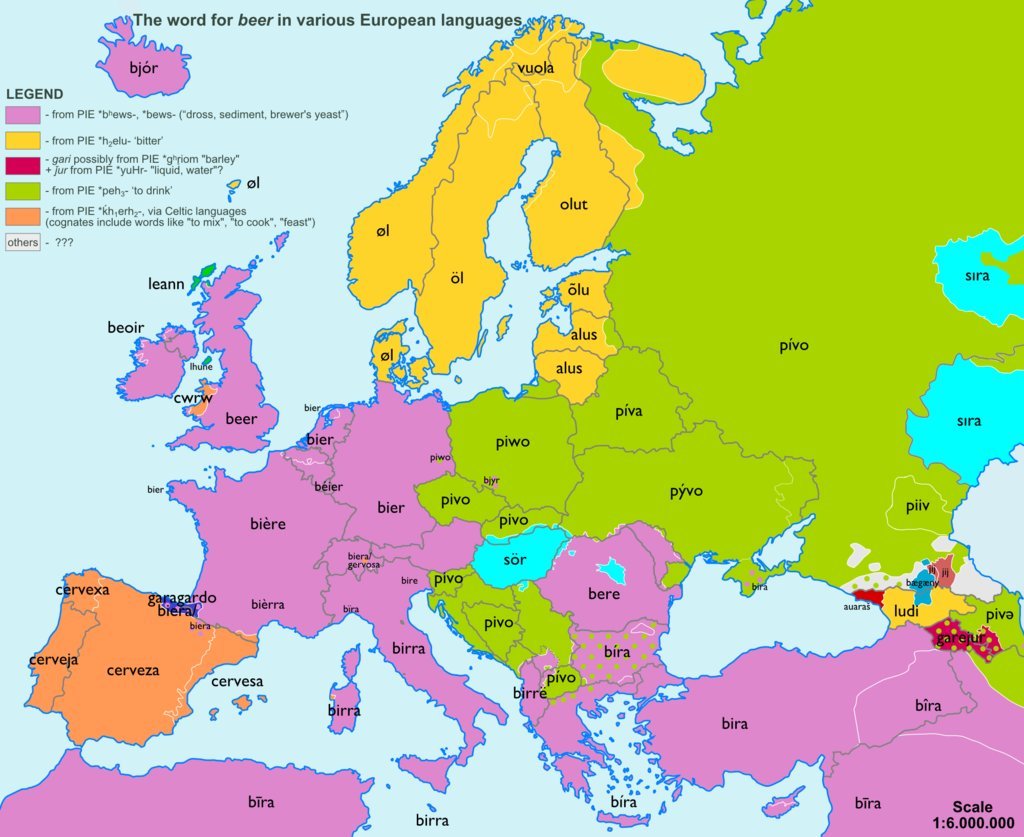
Today’s post comes via Business Insider. They linked to work by reddit user sp07 who mapped out words used for common objects across Europe and then looked at those words by their origin. But of all words, this is probably the most important.
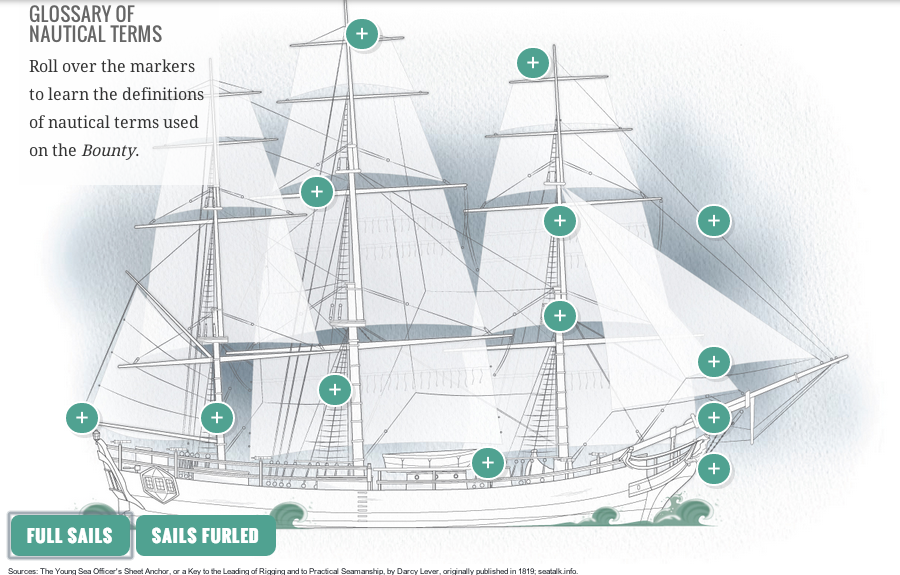
This time last year, the Northeast began to pick up what was left from Hurricane Sandy. There was a lot of rain, a lot of wind, flooding, and electrical outages. But not all the damage was ashore. In an excellent long-form narrative piece, the Tampa Bay Times covered the story of the Bounty, a functional replica of HMS Bounty from that famous story of a mutiny. This Bounty was used in the 1960s movie and had sailed ever since until it sank off Cape Hatteras, North Carolina.
A diagram of the Bounty
The piece doesn’t makes use of some charts and graphics to explain positioning and familiarise the reader with terminology. It’s a fascinating though ultimately tragic story. And like so many of these long-form pieces, the credit list is extensive.
Credit for the piece goes to Michael Kruse, Don Morris, Maurice Rivenbark, Carolyn Edds, Caryn Baird, Barbara Moch, Mike D’Andrea, Bill Duryea, Alexis N. Sanchez, and Lee Glynn.