New Data Visualisation Forms

Monday was an odd day, both 1 April and the start of baseball. I had a tough decision to make: Do I post a serious baseball-related piece or a humourous April Fool’s Day one instead? If you recall, I went for the serious baseball option. But that leaves me with Friday, where I try to post work that is a bit on the lighter side of life.

So here is EagerPies, published by EagerEyes on 1 April. It’s in the style of the EagerEyes site, a blog with posts about data visualisation. This selection is EagerPies work to improve upon Minard and the layering of data sets. But if you worry about complexity, fret not for they realised that encoding data in transparency would be a step too far.
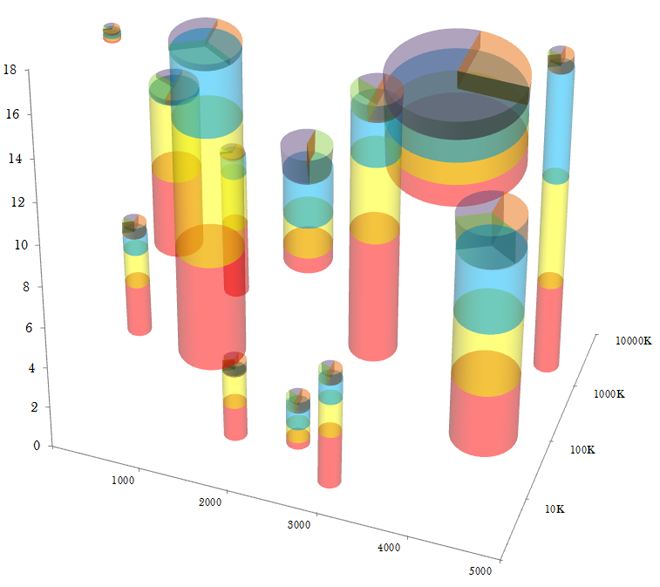
Stacked scatter column pies

Credit for the piece goes to EagerPies.

Proposed Expansion of Massachusetts Railway Network

When we talk about new rail projects, or even highway or airport expansions, we like to include maps of new routes and destinations. In that sense this map from the New York Times is not new. However, we often forget in such visualisations that we have the opportunity to add layers of information that show why these expansions are beneficial.

Proposed Massachusetts railway network expansion


Here, note in particular how the proposed improvement projects link the dense corridor of urban settlements stretching from Boston through Worcester to Springfield. Additional lines connect more distant southerly cities such as Fall River to Boston. These might normally be seen as dots at ends of a line, but by showing the density of the population in these corridors, readers can understand how the proposed lines might benefit more people than just those living at the dots.

Credit for the piece goes to the New York Times.

All Fracked Up

Last week a new study revealed that the injection of wastewater from oil drilling and fracking may contribute to earthquakes. Put simply, the theory is that the wastewater injected into the ground lubricates fault lines. And when sufficiently lubricated, the resistance between sides of the fault vanishes and an earthquake is triggered to release the tension in the fault line.

Mother Jones used an animated .gif to explain just how the process of fracking works, specifically to show the wasterwater portion. I chose this piece because it is the first .gif that I have seen attempting to use the looping animation to convey information or a story, especially as an infographic. Make sure to click the image to go the Mother Jones’ article for the animated version.

Step 2 of the graphic

Credit for the piece goes to Leanne Kroll and Brett Brownell.

The Life Expectancy Gap Between Men and Women

Today’s post comes via my coworker Jonathan and his subscription to National Geographic. The spread below looks at the gap in life expectancy between men and women in the United States. Outliers are highlighted by drawing lines to the counties in question while the same colour scale is used on a smaller map to look at historic data. And of course for those concerned about how the US places amongst its piers on the international stage, a small selection of countries are presented beneath in a dot plot that looks at the differences and averages.

The National Geographic spread
A detail of the choropleth map
A closer look at the dot plot

Credit for the piece goes to Lazaro Gamio.

Replacing Nomar Garciaparra

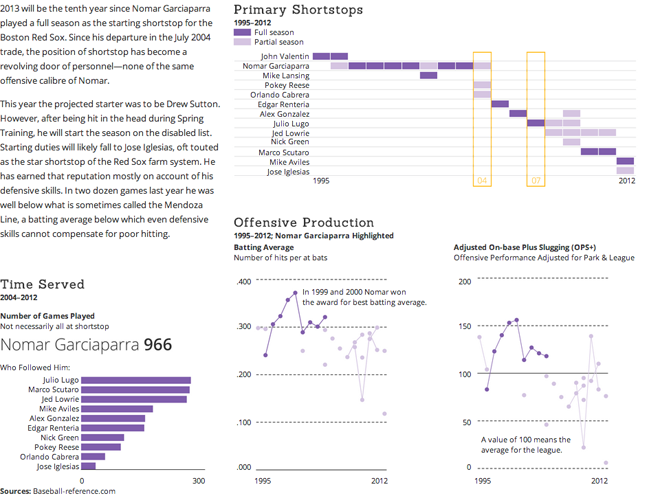
I am a fan of the Boston Red Sox and have been since 1999. The first (and sadly only) Red Sox game I saw at Fenway was the day after Nomar Garciaparra hit three home runs in one game. Two of them were grand slams. For you non-baseball folks (NBF) reading this, that is majorly impressive. Anyway, the Red Sox traded him in 2004 to acquire some pieces they needed to make a run for the World Series title that had eluded them for 80+ years (also significant for NBF). The result? My favourite player traded to the Cubs, but my favourite team won the World Series.

But now it’s Opening Day, the kickoff for the baseball season—that reference is for you American football fans. (To be fair, there was a game last night between two Texas teams, but today’s the de facto start.) Since that 2004 trade, however, the Red Sox have not had a consistent, long-term shortstop of the same offensive calibre of Nomar. How bad has this revolving door been? My infographic today looks at the shortstop replacements for Nomar Garciaparra.

Click to go to the full graphic

The Economies of Europe

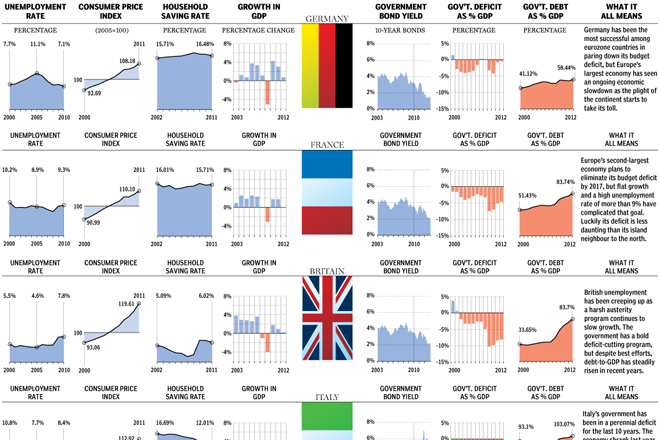
Cyprus has been in the news over the course of this past week because its financial system almost brought the country to bankruptcy. And that has meant trouble for European markets. So now it’s time to look at the economies of Europe once again. And the National Post has done a great job using clear and concise small multiples to examine key metrics for the ten largest European economies—not necessarily EU economies mind you. But at the end of each row, they summed up the country’s outlook in just one or two sentences.

Cropping of the overview for Europe's largest economies

Credit for the piece goes to Richard Johnson, Grant Ellis, John Shmuel, and Andrew Barr.

Diversity in Politics

The Republican Party has a problem. Its policy platform appeals to “angry white guys” and they are not being bred fast enough. And as the quotes indicate, that isn’t my idea. That comes from no less than Lindsey Graham, Republican Senator for South Carolina. The Wall Street Journal looks at just four states previously safely Republican that are now trending Democratic.

Diversity in Politics

Credit for the piece goes to Dante Chinni and Randy Yeip.

Women in the US Senate

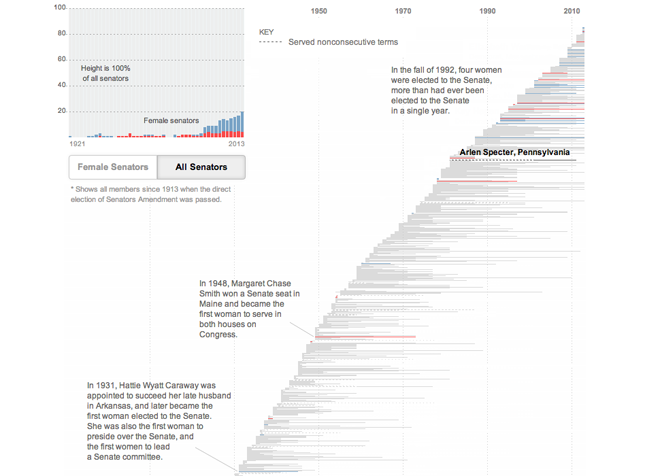
Women are half the population, but only twenty percent of the upper chamber of the United States Congress. As this great interactive timeline from the New York Times shows, at least that inequity has been narrowing over the last several elections.

The infographic comes in two main views. The first highlights women in the Senate and assigns them chronologically and then colours them by party. Important or notable senators are annotated appropriately. This view also shows the breakdown of women in the Senate at any one time in the small chart in the upper-left. Mousing over senators then provides a little bit of information about the woman in question.

Women in the US Senate

But to put it in perspective, by selecting All Senators, the user can see the whole elected history of the US Senate—remember, prior to the 1920s you did not directly elect senators. That makes for a lot of grey bars, i.e. a lot of men.

Men and Women in the US Senate

Credit for the piece goes to Hannah Fairfield, Alan McLean and Derek Willis.

March Madness Continues

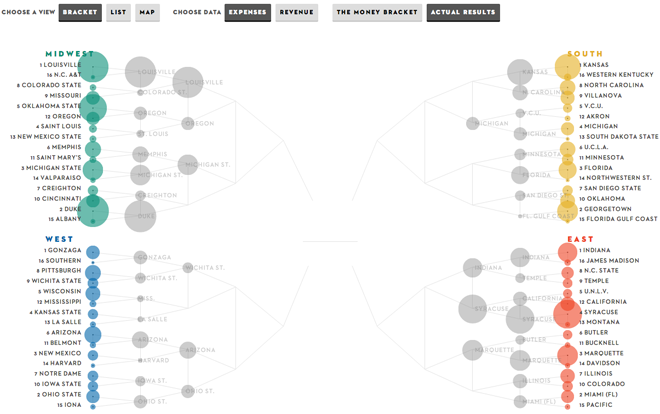
I imagined that I would be finished with posts about this March Madness thing. However, the New Yorker released its own bracket system that interested me—again, with the giant caveat that I know nothing about basketball.

To be an interactive bracket, clearly the piece needs to function as a means of following results. However, the New Yorker offers additional layers as part of the graphic: the programme’s expenses, revenues, and geographical location. Here is the expected bracket of actual results.

Current and actual results

But the first thing I realised when looking at the map is that none of the groupings make any sense. How are schools from within the same city all in separate regions?

How is LaSalle in North Philly in the West?

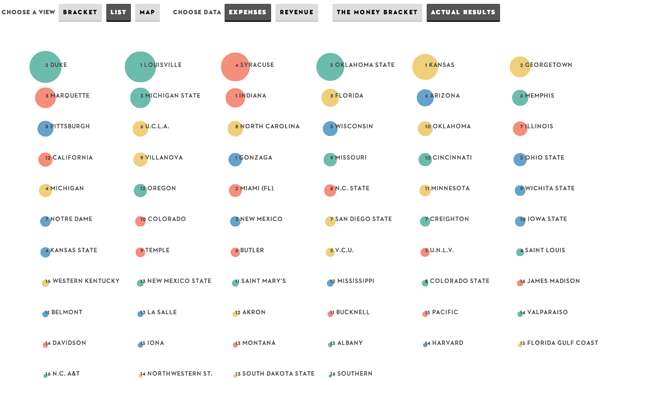
Second, the list shows you the schools ranked, again by either expenses or revenues. The encouraging thing is when you compare this to the results thus far, teams that spend very little money (comparatively) can defeat the big spenders, e.g. Florida Gulf Coast defeated Georgetown.

Show me the money! (At least who's spending it.)

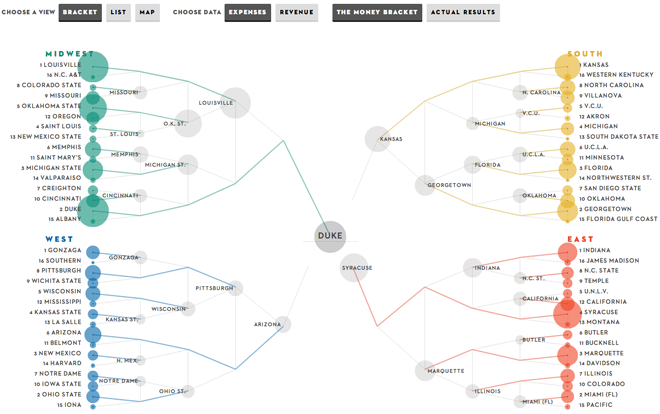
And that point of course proves that the most interesting view, the money bracket, does not necessarily hold true. Those teams that spend the most will not necessarily be victorious.

The bracket, if the team spending the most money won each game

Credit for the piece goes to the New Yorker.