The 47%

This is the year of the percentages. From 99 to 47. Earlier this week, Mother Jones revealed via a secretly recorded dinner Mitt Romney as claiming that he doesn’t care about the 47% of people who do not pay income tax. He probably meant that he doesn’t care about getting their vote rather than caring for them as people, but regardless of his intention his statement did not sound good. This 47% are people who are dependent on government, or as Romney’s vice presidential candidate would say, they are “takers”. But is this true?

The great thing about news stories and infographics is that as time progresses, one has more opportunities to find data to back stories and arguments. The day of the breaking news, CNN published this simple pie donut chart. Crude, but given the breaking news it is effective.
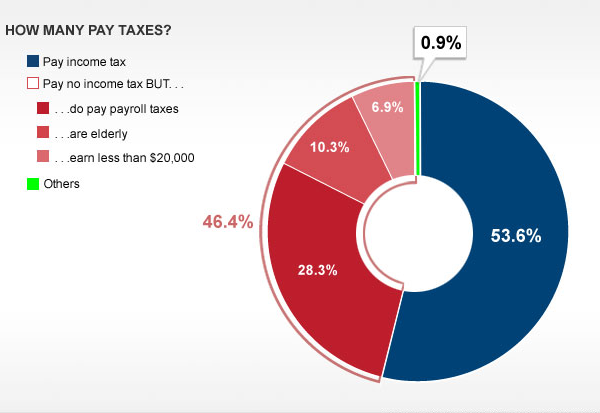
Federal Income Tax Payers

It proves that Romney was correct, that 47% of people do not pay income taxes. But, it also proves that Romney was at best glossing over the details or at worst manipulating the people listening into thinking that 47% of people do not pay taxes. It may be only 0.9% of Americans who do not pay any taxes. Furthermore, retirees and young people often do not earn income with which to pay taxes. If retired senior citizens are “takers”, I suppose Romney does not want the elderly vote so often important to the Republican base.

But news stories evolve and more statistics become available. A few days later, the New York Times published a longer infographic piece, with below a cropping of the overall.
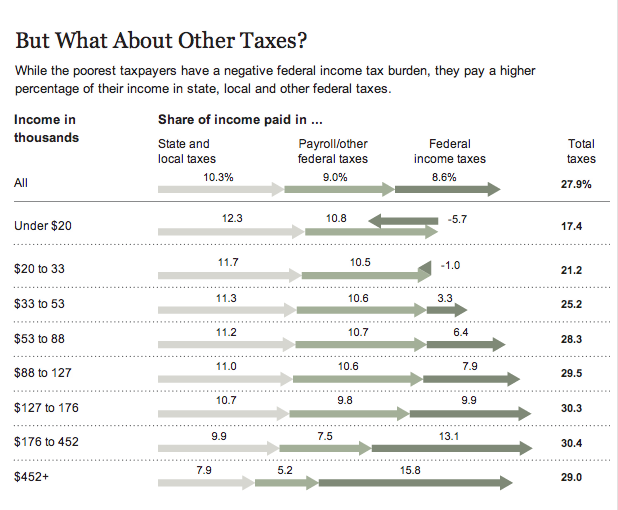
The Tax Burden by Income Group

It expands upon the nature of the story and breaks down the actual tax burden of the American public. It is far more nuanced that Romney stated back in May (the original recording of the video). The poorest Americans do not pay federal income taxes, they have the Earned Income Tax Credit (EITC) that is designed to deal with poverty, especially amongst families with children. It is, very simply, what one would call a tax credit incentivising work. The poorest Americans, however, still must pay payroll taxes and then state and local taxes. In percentage terms, the poorest Americans pay more to their states and local governments than do the wealthiest Americans, who in turn have the greater burden at the federal level. It is worth noting that many government programmes, local schools for example, are often funded at the state and local level.

The problem with Mitt Romney’s argument on taxes is that he wants to cut taxes at the highest income brackets and cut the social safety net programmes for the lowest brackets. We already have evidence that such policies do not correlate with economic growth. They instead correlate to a worsening gap between the wealthy and the poor. Think the 1920s rather than the 1950s, 60s, and 70s.

Tax policy is worth discussing. It is worth debating. But we should do so on the facts. I cannot recall the politician who spoke these words, but as someone once said, “you are entitled to your own opinion. You are not entitled to your own facts.”

Credit for the pieces go to Susie Poppick (CNN) and the New York Times.

A Week of Unrest Across the Middle East

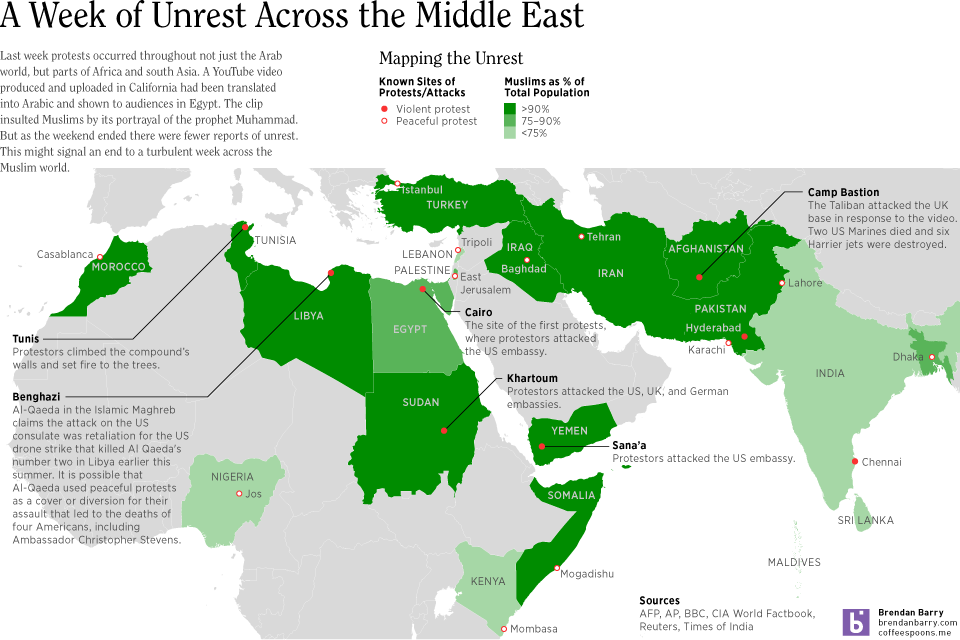
Over the last week a video clip on YouTube that mocked the Muslim prophet Mohammad sparked unrest across the Muslim world, from Morocco to Bangladesh and from Turkey to Kenya. While most of the protests were peaceful, a few were not. In Libya, the US consulate in Benghazi was attacked—in circumstances still not entirely clear—and four Americans were killed, including the US ambassador, Christopher Stevens. In Khartoum, Sudan, the embassies of the US, the United Kingdom, and Germany were all attacked. While in Afghanistan, the Taliban successfully attacked the UK’s heavily fortified base of Camp Bastion, nearest to Kandahar, killing two US Marines and destroying six Harrier jets.

Combing through several news sites, including the BBC, AP, and Reuters among others, I mapped where protests occurred and sought to show how much of that country’s population identifies as Muslim. Most nations were, not surprisingly, heavily Muslim. But several countries with rather small Muslim populations such as Kenya, Sri Lanka, and India also hosted protests, some violent. Not included, because of the difficulty in changing the map, is Australia. Sydney experienced protests nearing rioting as protestors marched.

Click the map for the full-sized view.

Map of Muslim Unrest; click for the full-size view

Canadian Tradin’

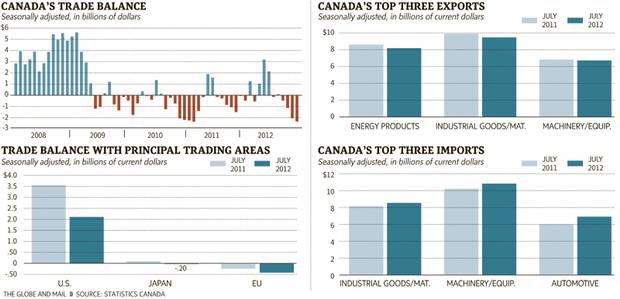
The Globe and Mail of Canada published an infographic that where I work would probably be called a datagraphic. It presents data in a graphic fashion without a lot of context or conclusions that turn data into information. The piece in question looks at Canada’s balance of trade, i.e. how much it imports from other countries vs how much it exports to other countries.

Canadian trade
Canadian trade

While I appreciate the goal of the overall piece and fully understand that it may have in fact first lived in the print edition, the version shown on their website feels too large for the few data points contained within the graphic. The bars on the right and beneath the timeline are far too wide. The sections could likely have been condensed into a smaller, more compact space that would have given more visual weight to the timeline that clearly tells the story of a more volatile trading period for Canada since the global recession of 2008.

I also would probably change the chart type or simply look at a different data set for the trade balance with principal partners because the data for Japan barely registers. And while the other data can be seen, the minor differences are difficult to read. I would probably shift the emphasis from the actual dollar value of exports and imports to the percentage growth (or decline) of each over the last year.

Ivory Trade

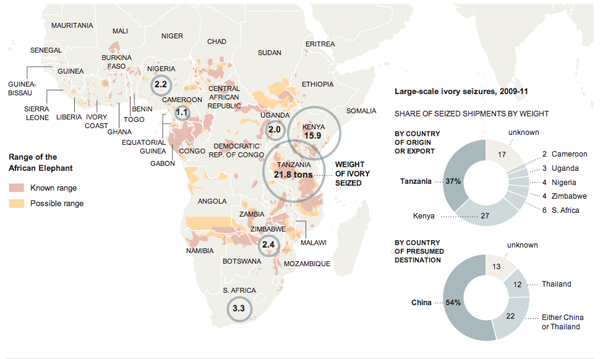
This graphic from the New York Times looks at the illegal ivory trade out of Africa and into, primarily, the markets of Asia. I think the map works fairly well in showing why certain countries are centres for the illicit industry. But the two donut charts integrated into the graphic as part of the Indian Ocean are a bit weaker.

Ivory trade
Ivory trade

My main problem is that the shares are a bit difficult to distinguish as arcs, especially when looking at the export countries. But the second chart with the import markets does work a little bit better. In this case there are really only three markets: China, Thailand, and Others. But the chart contains the ambiguous China or Thailand. So in theory, that demarcation could fall anywhere between China and Thailand—a point harder made if comparing simply by bars. This means that the chart really is looking at China vs Thailand that combine to 87% vs. Others. The trick is finding the break between China and Thailand. Is this chart perfect? No, but in this case I think it an acceptable use of the donut—though I likely would have treated it a little bit differently to emphasise that point.

Made in the USA. Exported to Mexico.

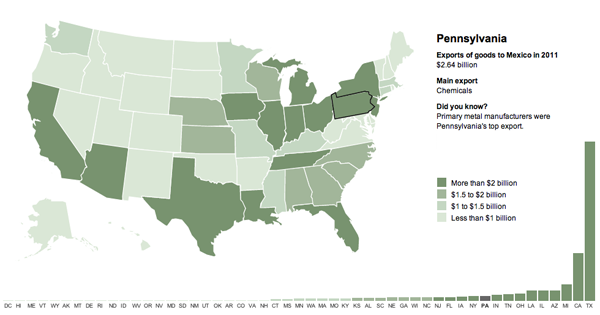
We trade a lot with China. Everyone knows that. But people might not realise that both Canada and Mexico are also among our largest trading partners. (I suppose it helps that they are both right next door.) Mexico is the second-largest importer of US goods after Canada. (China is third.) The Washington Post looked at which states are exporting the most to Mexico and what their largest exports happen to be.

Exporting to Mexico
Exporting to Mexico

Credit for the piece goes to Wilson Andrews, Emily Chow, and Bill Webster.

Revising the Jobs Reports

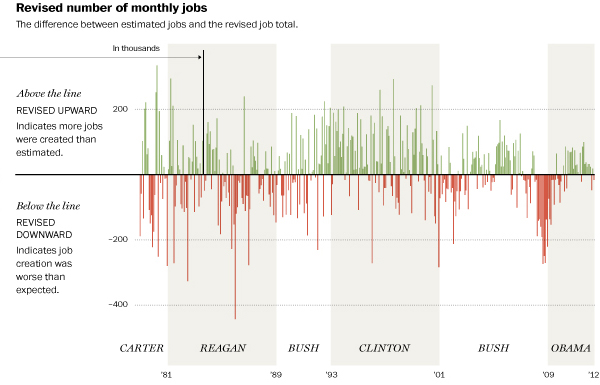
Last Friday was the jobs report for the month of August. And it was not as high as economists had expected. The problem is that the initial report is often inaccurate despite the fact we make such a big deal about the report. So the Washington Post looked at the revisions that take place in the months afterwards. Yeah, the initial reports are not so accurate.

Revising the Jobs Reports Numbers

The first two sets of charts (not shown above) look at the initial versus the revised numbers. The third (the cropping above) looks at the difference between those figures. The result is that the first few years of President Obama’s presidency created more jobs than expected but that the last two months have seen worse-than-expected job creation. I would be curious to see how this correlates to the end of the stimulus plan, but I imagine it would be difficult to link that to the jobs reports.

Credit for the piece goes to Todd Lindeman.

Climate Change

When I was younger—albeit not by much—I applied my interests in geography, history, and politics to create maps of fictional places. I used knowledge of things like the Hadley cell and the Koppen climate classification system to figure where on the maps I drew people would be able to live in temperate climates and where nobody could live because it would be an arid desert. I also read encyclopedias growing up, so go figure.

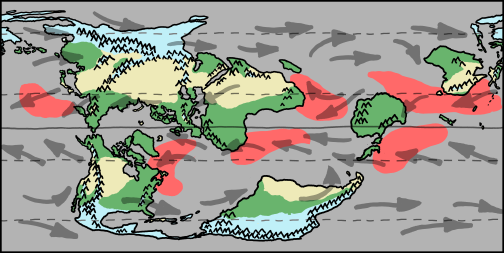
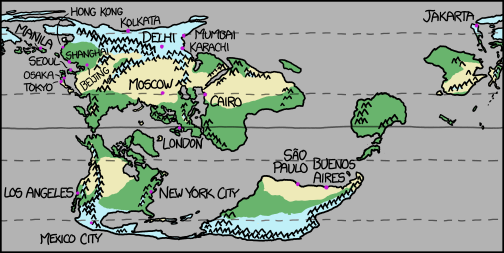
But I never bothered to apply my amateurish interest in geography and climatology to Earth. Rather, to an alternate Earth. But Randall Munroe over at xkcd did take a “what if” about a rotated Earth’s surface and investigated what would be the results. Of course he is also not an expert and even after thousands of years of living on this planet, humanity has yet to figure out all the variables that determine climates. But he gave it a shot. And he explained how it works (in theory). The result is called Cassini.

Climate of Cassini
Climate of Cassini

Blue is cold; think Siberia. Green is temperate; think rain and trees and, well, green things. Yellow is arid; think deserts. Red is hurricane zones—appropriate for summer. Think, well, hurricanes.

Cities on Cassini
Cities on Cassini

Turns out Philadelphia would still be a great place to live. Just saying.

How Has the Republican Party Changed

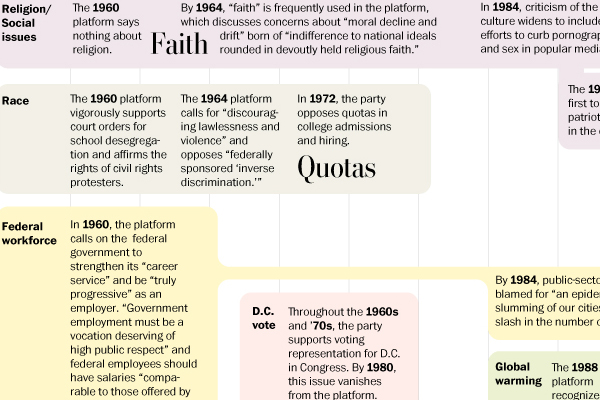
Yesterday I shared an infographic looking at the demograhics behind the evolution of the Democratic Party—and by comparison the Republican Party. Today is the Washington Post’s infographic on the evolution of the Republican Party’s policy platform. Since the 1960s the party has shifted from a socially liberal agenda coupled with fiscal conservatism to an extremely conservative social agenda and an even more fiscally conservative platform. (For example, one wonders if the Tea Party remembers how the great conservative in Ronald Reagan raised taxes because it was how to generate increased revenue?)

An evolving GOP platform

Credit for the piece goes to Marc Fisher, Laura Stanton, and Karen Yourish.

How Has the Democratic Party Changed

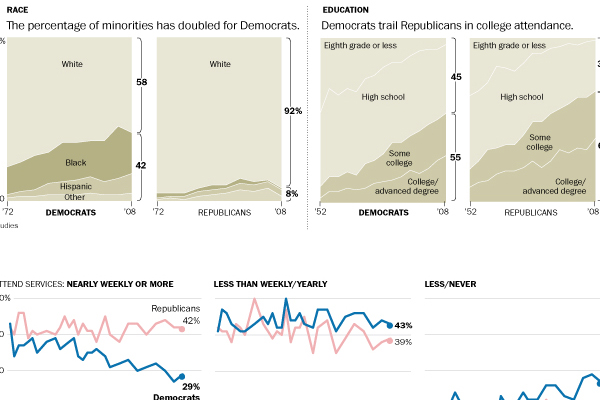
This past weekend the Washington Post published an infographic looking at how the Democratic Party has demographically changed over time and compared those changes to those in the Republican Party. The piece is large, but shows some interesting trends particularly with the racial diversification of the political parties—or lack thereof. It is an important trend when considering the white population is growing at much slower pace than minority groups.

Democratic Party trends