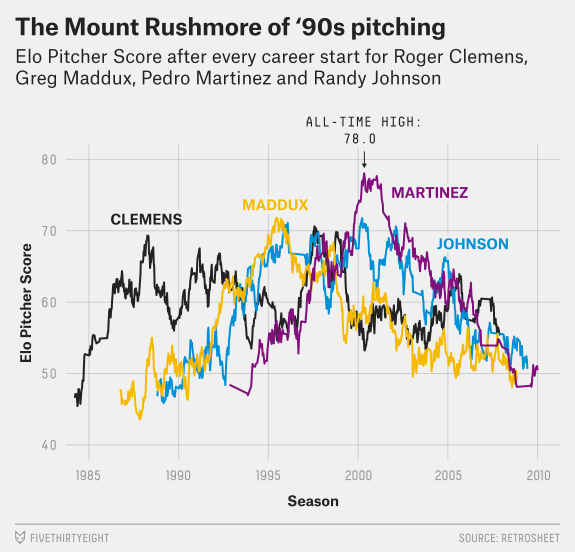
Last week FiveThirtyEight posted a nice article about the best pitchers in baseball. Turns out Pedro Martinez rates pretty highly among them. The late 90s and early 00s were great for Red Sox pitching.
Pedro was great
Credit for the piece goes to Neil Paine and Jay Boice.
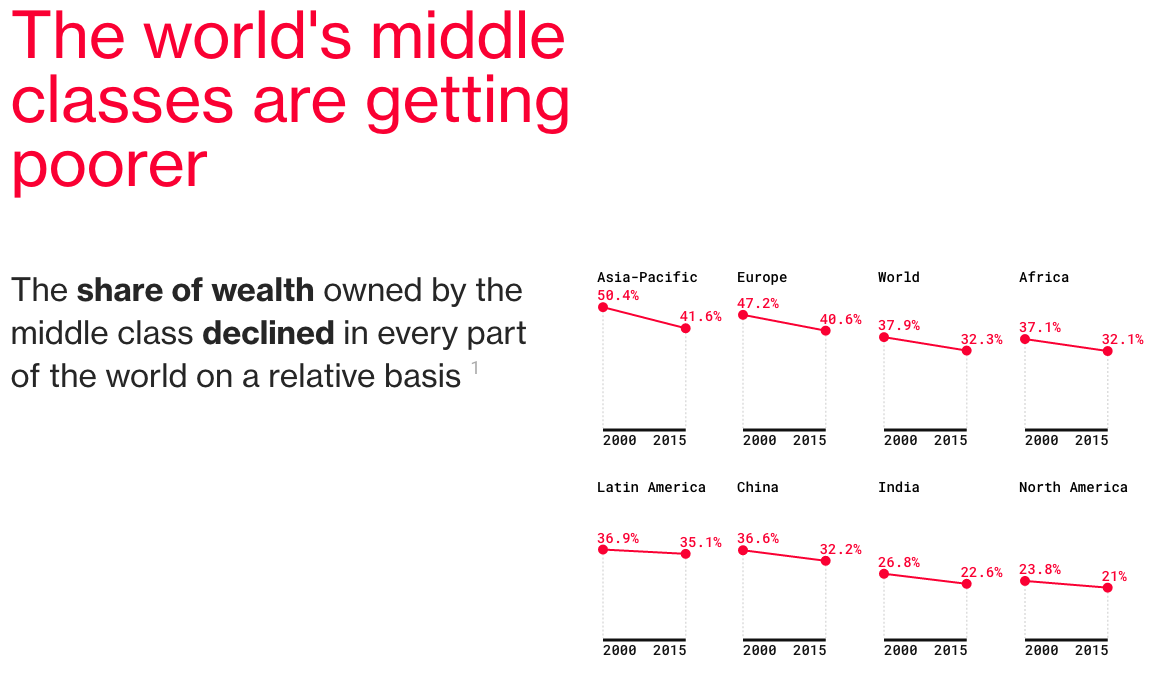
At least relatively speaking. Today’s post is a Bloomberg article comprised primarily of charts with pithy titles summarising the data story. If listicle is a word for articles consisting of the Top-10 things about [whatever], do we start embracing charticle as the word for chart-driven stories? Even if we do, we should take note that this piece was not the work of one person, but four.
The Middle Class’ share of wealth
The story captures my attention to and dovetails nicely into yesterday’s piece about a possible electoral path for Donald Trump to take the White House later this autumn.
Bonus points for the responsive nature of the post.
Credit for the piece goes to Andre Tartar, Mira Rojanasakul, Jeremy Diamond, and John Fraher.
Well Happy Friday, everyone. Today’s chart is a serious subject: the (brief) recovery of the S&P 500. But because this is Friday, take a look at the annotations on the chart.
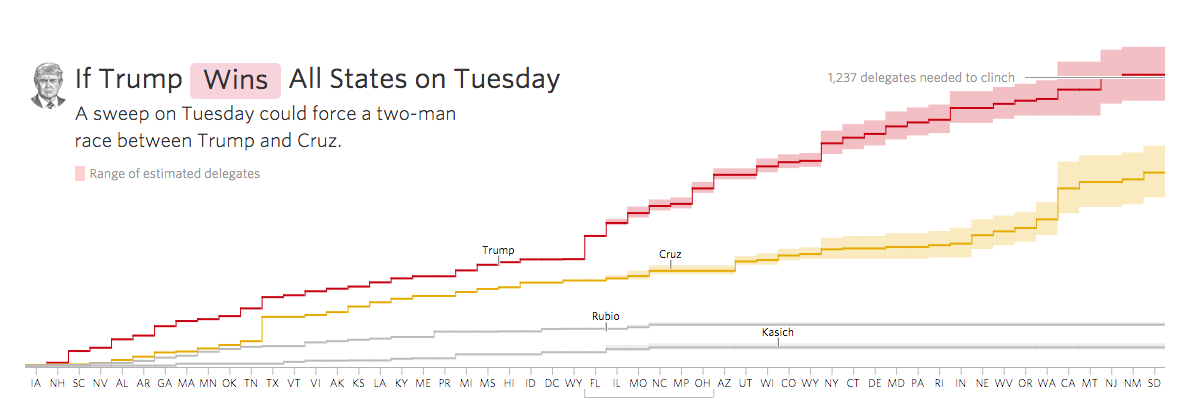
Well, here’s another Tuesday so here’s another election day. Today we have an animation from the Wall Street Journal that succinctly shows how important this evening’s results are for Donald Trump. If he wins everything, his path to the nomination is easier, if not, it is doable, but far from easy. That sounds obvious, but it contrasts with other candidates who, if they lose, no longer have a chance.
Trump’s route to the nomination
The really nice bit about this piece, however, is that at the end you can make your own predictions for each state and see how that impacts the delegate count.
Credit for the piece goes to Randy Yeip and Stuart Thompson.
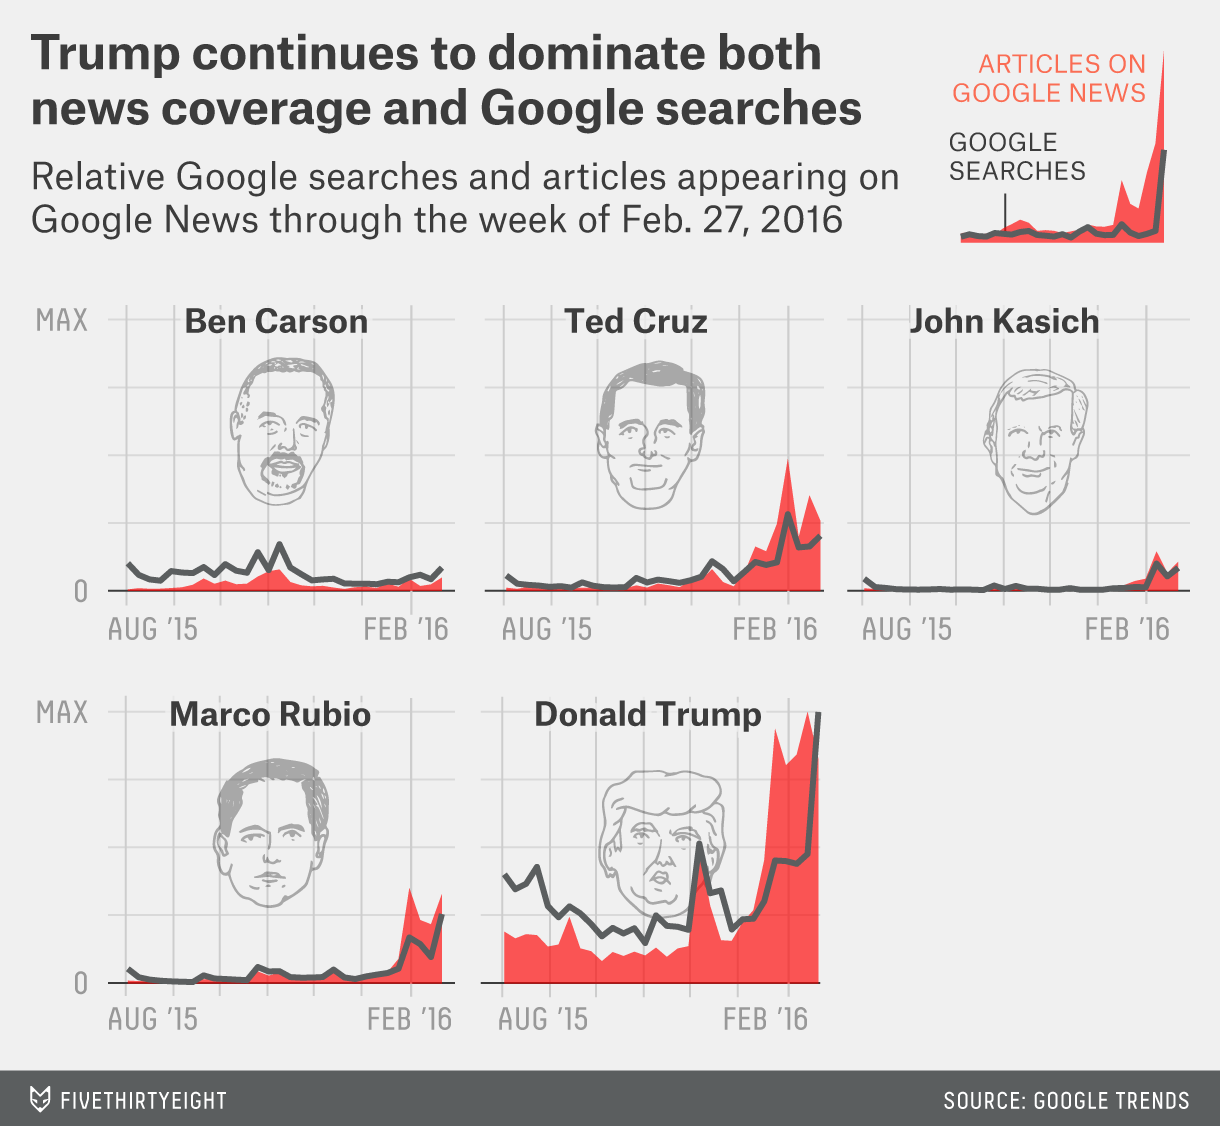
Well, Super Tuesday is over. And if you spent last night under a rock, Donald Trump and Hillary Clinton cleaned almost enough house to brush away their competition. Almost. The political analysis begins…now. But we will leave that for another day. I liked this one particular chart from FiveThirtyEight’s coverage.
Media coverage
We have a nice set of small multiples—please kill the cute illustrations of the candidates’ heads—comparing the number of items in Google News and Google Searches. The graphic goes a long way in showing just how much coverage Trump has received over the past few months against very little for others.
Credit for the piece goes to FiveThirtyEight’s graphics department.
Sorry for the two-week absence, everybody. I travelled to the UK for work and then stayed there and Ireland on holiday. But I have returned, but with the inevitable jet lag waking me up early this morning, I had no reason not to post something.
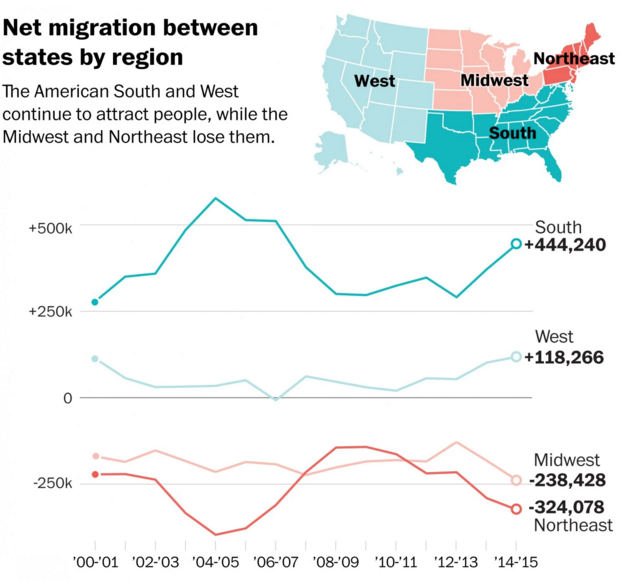
Late last year, the Washington Post published a small article examining trends in US migration data. The crux of the article? During the recession, people stopped moving from the Northeast and Midwest to the Sunbelt. (I was a rare exception heading from the Northeast to the Midwest.) But, now that the economy is not so sluggish, that movement of people has resumed. Naturally, there are charts to go alongside it.
Migration between regions
I selected the above because while generally fine, I quibble with one design decision. In the locator map in the upper right, take the South, which is coloured dark green for a winner in the game of migration. However, in another map earlier in the piece, Mississippi, Alabama, Louisiana are all losing people. I likely would have left the white states lines off the map. Or reused the same earlier map, but with a thicker stroke to indicate the US Census Bureau regions.
It’s Monday, folks. And for most of us that means going back to work. Which means dressing appropriately. And that’s about as far as I’ve got introducing this subject matter, because I wear a dress shirt and tie everyday. Not a t-shirt. But we’re talking t-shirts. Specifically their sizing.
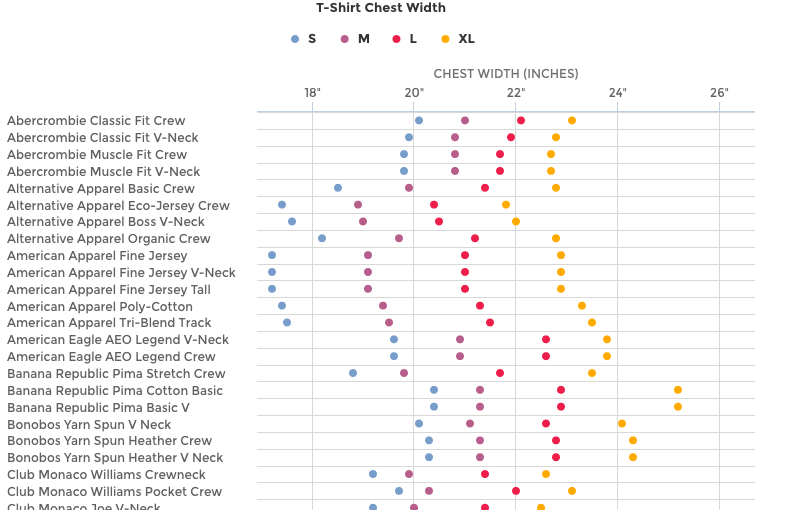
Threadbase is a New York startup looking to do some cool things with data about t-shirts. But that requires having data with which to play. And they are starting to do just that. Their opening blog post has quite a few data visualisations.
Comparing actual sizes via a dot plot
The dot plot above charts the sizes by dimension for various brands and makes. I might quibble with the particular colours as the red and purple are a bit on the difficult side to distinguish. Symbols could be away around the issue. But the only real issue is that on my monitors the full image runs long and I lose the reference point of the actual dimensions in inches.
But the piece is worth the read for the cyclical changes in dimensions.
Mostly it’s just a pity that I’m not a jeans and t-shirt sort of guy.
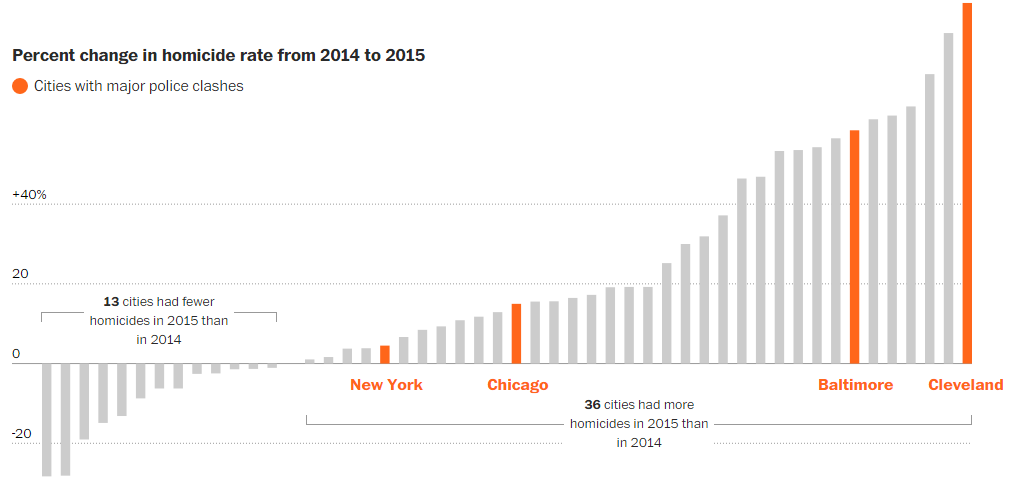
Today we look at a really nice piece from the Washington Post on urban homicide. It combines big, full-width images that use interactivity to promote exploration of data. But as you can see in the screenshot below, the designers took care to highlight a few key stories. Just in case the reader does not want to take the time to explore the data set.
The growth rate is an interactive piece
But the piece uses scale to provide contrast throughout the article. Because in addition to the three or four big graphics, a similarly well-thought-out and well-designed approach was taken towards smaller, inline supplemental graphics. Here is an example about the homicide rate for New York.
New York’s homicide rate as an inline graphic
What I really enjoy about these small graphics is the attention paid to highlighting New York against the background averages provided for context. Note how the orange line for the city breaks the grey lines. It is a very nice detail.
Overall, this is a really strong piece marrying written content and data visualisation.
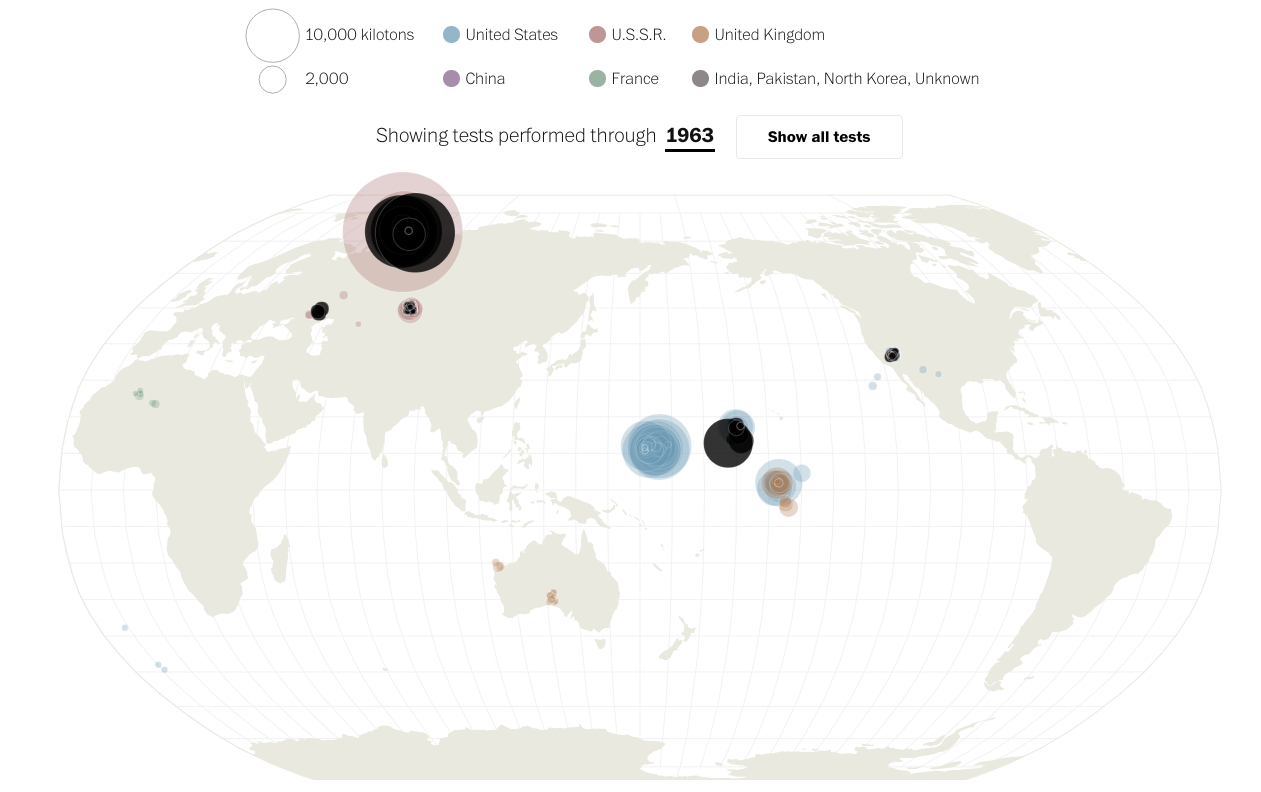
Last night, in the States’ time at least, North Korea purportedly tested a hydrogen bomb. How does this differ from their previous tests? Well, those were all nuclear fission bombs, this is a nuclear fusion bomb. (Admittedly, I am simplifying a lot here.) Hydrogen bombs, the H-bomb, are more powerful and more efficient in that they emit less radiation. They are still pretty bad news, though. That bit has not changed.
Anyway, the Washington Post put together a nice piece about nuclear weapons testing. The big feature piece is a map of test sites over time. What I really like about it, however, is that they chose to split the world at a different point—the Pacific Ocean opposite the Prime Meridian. I have occasionally argued for using such maps more often given the increasing relevance of Asia and the relative decline of Western Europe. So it is nice to see it put to good use here.
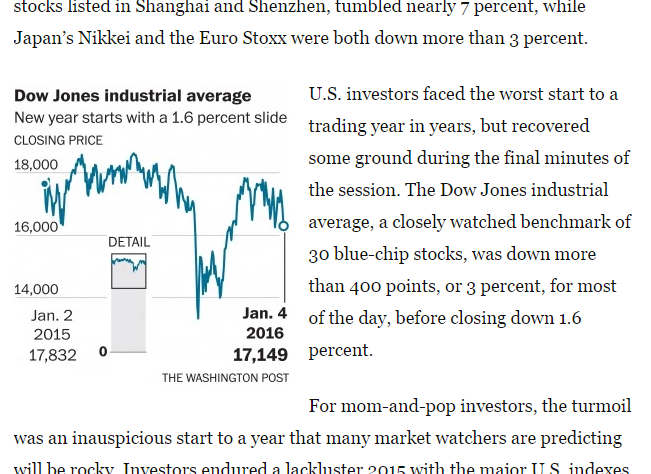
Today we are looking at a smaller piece from the Washington Post. The graphic fits within an article about US stock prices. What the graphic does is show the total scale, i.e. starting the chart on the 0 axis, and then showing in detail the fluctuations near the maximum end of the scale. And yet all of this done as an inset graphic. It need not be a full-width graphic, because the data does not demand it.
The chart is in the details
Credit for the piece goes to the Washington Post graphics department.