Carbon Emissions

President Obama announced new regulations to be enforced by the EPA that aim to reduce carbon emissions. Principally, the expected reduction will come through state-by-state measures to meet new federally mandated targets. Each state will have the ability to find different means of achieving the cuts, e.g. building more solar plants or nuclear plants or implementing cap-and-trade schemes.

Consequently, the New York Times published this interactive graphic that examines the carbon emissions and energy prices of states. The charts default to a highlight of several Northeast states already participating in a cap-and-trade scheme. The top component charts emissions on a per unit of energy over time while the bottom charts the price of energy.
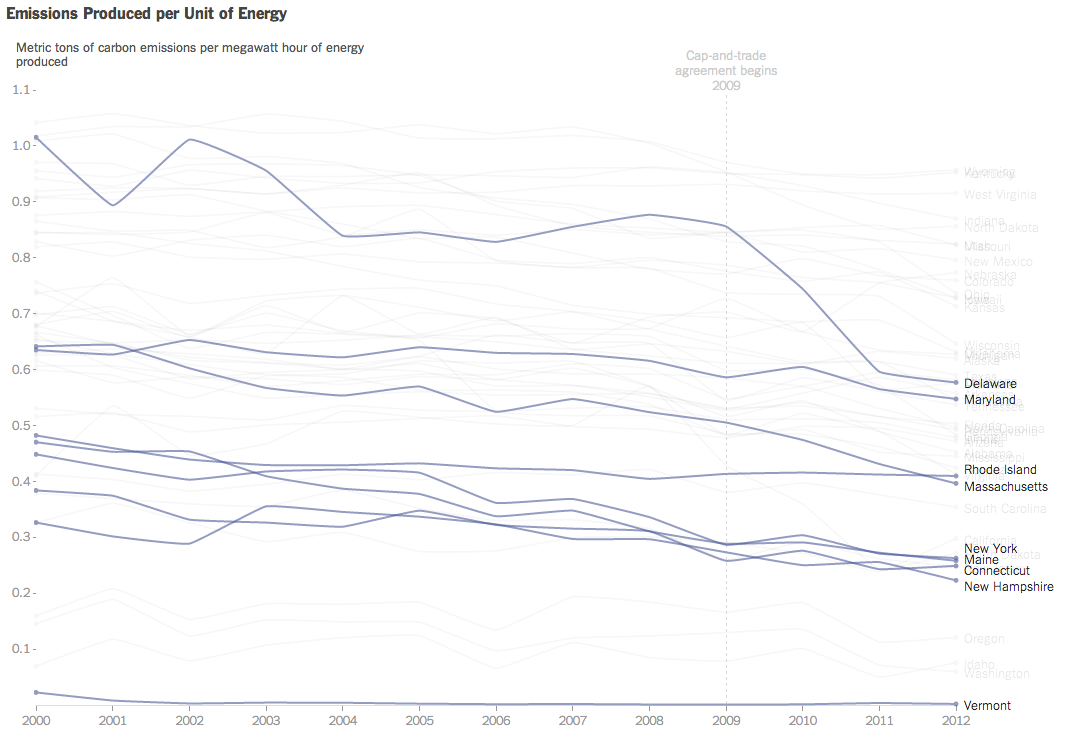
Carbon emissions over time

Credit for the piece goes to Hannah Fairfield and Derek Watkins.

How Africa Tweets

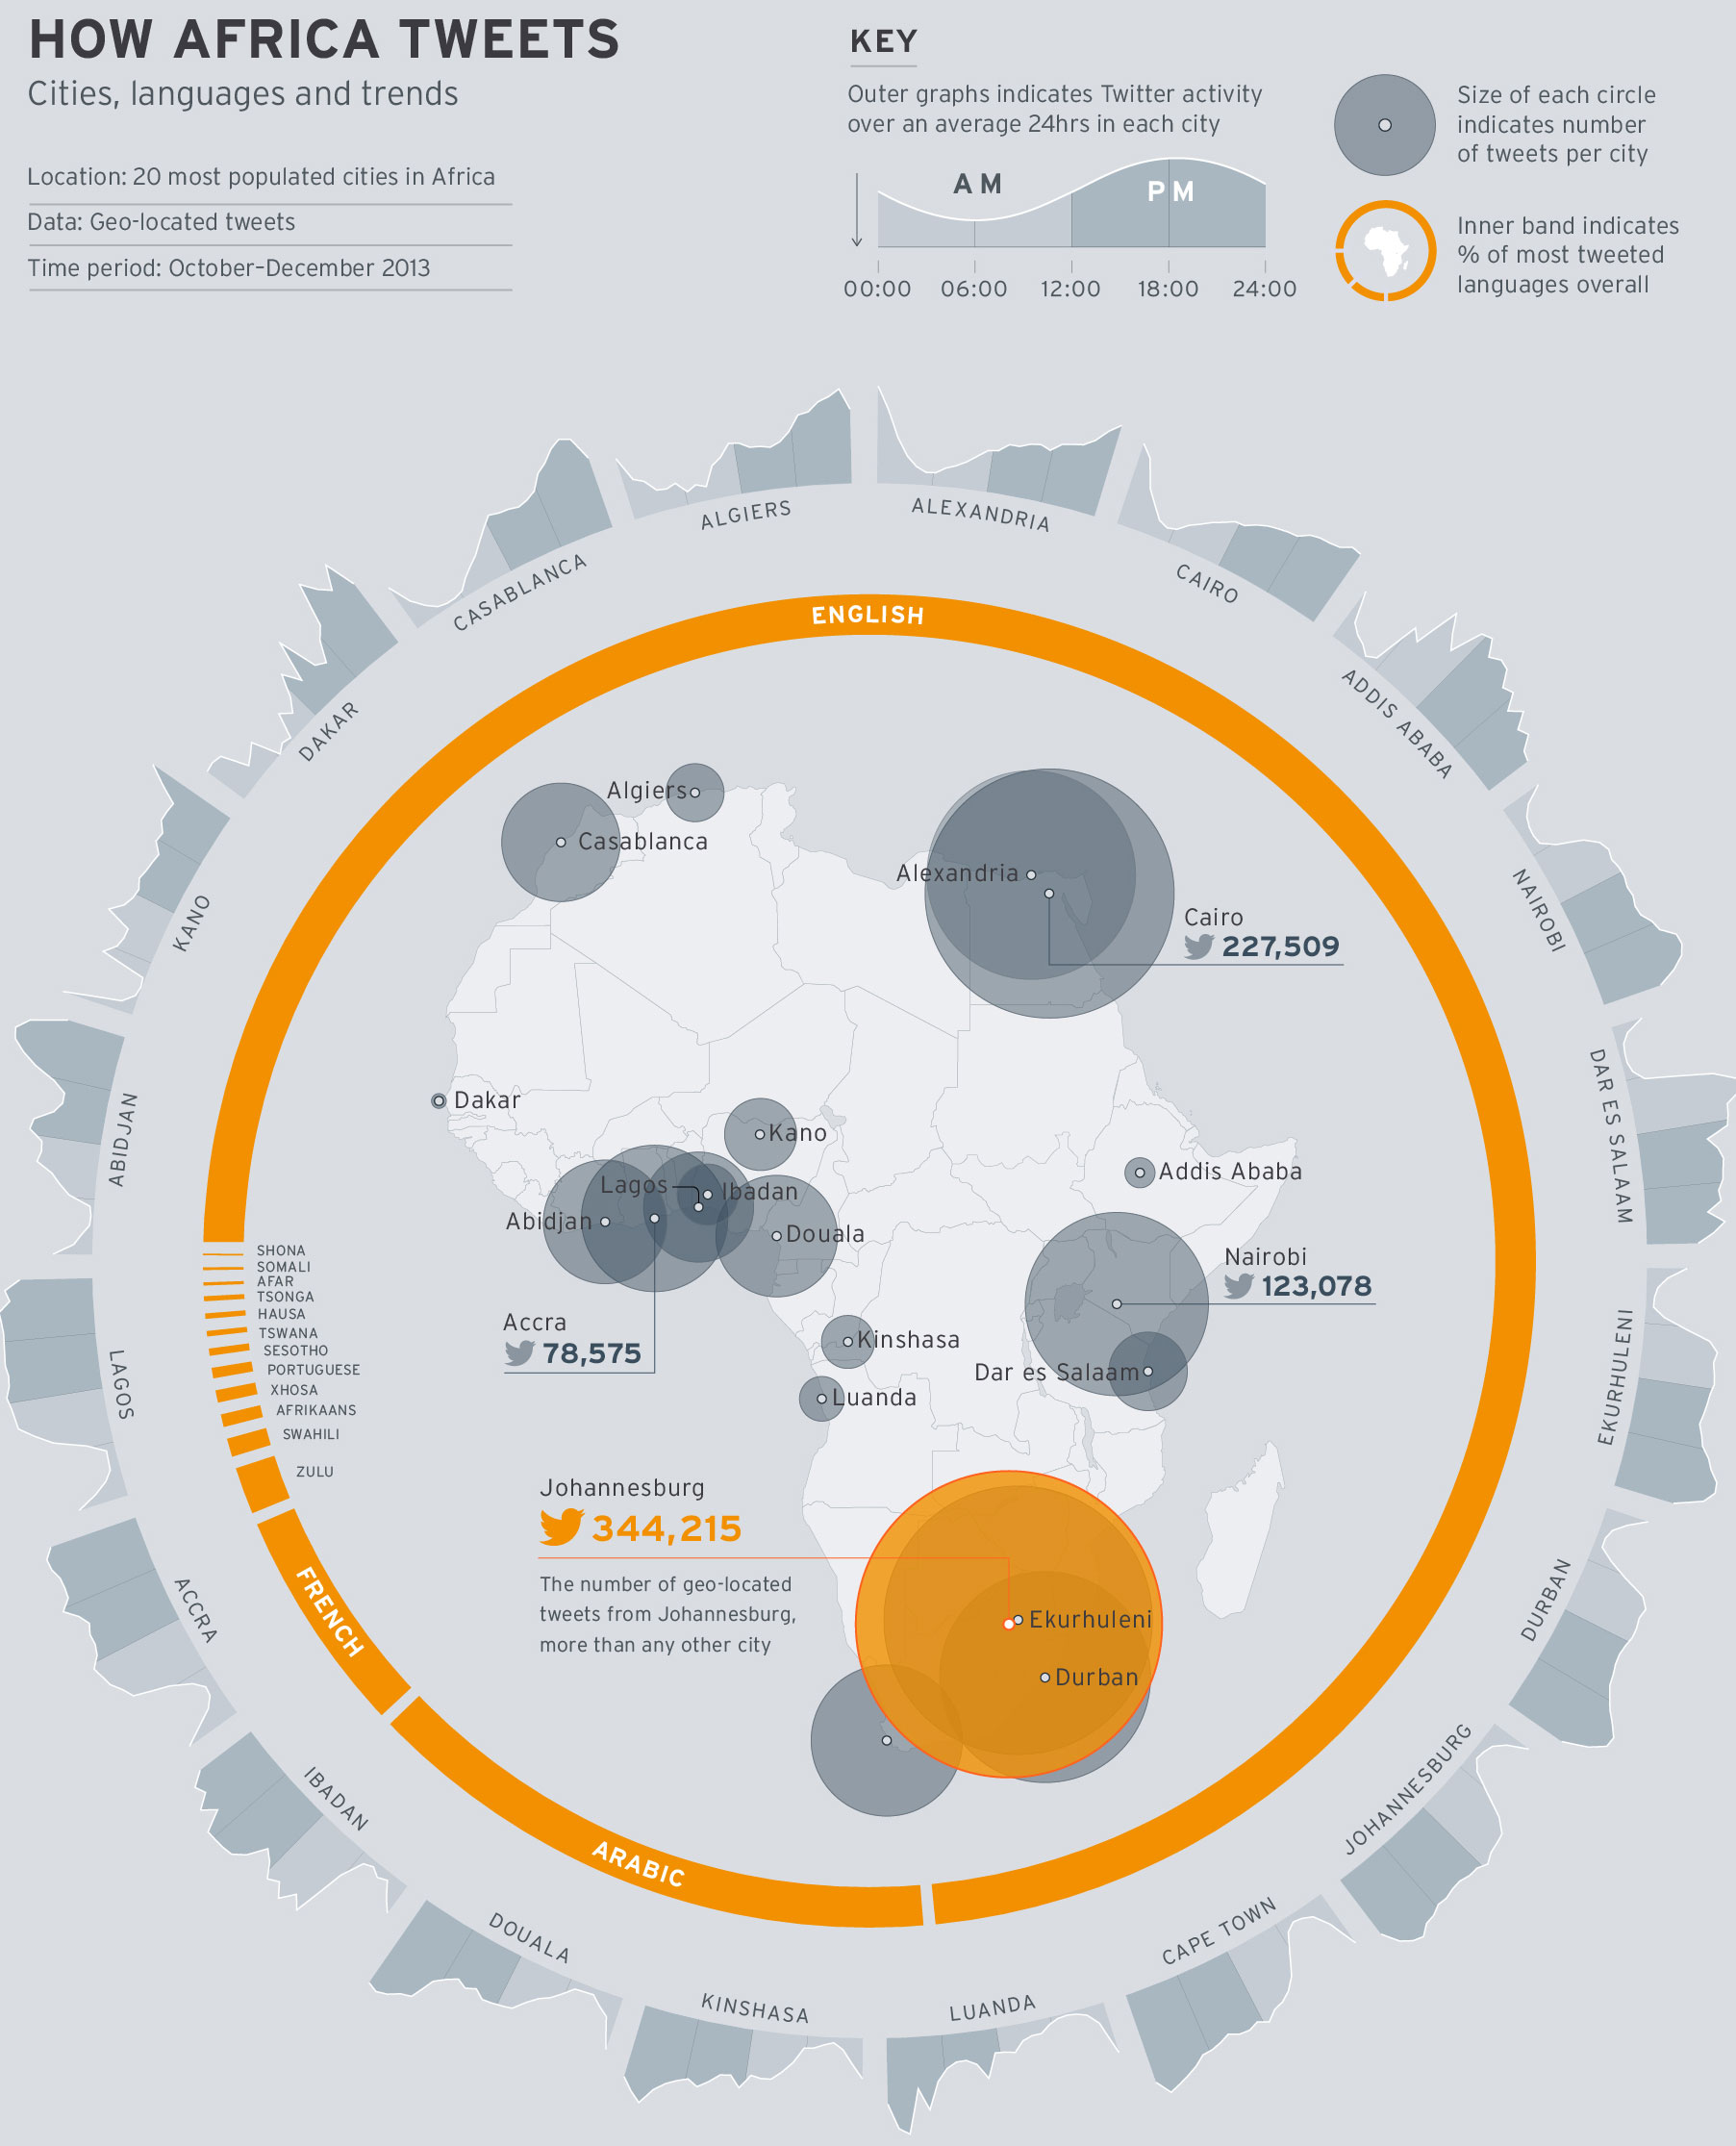
Today’s piece is hit and miss. It comes from the World Economic Forum and the subject matter is the use of Twitter across Africa. I think the subject matter is interesting; mobile communication technology is changing Africa drastically. The regional trends shown in the map at the core of the piece are also fascinating. Naturally I am left wondering about why certain countries. Does spending on infrastructure, GDP per capita, disposable income levels have any sort of correlation if even only on a national and not city level?

How Africa tweets
How Africa tweets

But what really irks me is the content that wraps around the map. First the donut chart, I think my objections to donuts—at least the non-edible kind—are well known. In this case, I would add—or sprinkle on—that the white gaps between the languages are unnecessary and potentially misleading.

Secondly, the cities are eventually displayed upside down. Thankfully the labels are reversed so that city names are legible. However, the continually changing angle of the chart makes it difficult to compare Douala to Luanda to Alexandria. A neatly organised matrix of small multiples would make the data far clearer to read.

In short, I feel this piece is a good step in the right direction. However, it could do with a few more drafts and revisions.

Credit for the piece goes to Allan Kamau.

Home Ownership

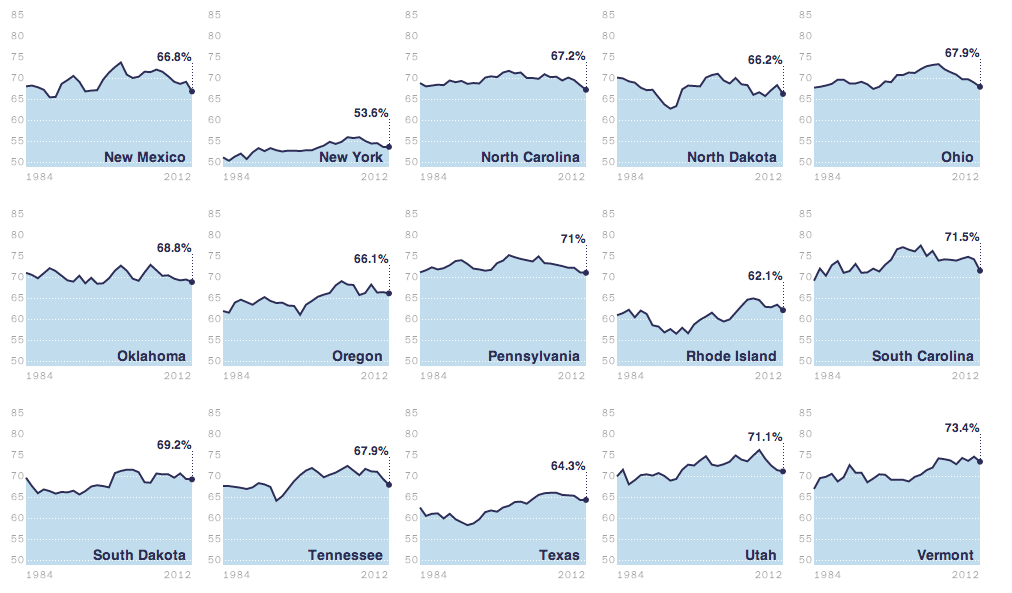
I am pretty much a sucker for small multiples. And so today I present a good one from the Washington Post. The story starts looking at the broad, national scope of the issue. And from there it breaks home ownership down by state.

Home ownership by state

Credit for the piece goes to the Washington Post’s graphics department.

Wisconsin Politics

Today we dive into state-level politics north of Chicago, in the state of Wisconsin. The Milwaukee Journal Sentinel published an in-depth article looking at the political divide in the Milwaukee metropolitan area. While one could publish an article of that nature with just lots and lots of words, the Journal Sentinel chose to use maps and charts to support their arguments.

Comparing Milwaukee urban vs. suburban voting patterns

Credit for the piece goes to Craig Gilbert and Allan James Vestal.

Defence Spending

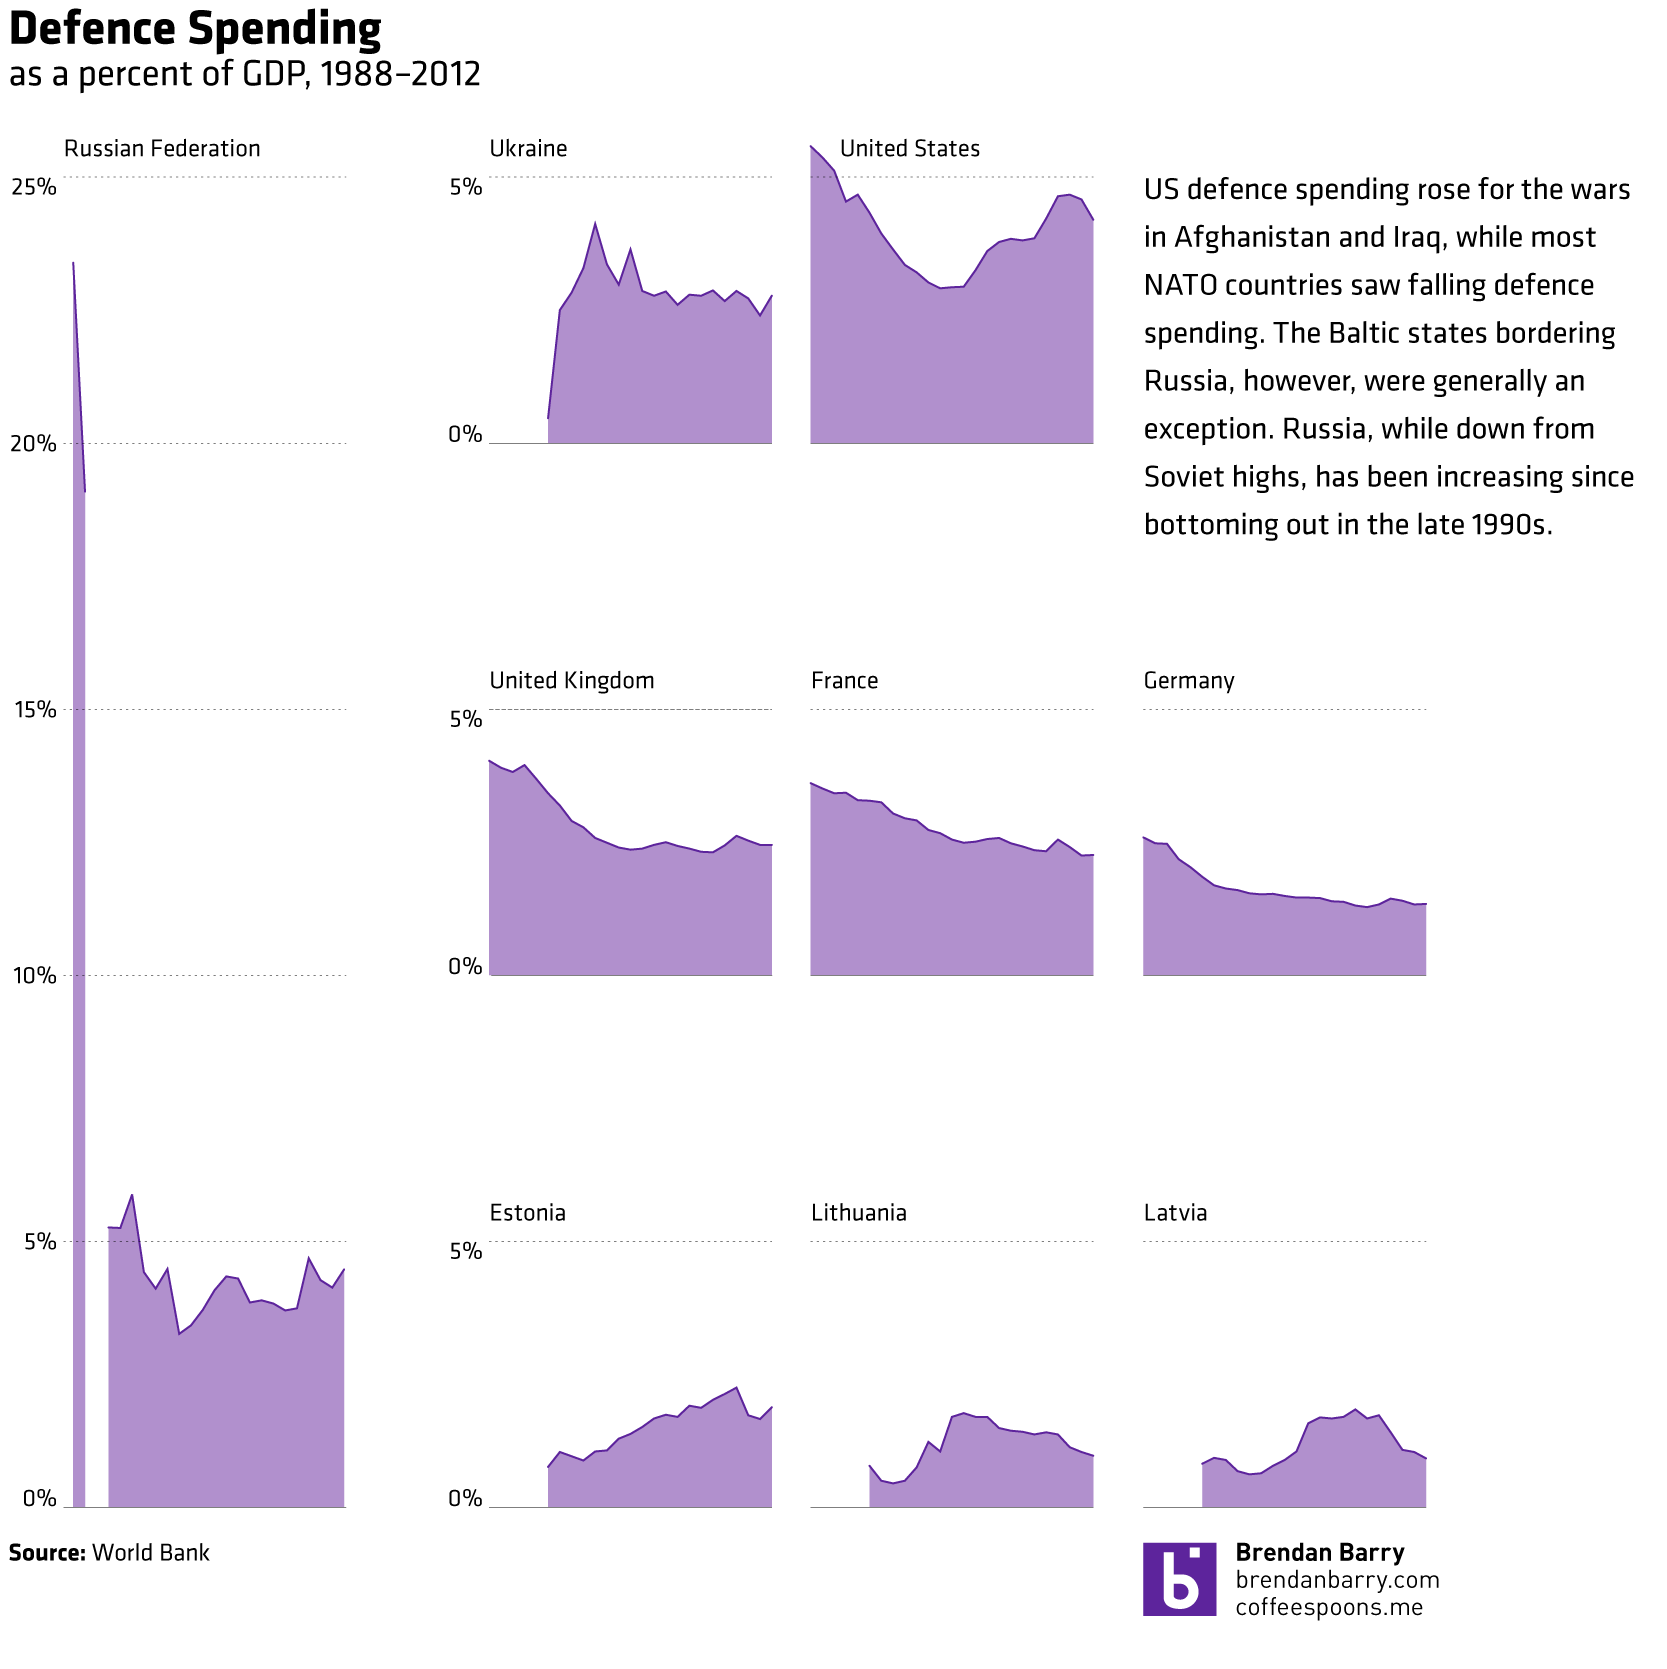
As troops and tanks and rumble around the Ukrainian–Russian border, I was left to wonder just how NATO has been doing with defence spending. So I took defence spending as a share of total GDP. In general, NATO countries have been spending less since the end of the Cold War. The Baltic states are a bit of an exception. I would guess that is based on their fears of their big Russian neighbour. A fear that, as Ukraine shows, is not entirely irrational. The United States, of course, has been spending a lot because of Afghanistan and Iraq. As for Russia, after the collapse of its economy in the late 1990s, it’s been spending more and more on the military.

Defence spending
Defence spending

The data comes from the World Bank.

There’s No Diversity in Baseball!

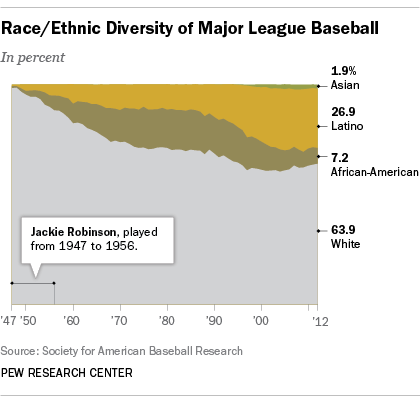
Well, okay, actually there is. But the cultural reference would have made even less sense if I omitted the negative. Anyway, in honour of the two baseball games I am seeing this week—last night’s and tonight’s Red Sox games—here comes this piece from Pew Research Center.

It’s a simple but fairly clear graphic. We are looking at the ethnic breakdown of baseball since 1947, when Jackie Robinson broke the colour barrier. My only qualm, as ever, with this stacked area chart is that while you can see the clear trend upward in white share, it is a bit more difficult to see the directions the other ethnicities are moving.

Diversity in baseball

Credit for the piece goes to Pew Research Council.

Tax Day and Income Inequality

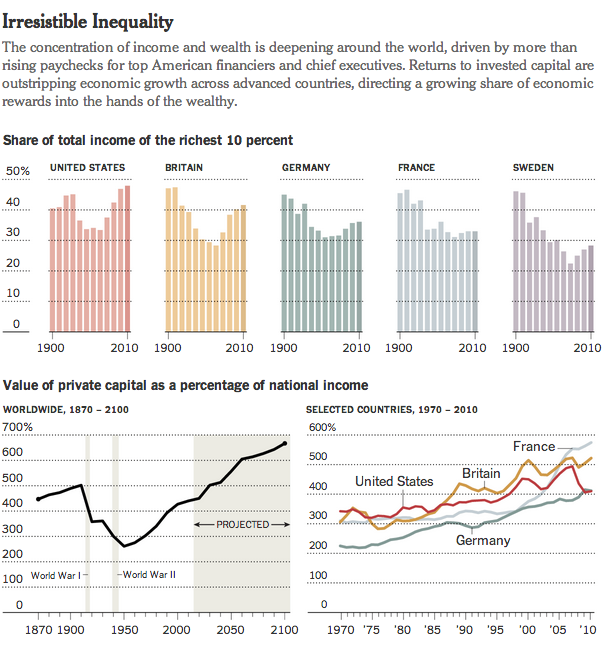
Tax Day for Americans seems like a great time to talk about income inequality. The article from which this chart comes talks about a recent book exploring the parallels of the 19th century’s inequality—as the article reminds us, the time of “Please, sir, may I have another?”—and the forecast for the 21st. Anyway, the graphic is a nice use of small multiples and highlights that despite the damage done to capital wealth by Great Depressions and two world wars, it is well on its way back to unequal levels.

Income inequality
Income inequality

Credit for the piece goes to the New York Times graphics department.

Allergens of DC

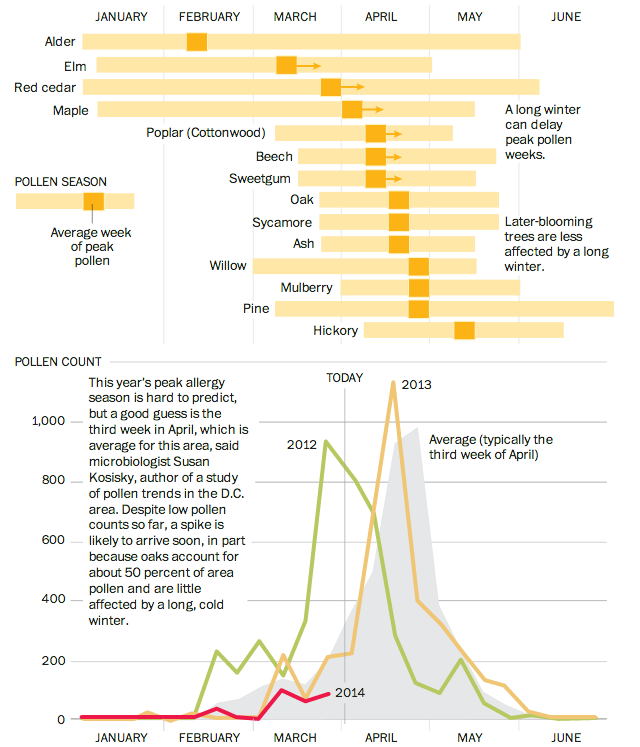
Good news and bad news, folks. The good news is that this chart does not apply to people living in Chicago, Philadelphia, or elsewhere. Unless—here’s the bad news—you live in Washington, D.C. In that case, well, prepare to die. You know, if you have allergies. The Washington Post has a nice graphic that outlines the arrival and peak seasons for different pollen allergens.

Allergens of DC
Allergens of DC

Credit for the piece goes to Bonnie Berkowitz and Patterson Clark.

Motorcycle Helmet Laws

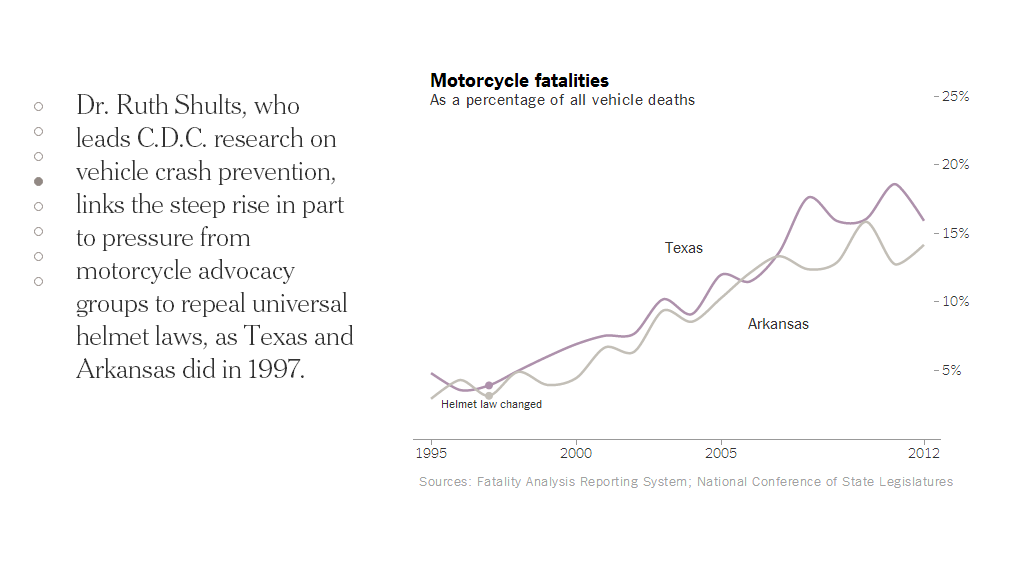
Today’s piece does not involve any particularly crazy graphics or forms of data visualisation. Instead, the piece is a novel way of telling a story. People are increasingly familiar with what we might call here scrolling stories. Scroll down the page and suddenly you have glossy photos or high-definition videos. The New York Times, however, has taken this idea in a different direction for a story about motorcycle helmet laws.

Instead of glossy photos, we have clear and concise charts. Instead of lots of text blocks, we have just a few sentences. The story is told by the charts and the text offers the necessary context or background. Not all stories will have the data behind them to allow the story to be told—or shown—in such dramatic fashion. But, I can hope they do.

Motorcycle helmet laws

Credit for the piece goes to Alastair Dant and Hannah Fairfield.

How to Write a Story

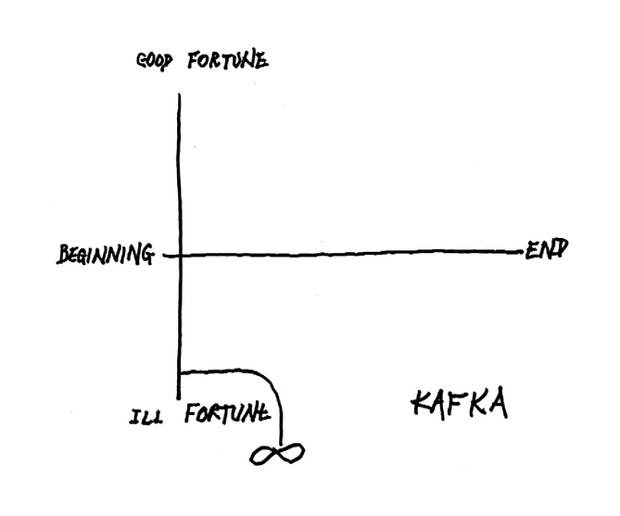
Today’s post is hosted on Brain Pickings. It’s diagrams made by Kurt Vonnegut that describe how basic plot lines work along two axes. There is a short video you can watch that goes over a few of them. But my favourite is, of course, not there. You have to read a bit further along to find it. Or just look below. But if you don’t read it, you’ll miss the written context.

Sucks to be a cockroach

Credit for the piece goes to Kurt Vonnegut.