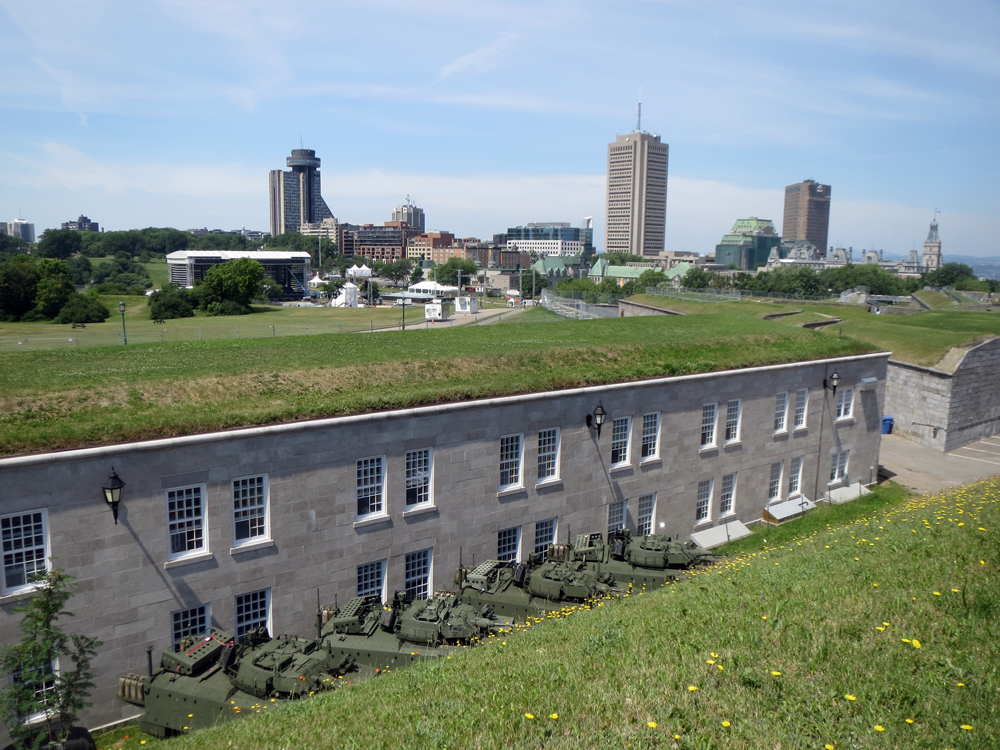
La Citadelle de Québec consists of several layers of fortifications that are not discernible to an eye outside the fortification. This has to do with the well-planned angle of the tops of the fortifications. Thankfully, designers said about explaining this through some graphics. While I do not have a great shot from outside the fortress of the angle, you can see some of the even slope in this photo from the top of the wall looking out towards Ville de Québec outside the city walls.
La Citadelle today, looking towards modern Québec
The fortification is composed of several different layers. This graphic colour codes them. For reference to the photo above, I am not standing “vous étes ici.” Rather, I am at the tip of bastion in the upper left of the diagram, just behind the pink—not red—line.
Colour-coded map of the fortification
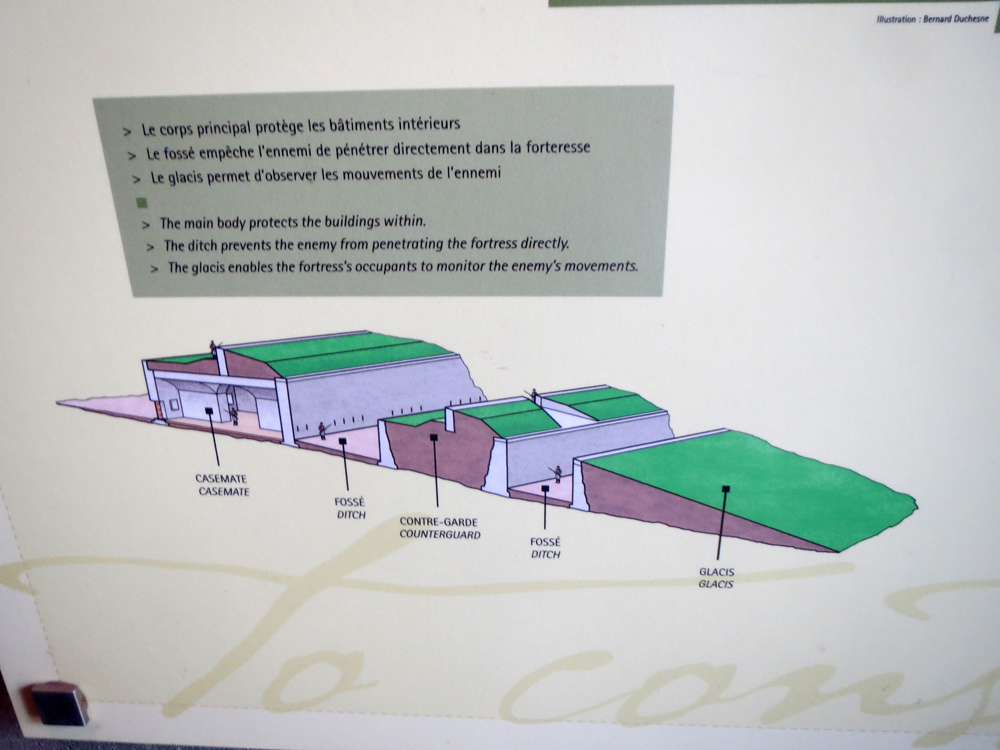
This graphic shows how la Citadelle would have been defended back in the 19th century. Note the lack of armoured vehicles as seen in the above photograph.
Cutaway of the fortification walls
Credit for the piece goes to the design team behind the graphics.
When I was in Québec I had the good fortune to take photographs of multiple signs and graphics aiming to educate readers about various things. I have spent a bit of my weekend combing through my photographs to see what I can present.
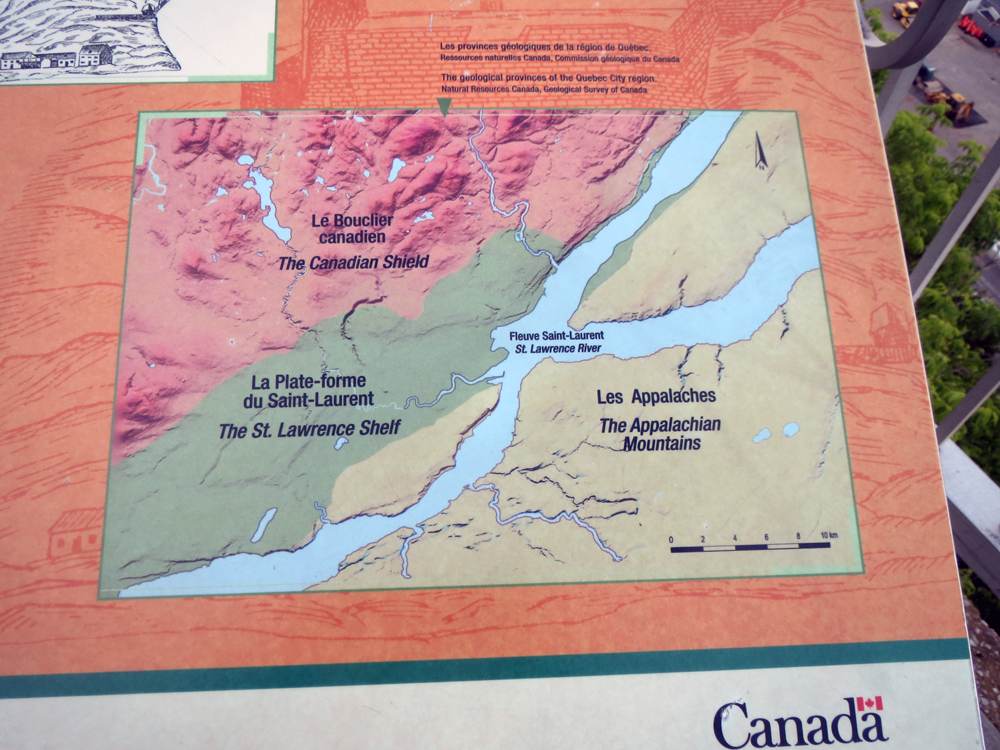
The first in today’s post is simply why Québec was so important. It sat at the narrowest part of the St. Lawrence River upstream from the Atlantic and, most importantly, was defendable from a high, rocky terrain that fell into the river via a sheer cliff face. But why was all of that? Geology explains all (in this graphic). Cap Diamant, where la Citadelle de Québec resides, sits atop an outcropping of the Appalachian Mountains while a sedimentary valley separates it from the Laurentian Mountains. The St. Lawrence just happens to cut through it and voila, natural defensible territory. Or as Charles Dickens put it, the Gibraltar of North America.
The geology of Québec
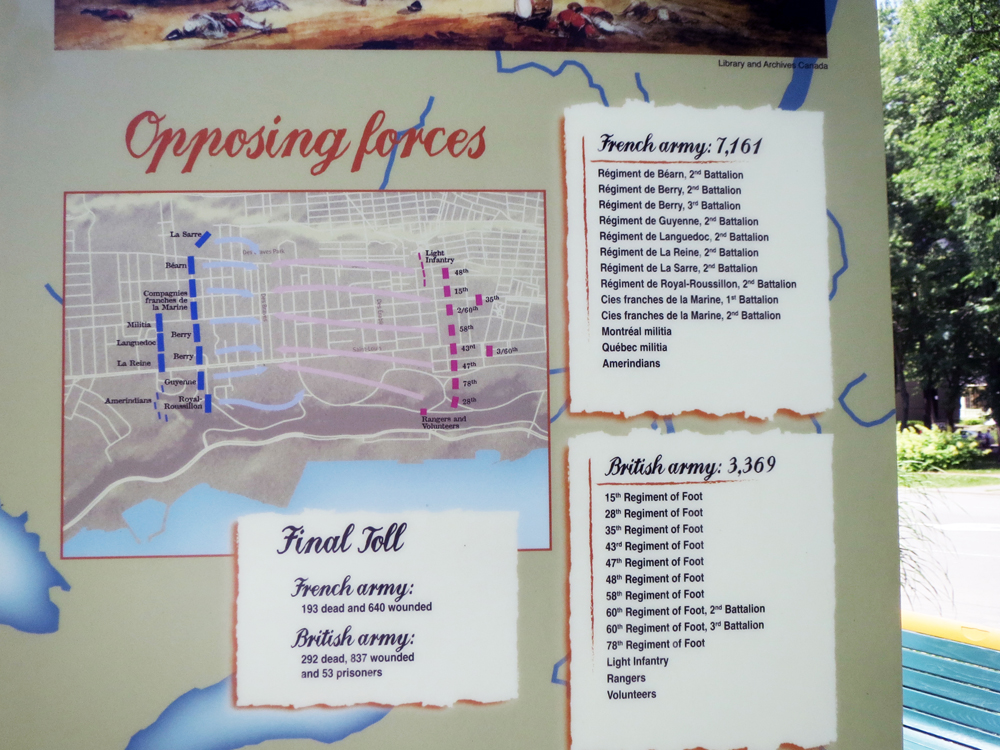
The second is a quick series of graphics that basically explain why, despite the heavy French influence, Québec is a province of the majority English-speaking country of Canada, a former British colony. In short, the Battle of the Plains of Abraham (and to a lesser extent the Battle of Sainte-Foy.
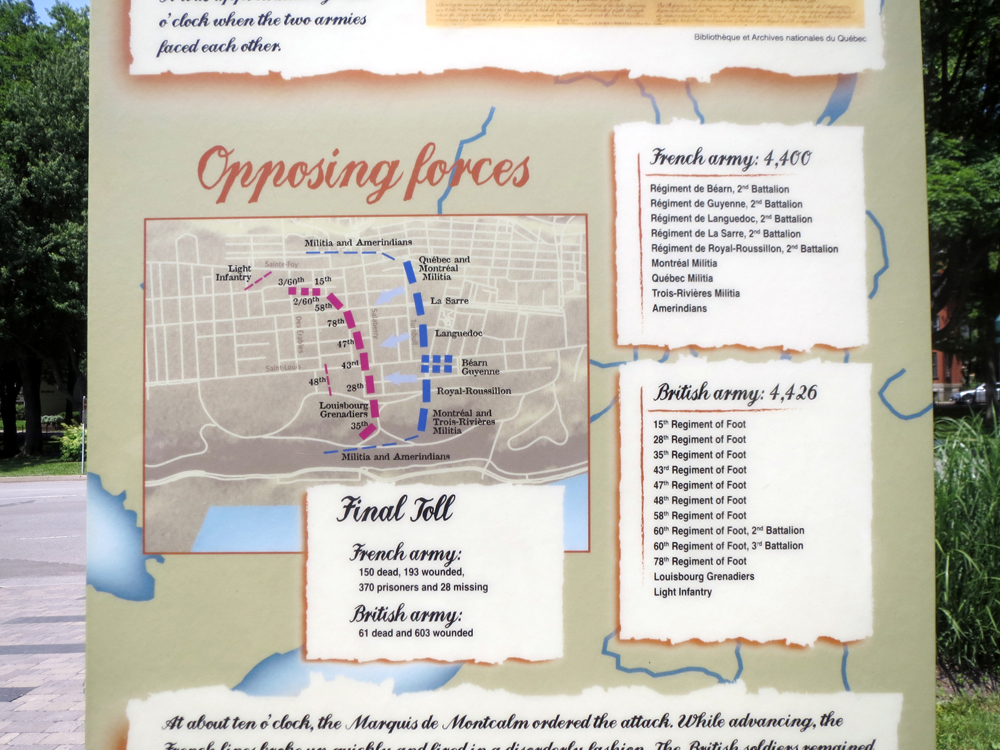
In 15 minutes on the Plains of Abraham, a British infantry force under General Wolfe defeated a French infantry force under General Montcalm. Both generals died in the battle and just a few days later, the city of Québec surrendered to the British. This gave control of the entrance to the Saint Lawrence to the British. And with the British then entrenched behind the city walls, they were capable of withstanding any French siege.
The Battle of the Plains of Abraham
The second graphic explores the Battle of Sainte-Foy, which was a French victory over General Murray. The British then retreated to the defences of Québec, but the French forces failed to capitalise on their victory—and were in general too under-resourced. So the city remained in British hands while the Royal Navy destroyed the French Navy off the coast of France. And without supplies sent via the French Navy, the French were forced to surrender not just Québec, but Montreal and the whole of Canada to the United Kingdom. Fearing rebellion, London allowed Canada to retain its religion, language, and culture. Hence, a Francophone population in an otherwise English-speaking North America.
The Battle of Sainte-Foy
Credit for the pieces goes to unknown persons who designed the signage for various parks in Québec.
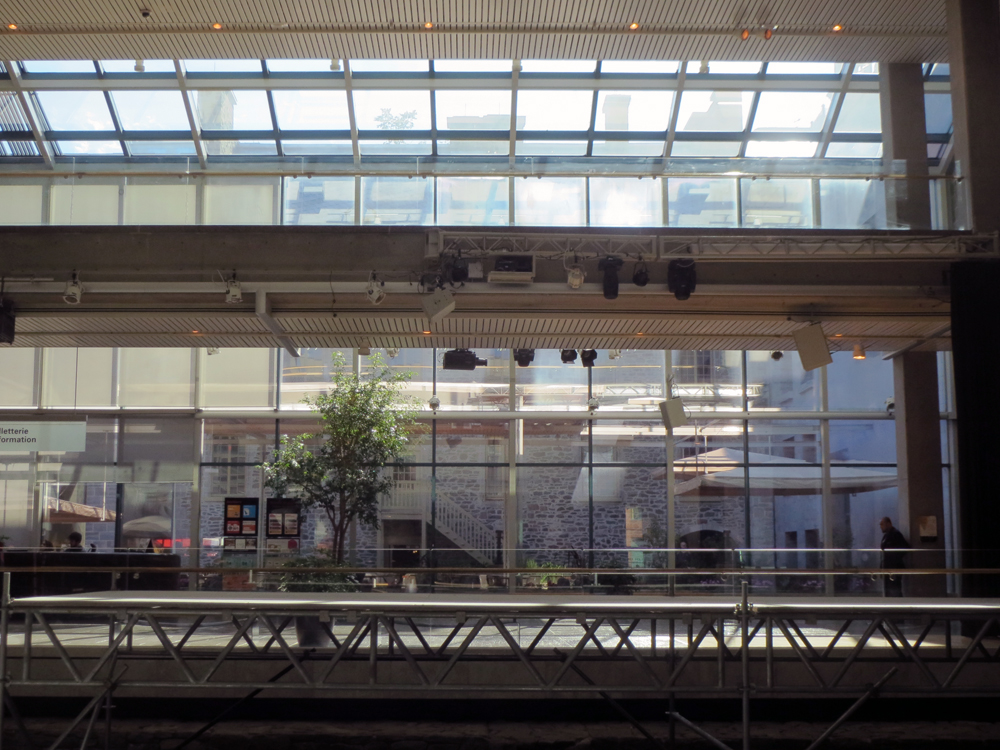
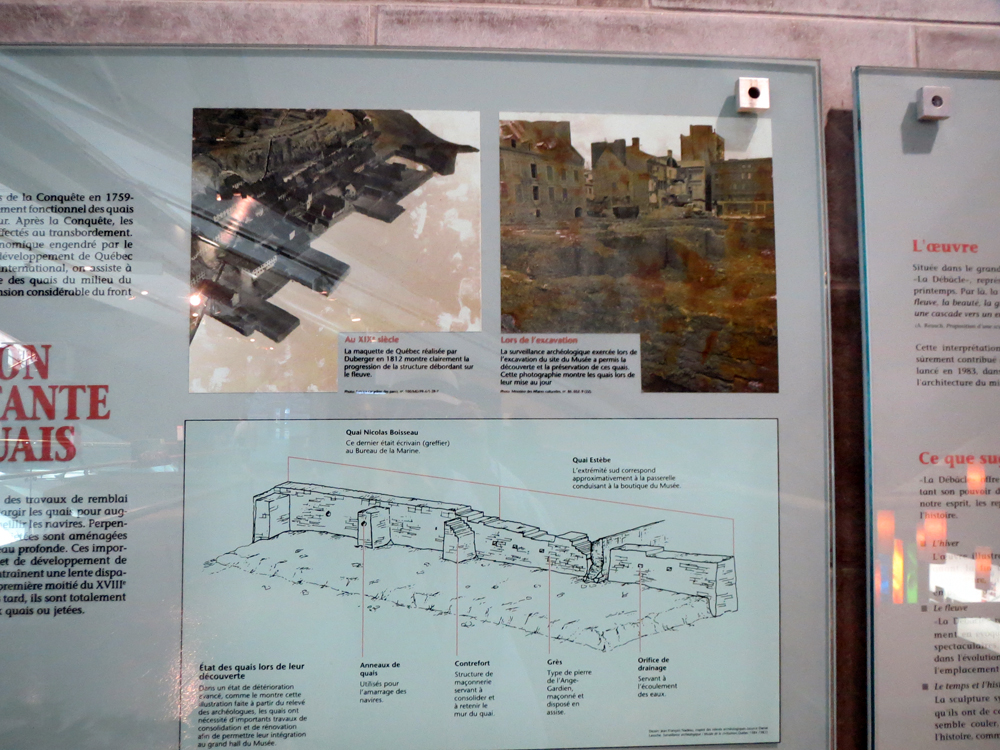
Yesterday’s piece was from the Musée de la Civilisation à Québec and looked at a bilingual exhibit on Greek and Roman mythology. The museum, of course, had many other exhibits. Today I want to show an interesting bit that explained why the museum, a modern construction dating to the late 1980s, incorporated an 18th century house called Maison Estèbe.
Maison Estèbe today
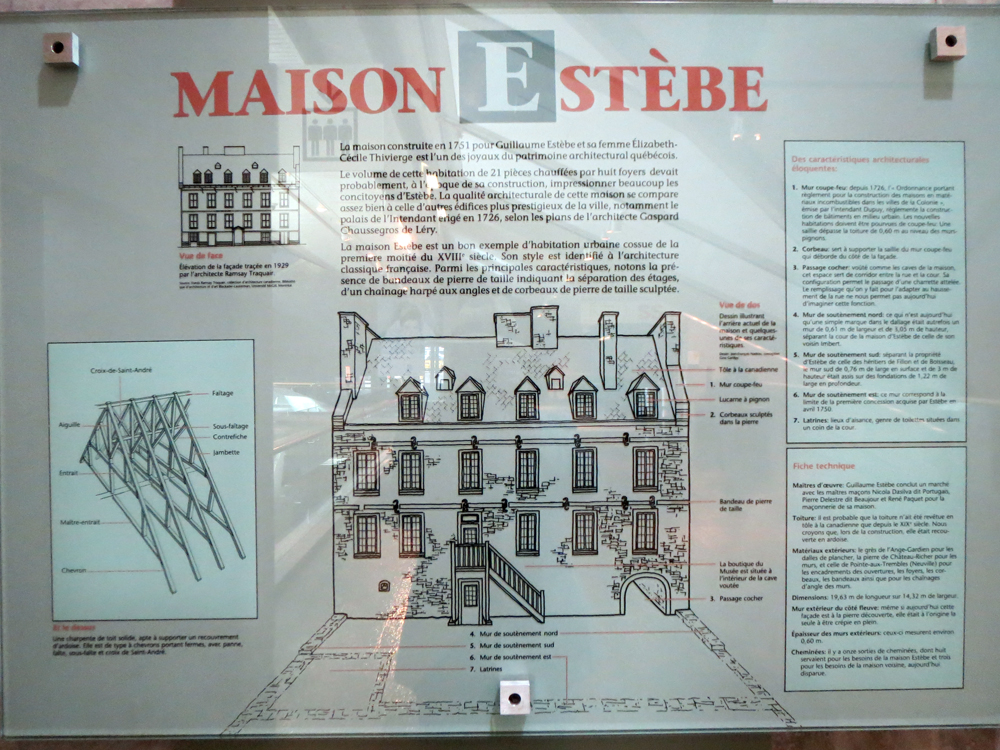
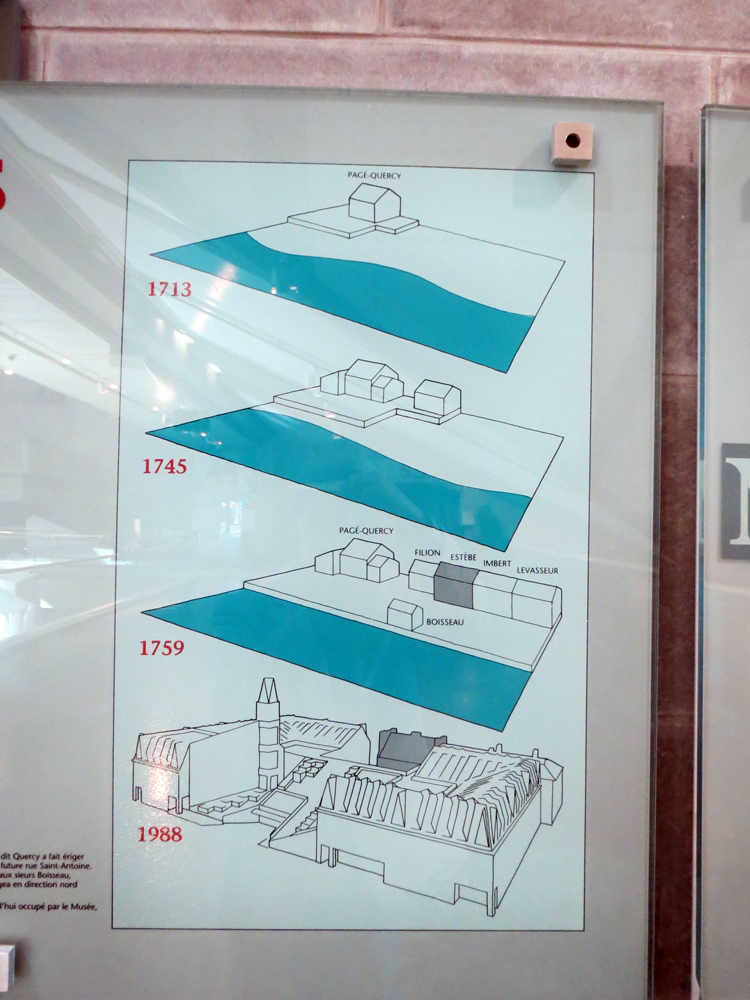
Well, the museum had a series of graphics with text explaining why. But they were only in French. But by some smart use of graphics and some thought as to how show the progression of time, the reader can piece together a good bit of the story.
Maison EstèbeWaterfront near Maison EstèbeQuay at Maison Estèbe
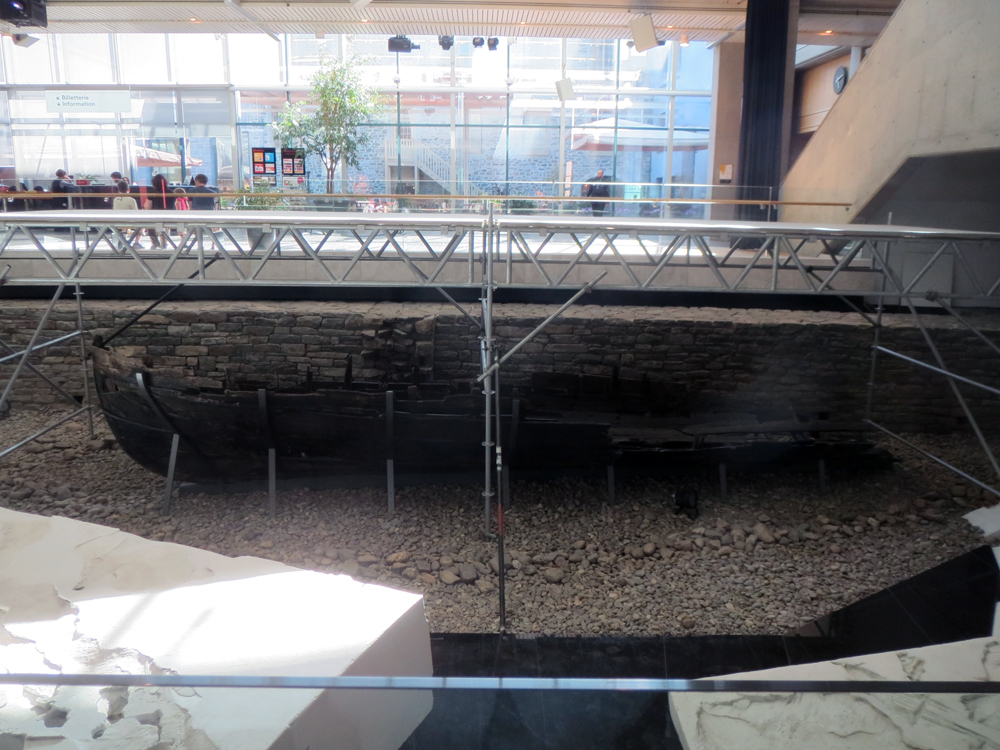
And of course to make it abundantly clear, the excavation of Québec’s foundations also revealed longboats along the old shoreline, which when placed in front of a quay like below, just make perfect sense.
long ship
Credit for the pieces goes to the graphics department of the Musée de la Civilisation à Québec.
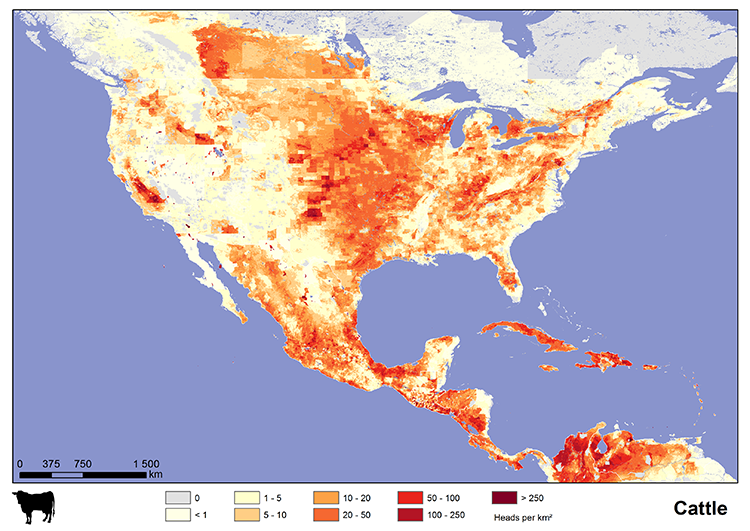
Today I’m enjoying some really good burgers. So via Fastco, today’s graphic looks at cattle, pig, and chicken populations across different regions of the world. In the United States, as you can see in the map here, that dark red spot in eastern Pennsylvania, that has to be Lancaster County.
US cattle population
Credit for the piece goes to International Livestock Research Institute.
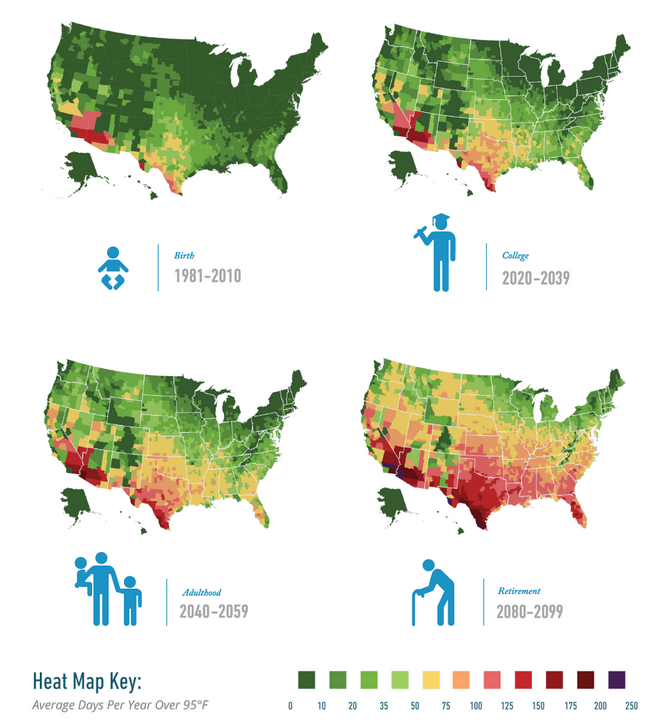
As someone who likes cooler weather, climate change sucks. Because that generally means warmer weather. Yes, yes, I know it means equally good chances for extreme cold temperatures and in general more extreme weather, but mostly I hate hot weather. So a new report by Risky Business Project, a group led by former New York mayor Michael Bloomberg, Henry Paulson, and Tom Steyer, looks to quantify some of the impact.
But in short, nothing good is going to happen. And basically, I will never move to the South.
Impact of climate change
Credit for the piece goes to the graphics team behind Risky Business.
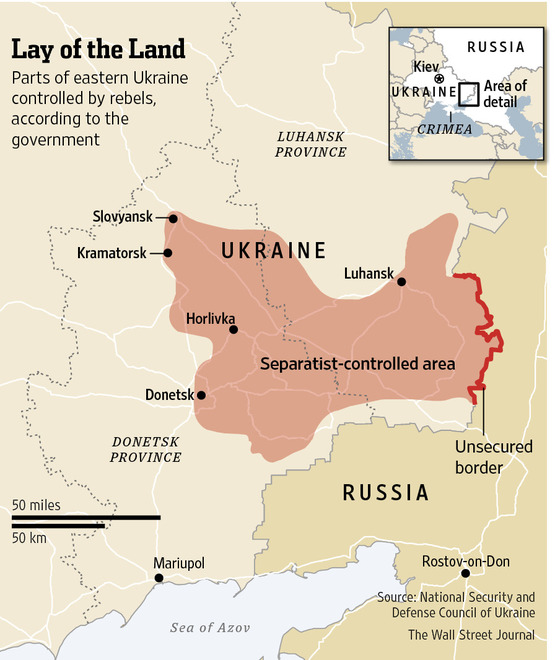
Today’s piece is far from ground-breaking or even complex. Friday, the Wall Street Journal published this map to supplement an article about the unilateral ceasefire declared by President Poroshenko in Ukraine. The map highlights the areas effectively controlled by the rebels, the most important the unsecured border. Of course this is just a map as stated by Kiev, the reality on the ground might be different. Regardless, it is the first map I have seen that has actually tried to demarcate the territory actually under control rather than claimed.
Rebel-held territory in eastern Ukraine
Credit for the piece goes to the Wall Street Journal’s graphics department.
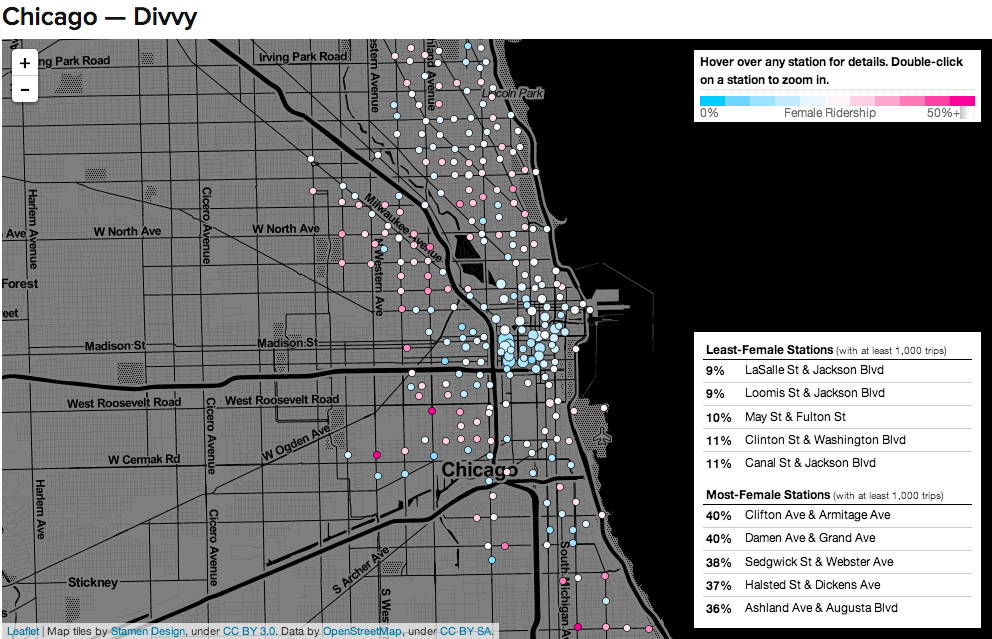
Here in Chicago this week is Bike Week and today Bike to Work Day. So today is a great day for some work from Buzzfeed that highlights the gender gap in cycling (at least in three US cities). To be fair, the data for the statement comes only from urban bike share programmes. But it does hint at a disparity all the same.
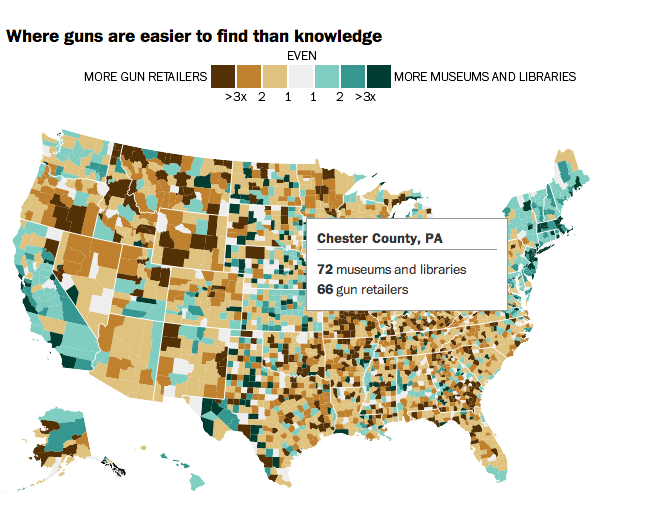
I loved the title of this piece from the Washington Post that I had to borrow it myself. Of course all credit goes to that particular copywriter. The Washington Post looked at counties and states where gun stores outnumbered museums and libraries. Thankfully my home county has more knowledge than guns. Sadly, the same cannot be said for large areas of the country.
Guns vs. Museums
And of note, while Pennsylvania is narrowly more gun than knowledge, the city of Philadelphia ranks second in terms of ratio of libraries/museums to gun stores at 16.93. Only New York City ranked higher.
Credit for the piece goes to Christopher Ingraham.
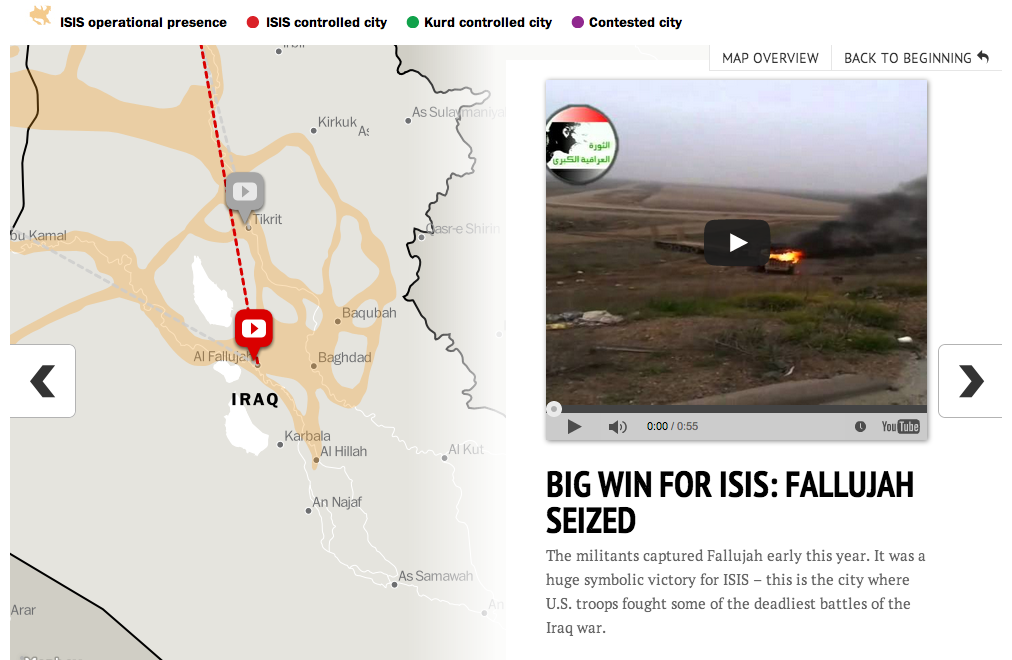
The Washington Post is also helping us understand the spread of ISIS. This time a bit more interactively than we have seen from the Times. This is a step-by-step (ish) explanation. Though, I quibble with the decision to link cities by dotted lines. That can create the illusion that ISIS fighters moved directly from city to city when I highly doubt they took that exact path.
Guide to the spread of ISIS
Credit for the piece goes to Swati Sharma, Laris Karklis, and Gene Thorp.