Spilling the Oil

A few weeks ago, Bloomberg Businessweek published a nice graphic that summarised the last 25 years of oil spills. I’m finally getting around to posting it. But what it does really well is show just how bad the Deepwater Horizon spill was compared to the other big name disaster: Exxon Valdez. Of particular note is the bar chart at the bottom right comparing the millions of gallons of oil spilled.

Oil spills
Oil spills

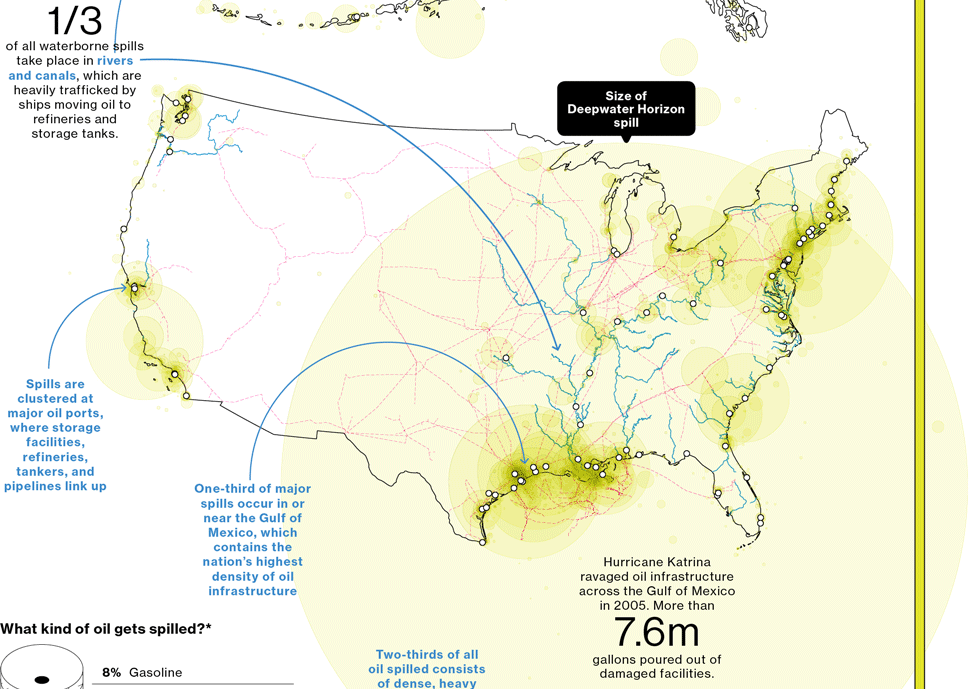
Credit for the piece goes to Evan Applegate.

New Transit Map for Springfield

Springfield from the Simpsons, of course. Happy Friday, and have fun visiting the Ethnictown station. The article comes from Atlantic Cities.

Springfield's transit map
Springfield’s transit map

Credit for the piece goes to the designers of the Simpsons.

Maps for the Search of MH 370

Yesterday we looked at the USA Today’s piece on the search for MH 370. Today we look at the New York Times, which has been running a series of maps that offer increasing amounts of detail on the context for the search.

Movement of buoys
Movement of buoys

Credit for the piece goes to Josh Keller, Sergio PeÇanha, Shreeya Sinha, Archie Tse, Matthew L. Wald, Tim Wallace, Derek Watkins, and Karen Yourish.

Smoking in the US

Today’s piece comes from the New York Times. It fits within a broader article about smoking in the United States. The map is a choropleth that compares the smoking rate across counties and states in 1996 and 2012. However, as the article talks about how difficult it has been to decrease the smoking rates among the poor, I wonder if even just a third map would be useful. This map could have shown the actual decline, perhaps in percentage points, of counties between 1996 and 2012. Or another related graphic could have tried to correlate income and said change.

Map of Smoking in 2012

Credit for the piece goes to the New York Times graphics department.

Jade Rabbit

In December, China landed a rover named Jade Rabbit on the Moon. The South China Morning Post created a nice infographic to explain the lunar landing and place it in the context of other missions to the Moon.

Cropping from the infographic

Credit for the piece goes to Adolfo Arranz.

Maps Being Useful

I often rail against the use of maps. I often hear “They’re pretty!” or “They’re colourful!” or “But I really do know where Guatemala is!” or “I can see my house!”. They’re often just a crutch, unless you can use them to show an actual geographic distribution. Thankfully from Quartz we get a series of small multiple maps that look at the geographic distribution of top trading partners for a select set of geographies.

Global trade
Global trade

For this set, I think the colours could be the same and perhaps the chosen country perhaps outlined or otherwise signalled on the map. (Only because my utter lack of faith in people being able to identify countries on a map.) Still, it’s a good piece overall that makes nice use of maps.

Credit for the piece goes to David Yanofsky.

Malaysia Airlines Flight 370

Ukraine has dominated the news much of the last few weeks. But the new 24/7 international news story is the missing aircraft (at least as of my writing this) that was Malaysia Airlines Flight 370. There are presently two nice graphics I have seen attempting to explain the story. The first, a cropping of which is below, is from the Washington Post.

The Washington Post piece

The second piece, again another cropping, is from the South China Morning Post.

South China Morning Post's graphic
South China Morning Post’s graphic

Credit for the Washington Post piece goes to Gene Thorp, Alberto Cuadra, Laris Karklis, and Richard Johnson.

Credit for the South China Morning Post piece goes to the South China Morning Post graphics department.

Answering Some More Questions About Ukraine

So Ukraine is even more of a mess and in less than a week’s time, the Crimean people will vote in a referendum on whether they want to remain a part of Ukraine or rejoin Russia. This graphic of mine is an attempt to answer some questions—though hardly all I wanted—about Ukraine, Crimea, and about what the Russians have been doing. (To be fair, the Russians still don’t admit that the troops and soldiers are theirs. But really, I mean come on, we all know they are.)

Why Crimea?
Why Crimea?

Walking Down the Street

Business Insider posted a neat graphic that compared the walkability of a suburban neighbourhood outside Seattle to a dense urban neighbourhood in Seattle. Turns out you can walk a lot more and further in a gridded mile than in a faux-organic sprawl.

How far can you walk?

Credit for the piece goes to Sightline Institute.