Covid-19 Update: 28 September

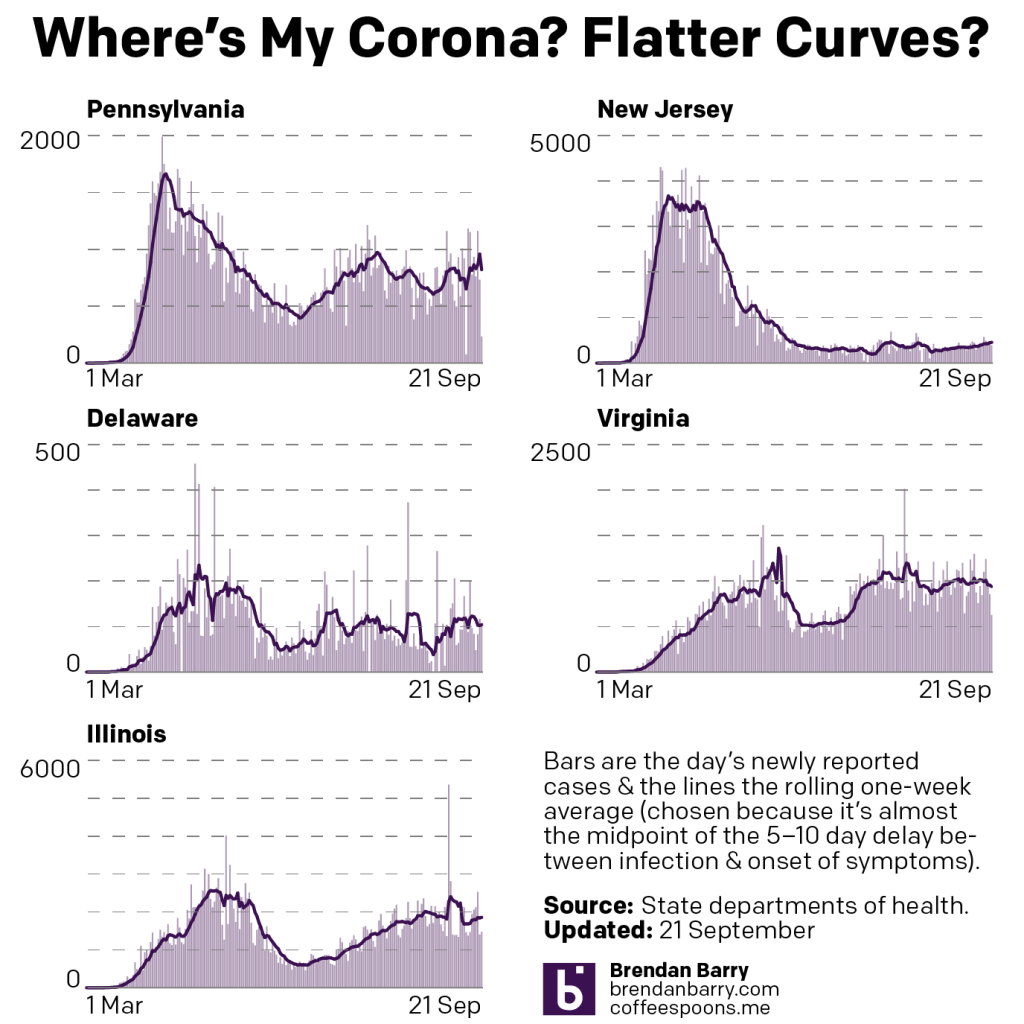
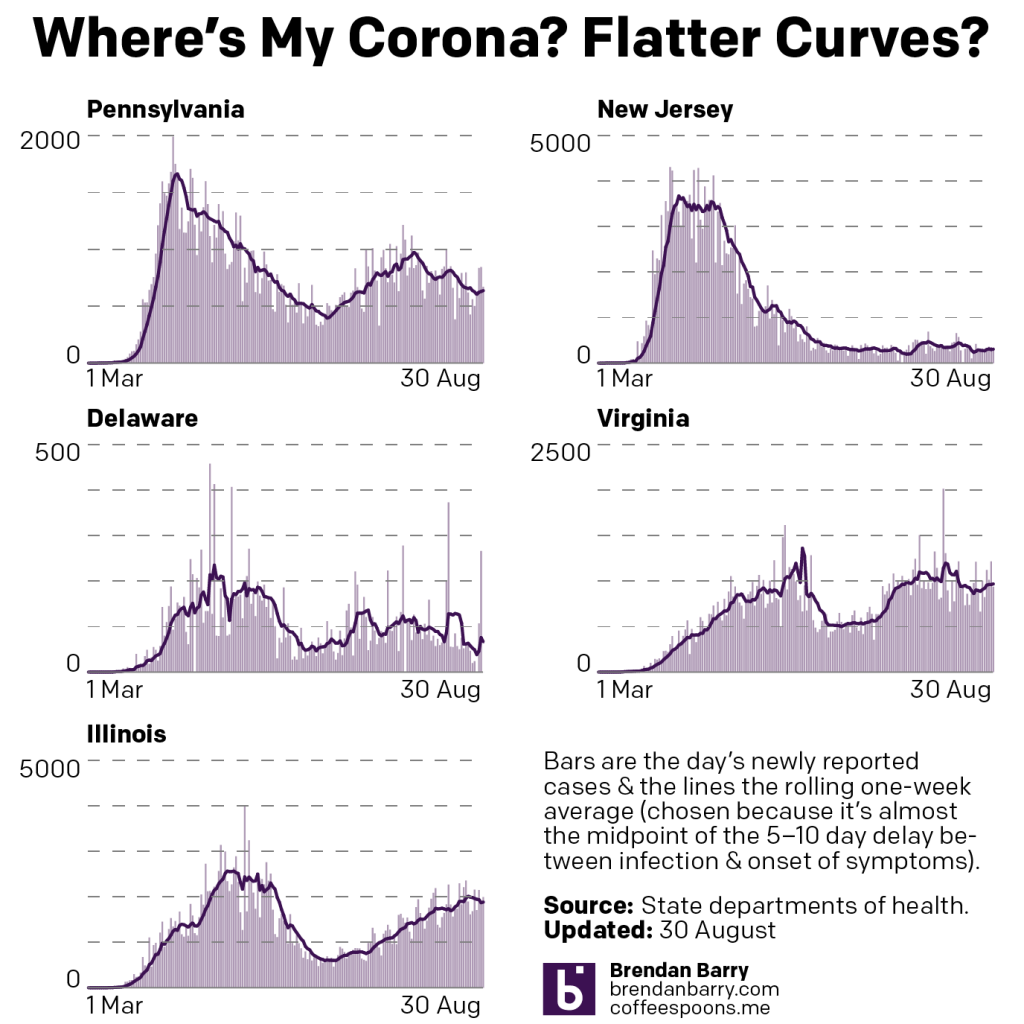
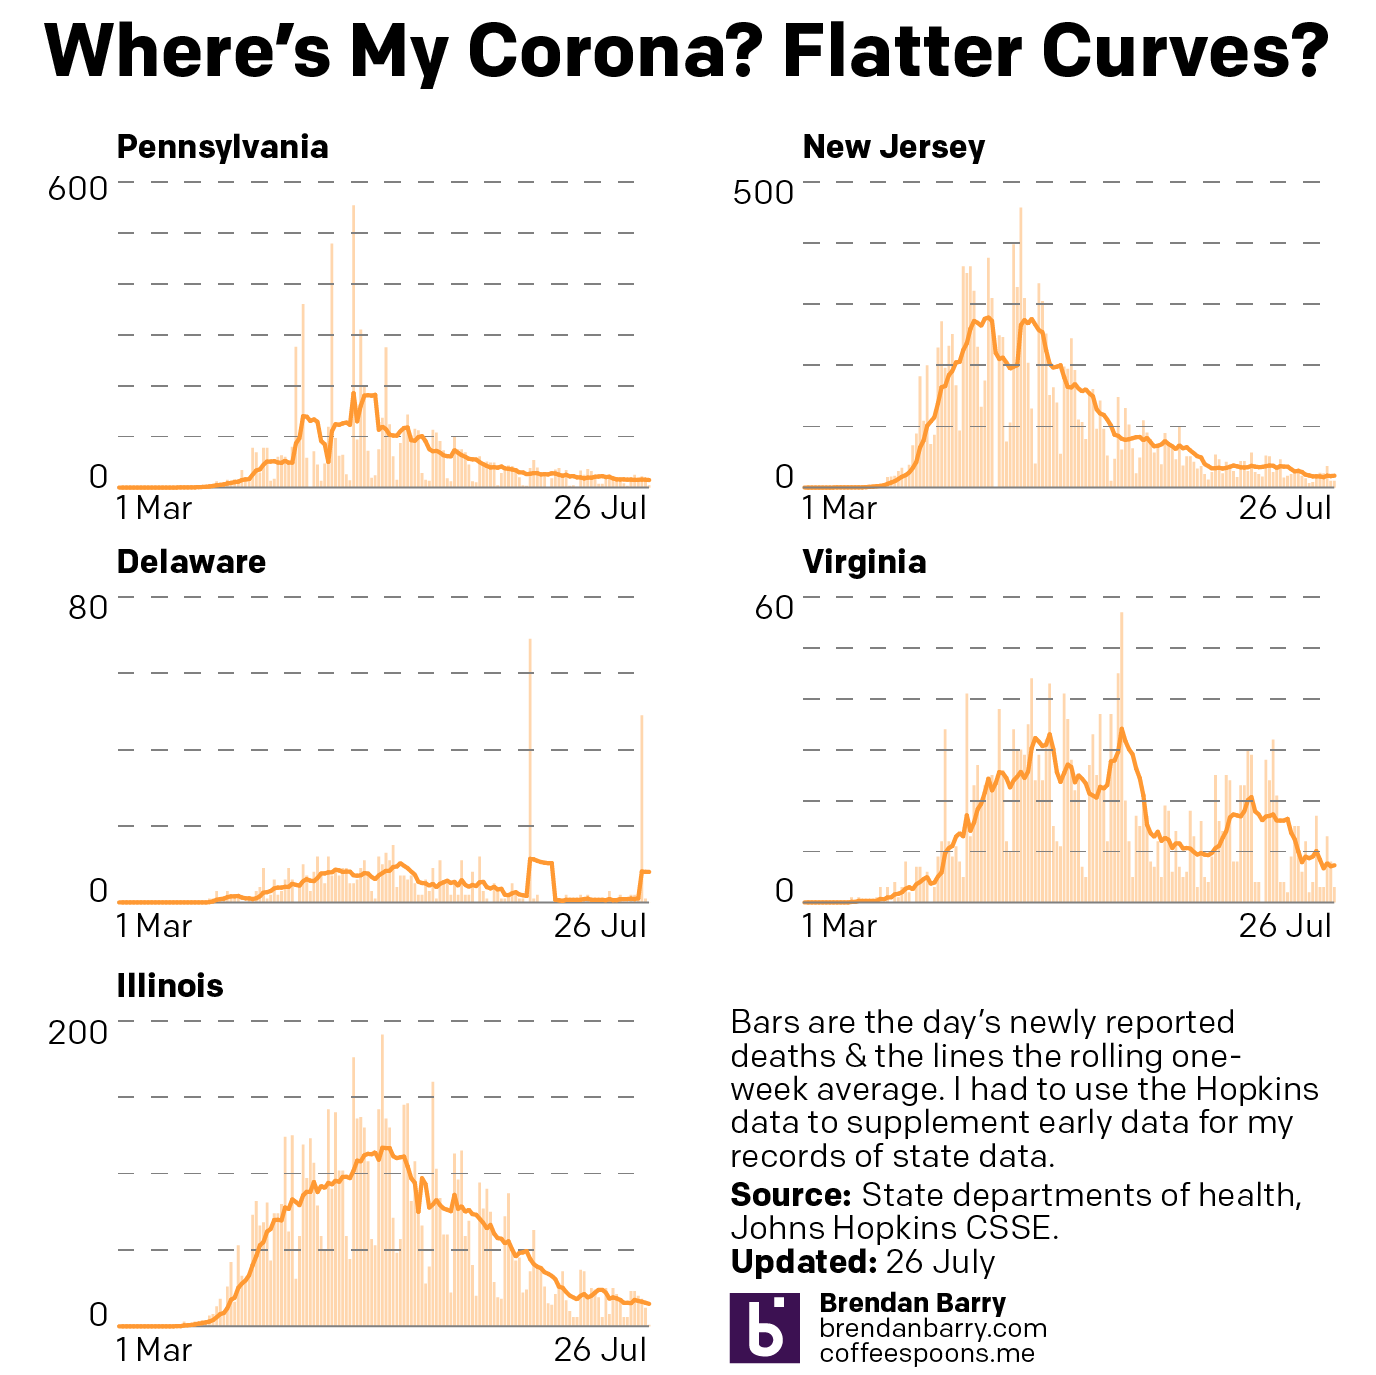
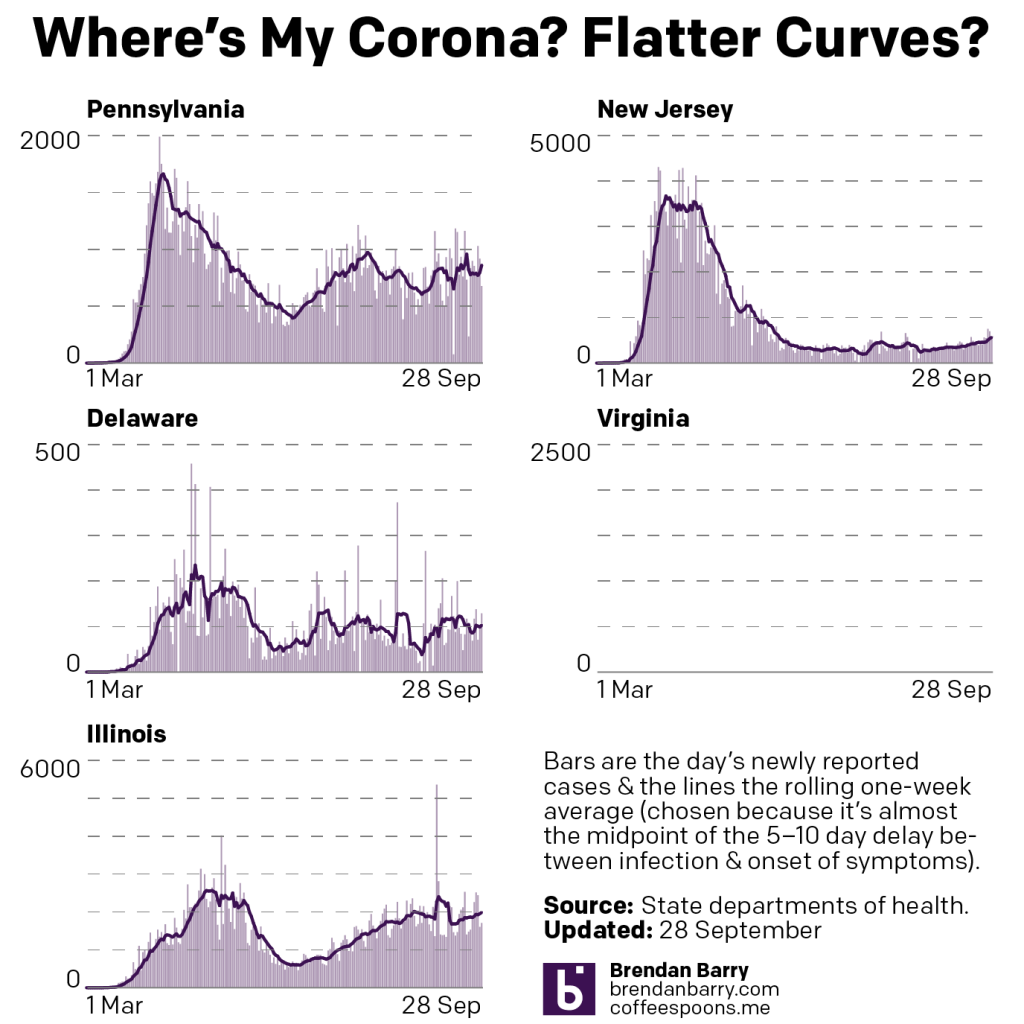
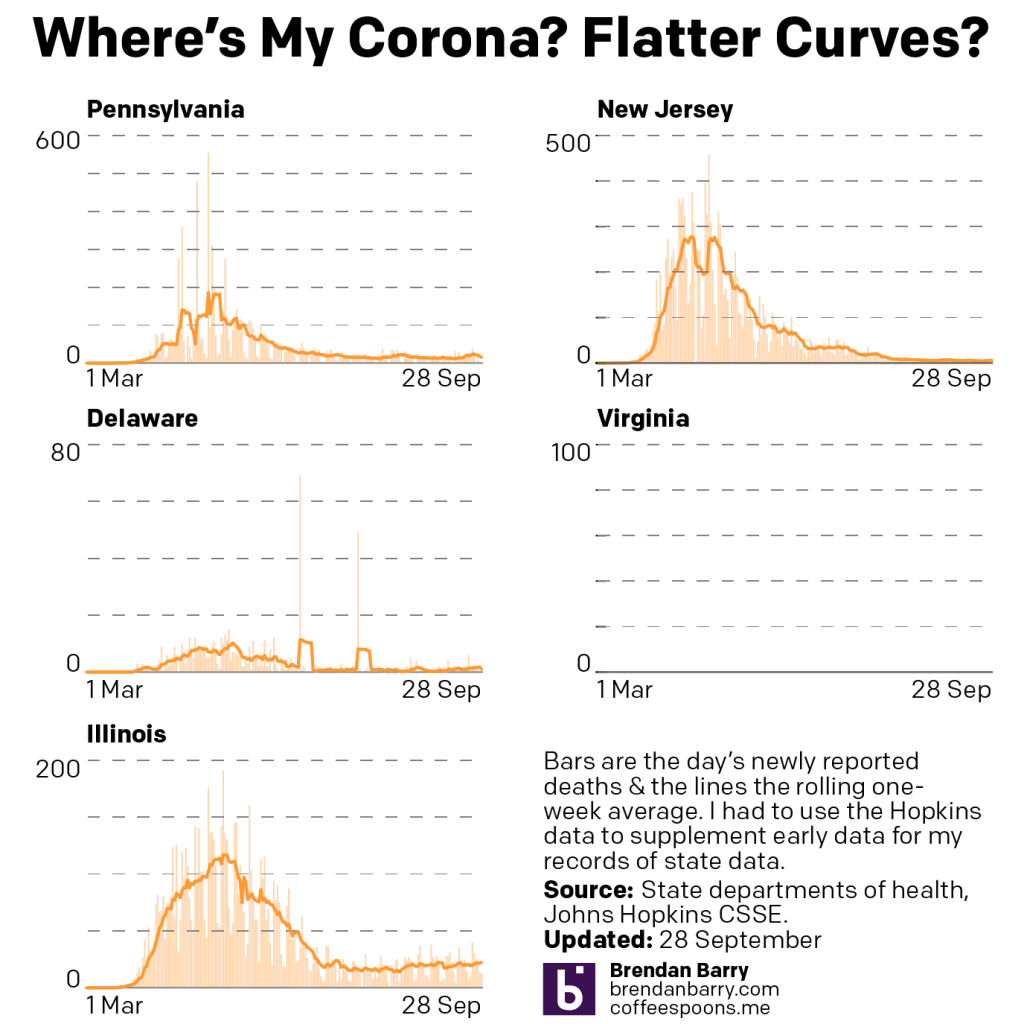
Apologies for the lack of posting, work is pretty busy as we wrap some projects up. But here’s a look at the latest Covid data for Pennsylvania, New Jersey, Delaware, and Illinois. Normally we look at Virginia as well, but their site was down for maintenance and so there was no data to report.

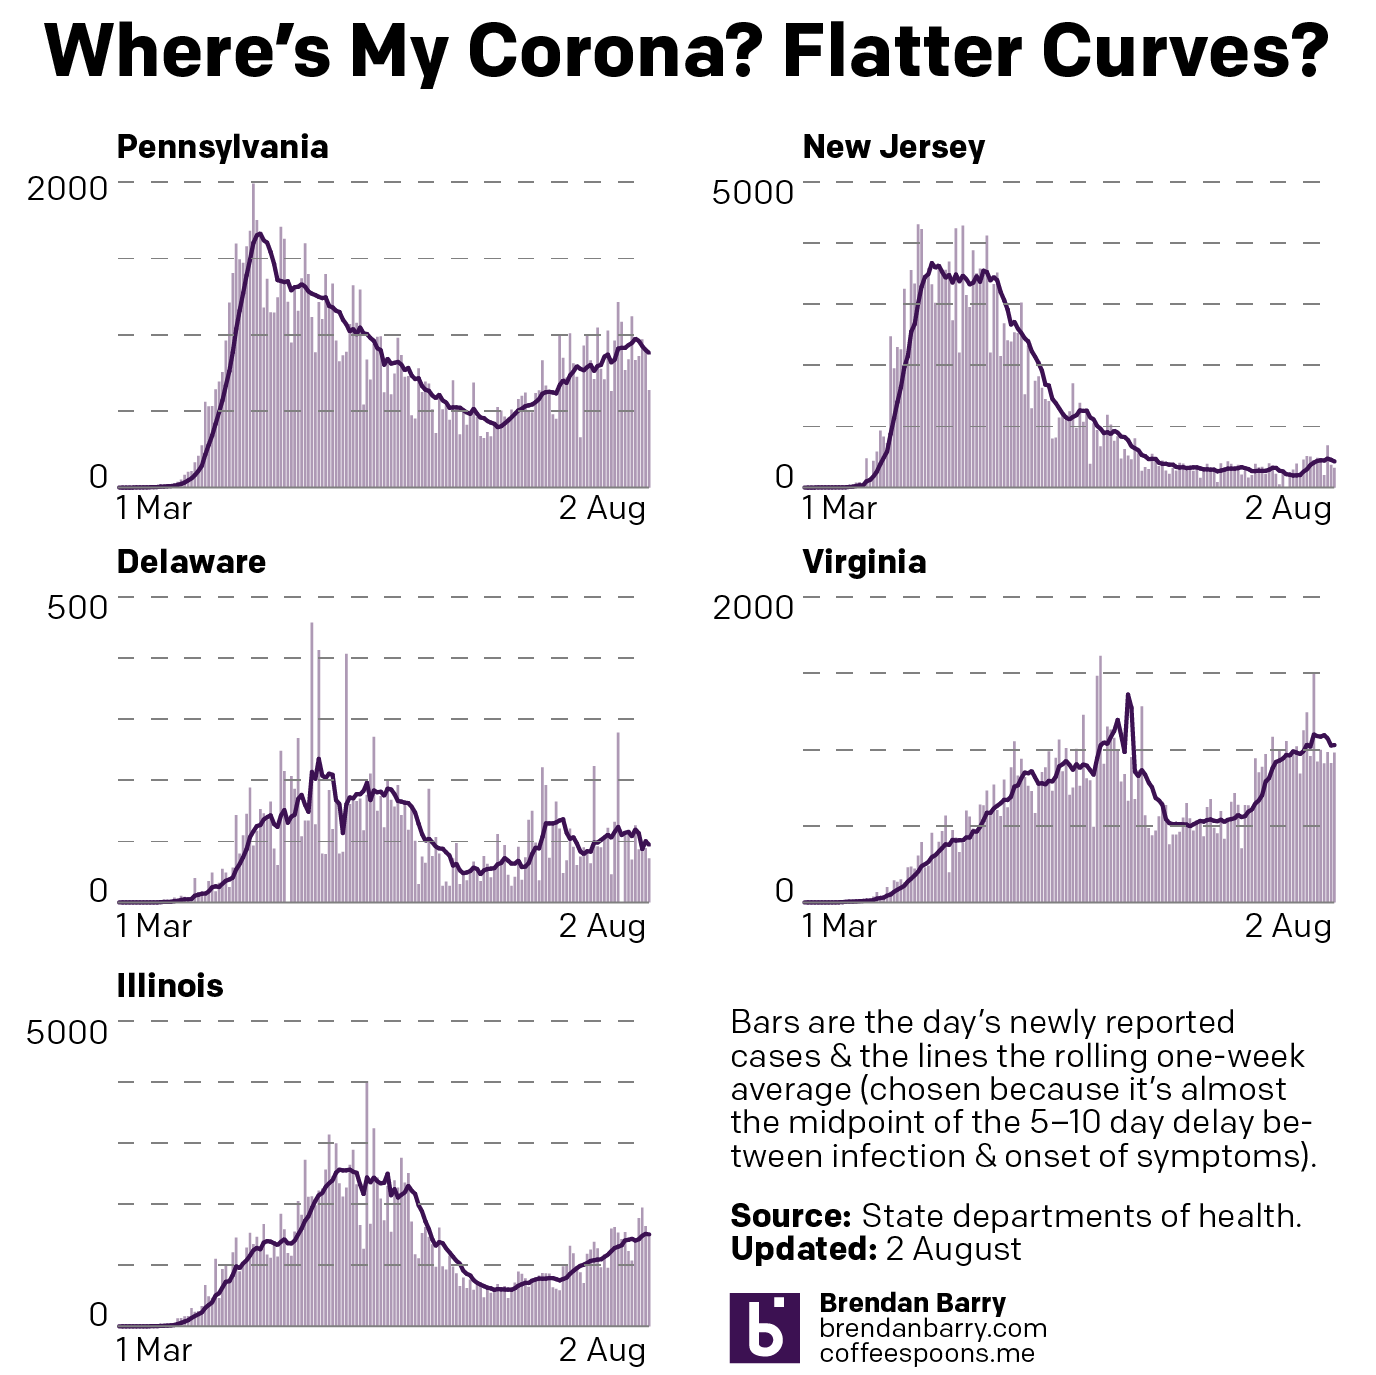
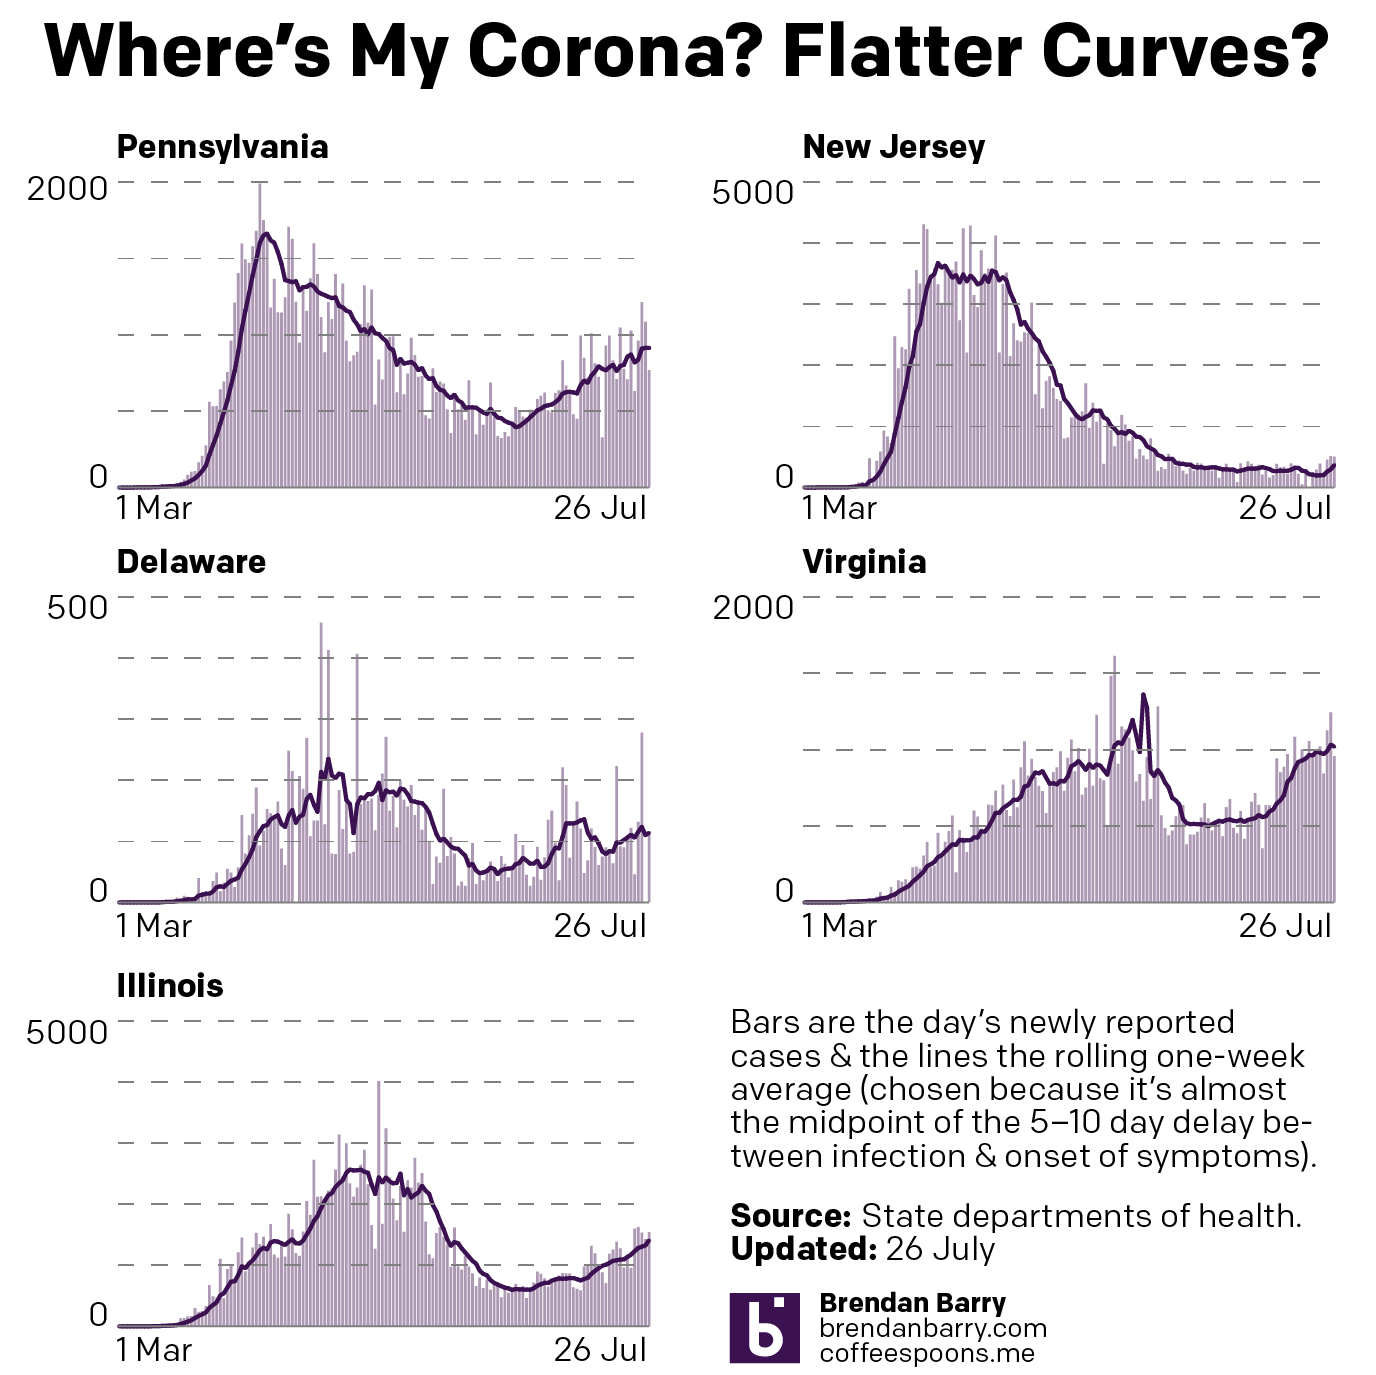
When it comes to new cases, we have on the one hand places like New Jersey and Illinois, where new cases continue to rise. The rate is nowhere near as fast as it was in March and April, but the inclines are clearly there. Delaware has been up and down, but largely hovering around just shy of 100 new cases per day. Pennsylvania is a bit harder to tell because of some dramatic swings that have knocked the average around, but it does appear to be trending upward, though I’m not quite as confident in that as I am with New Jersey and Illinois.

New cases curve in PA, NJ, DE, and IL.

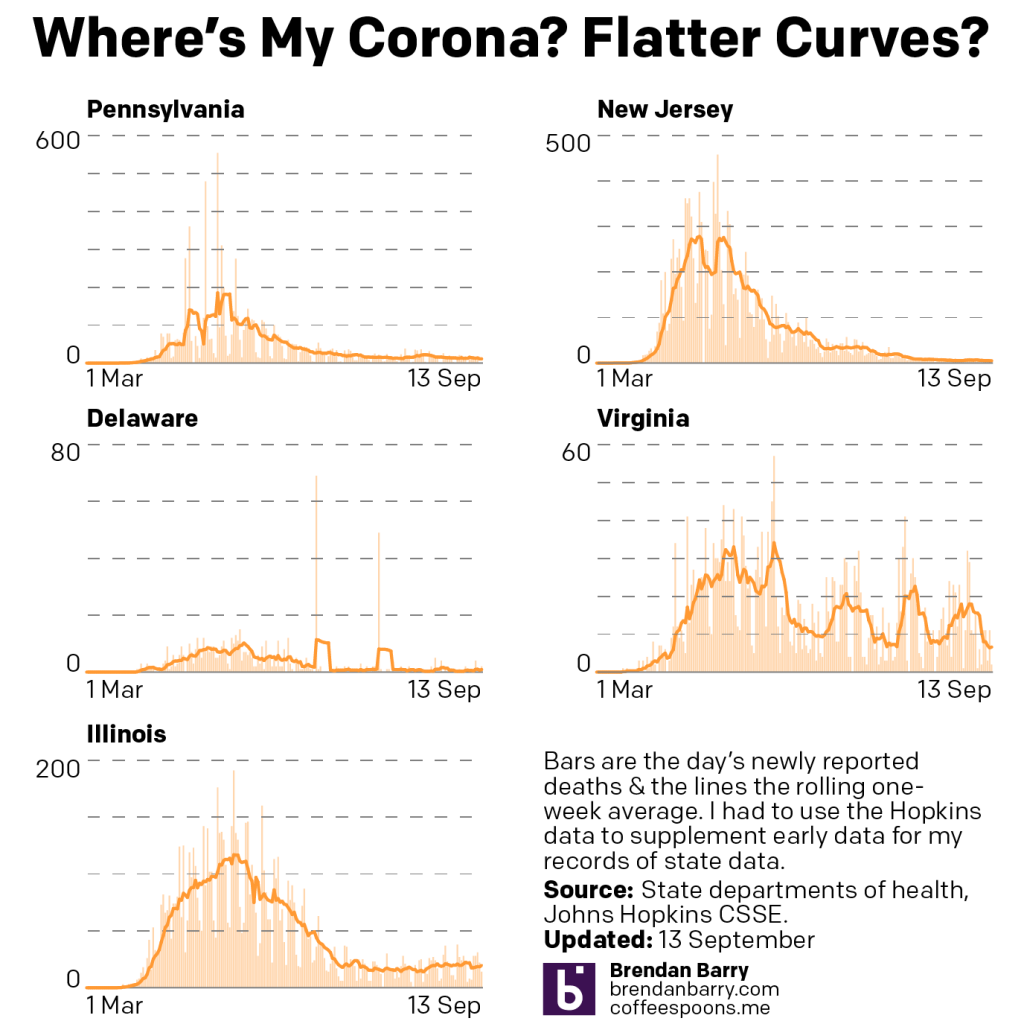
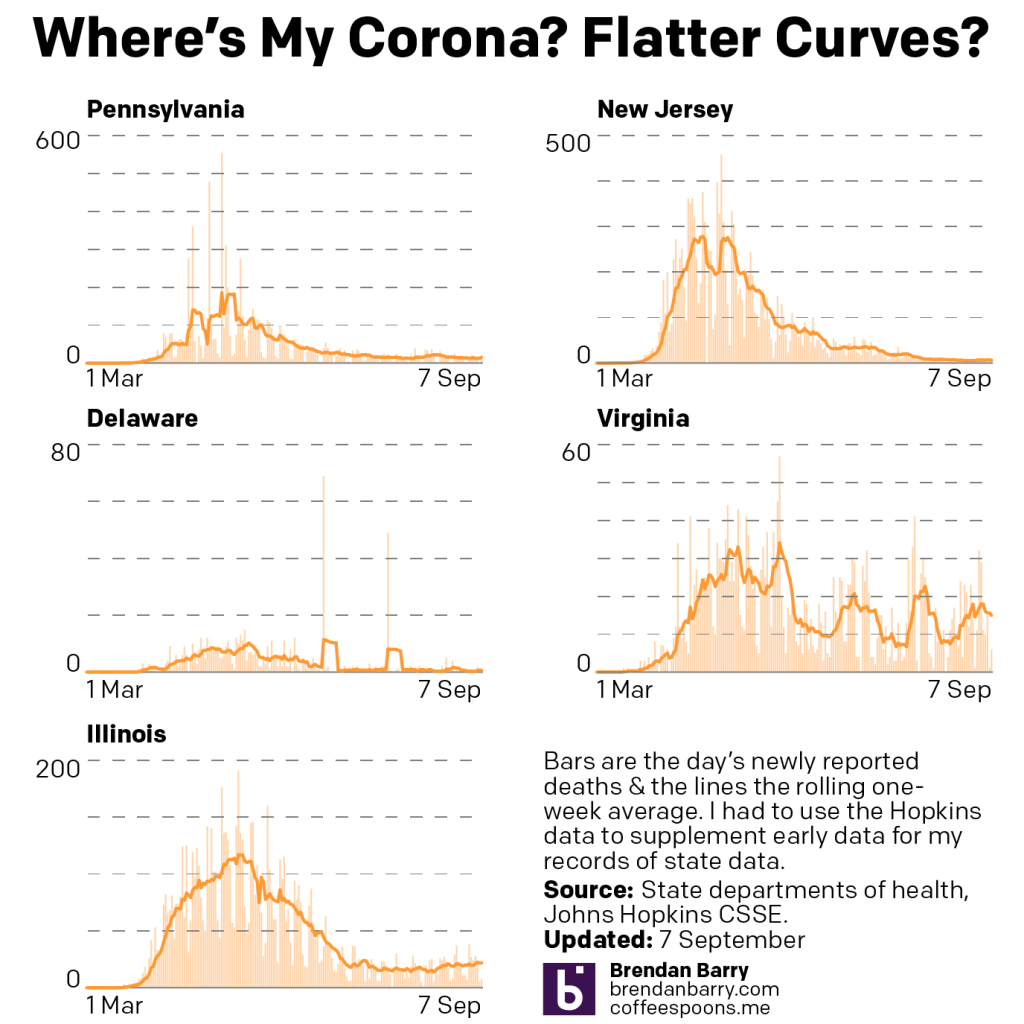
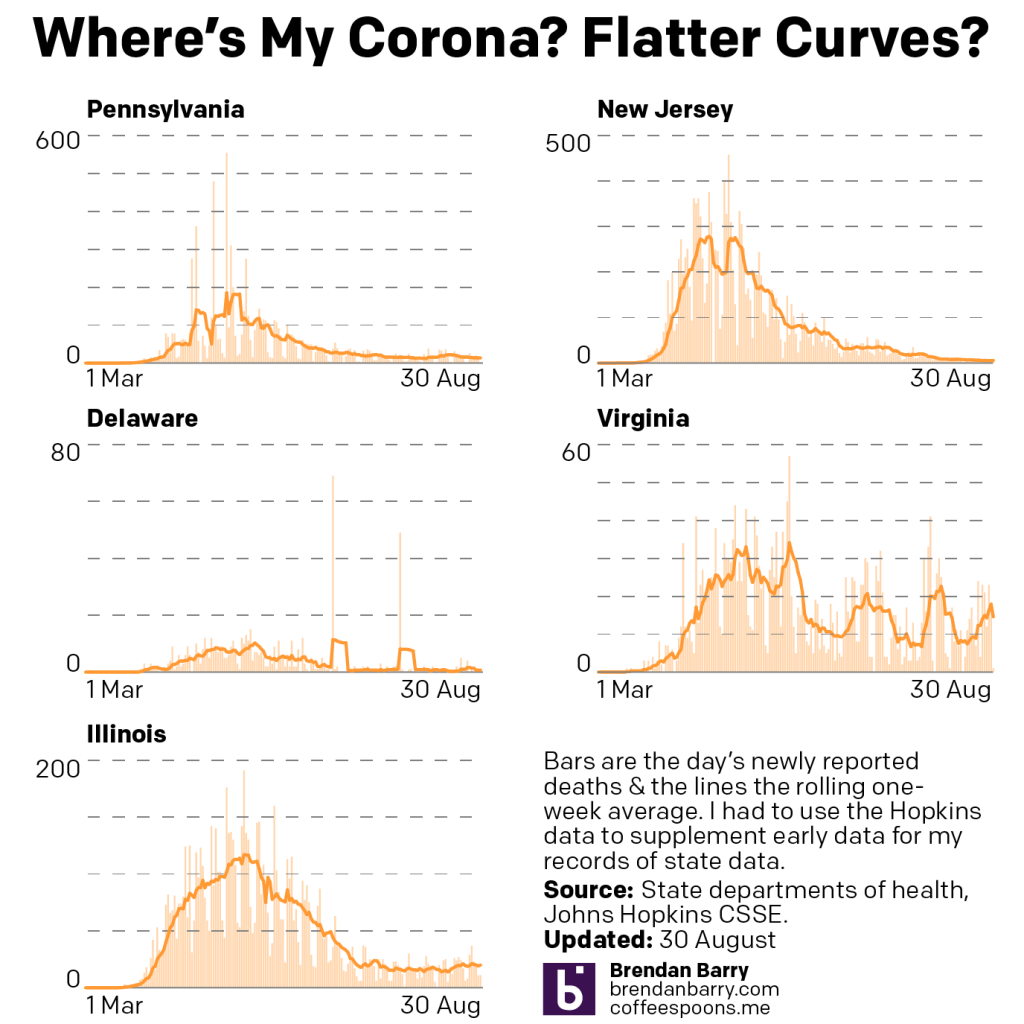
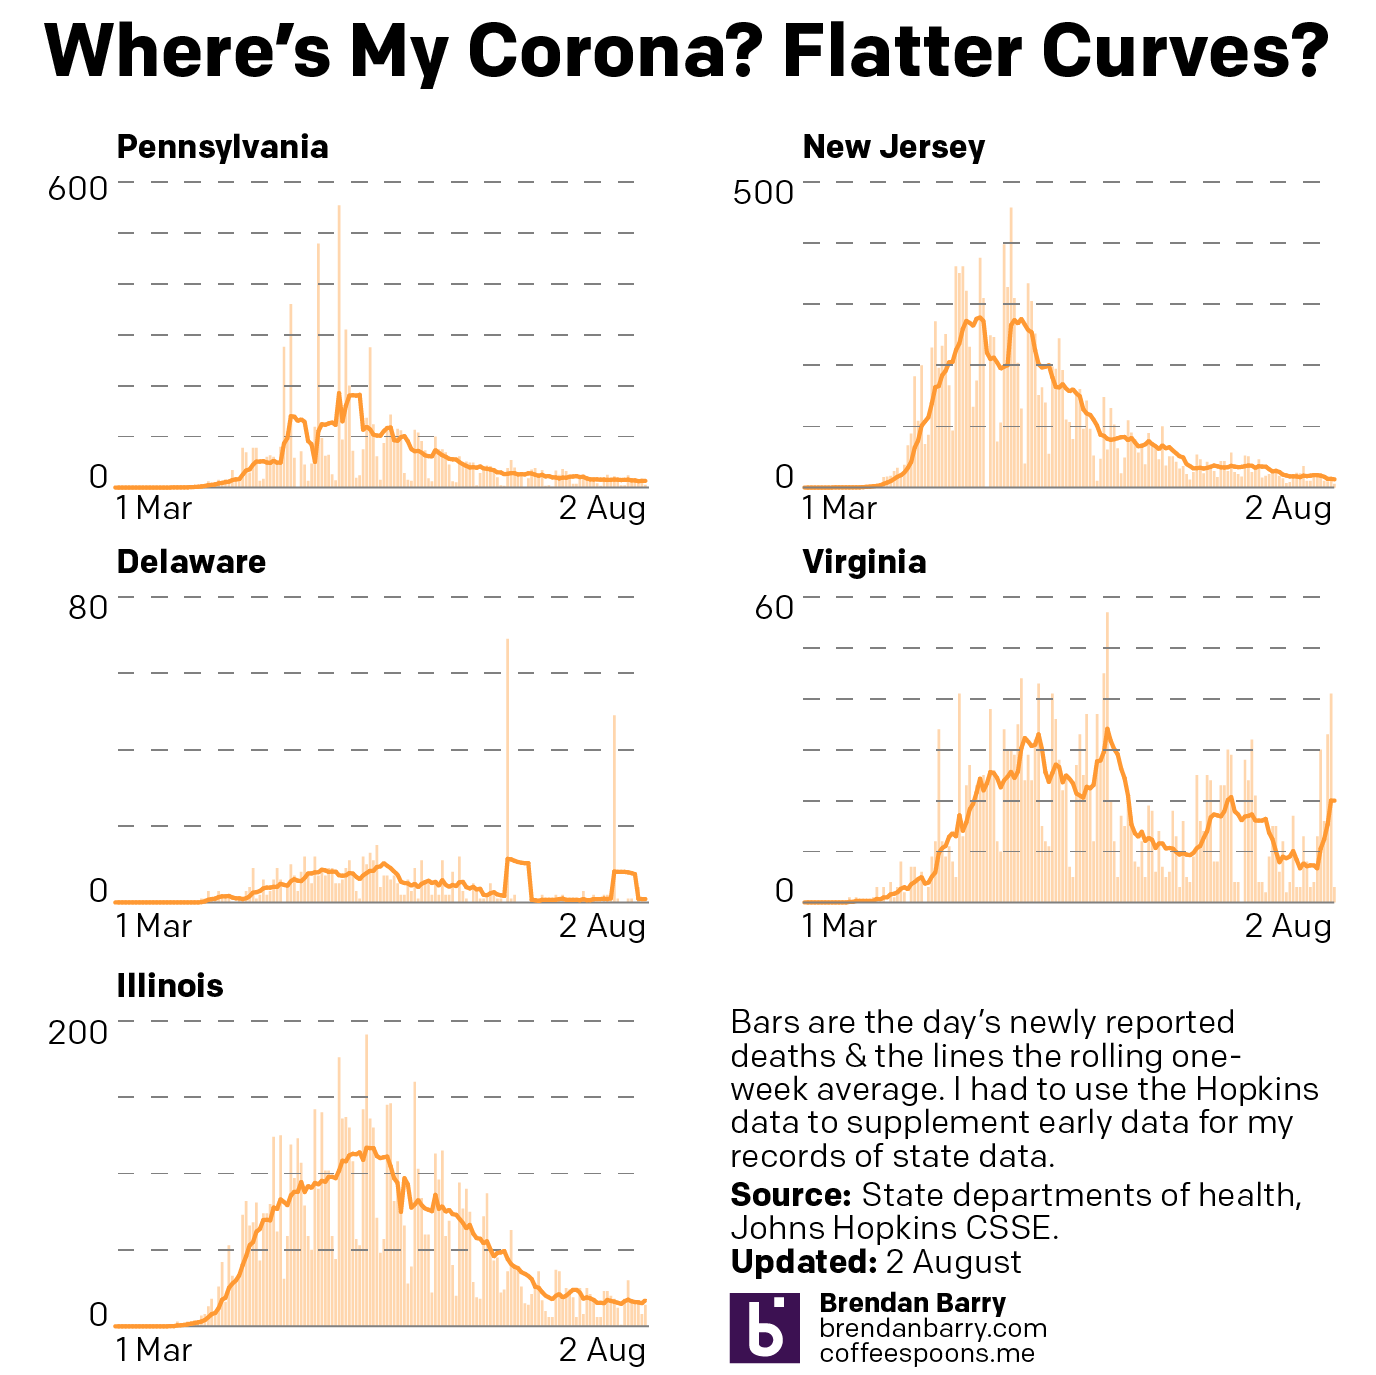
And then when we look at deaths, we generally have good news. Last week we were looking at Virginia and its working through a backlog of unreported deaths. That artificially inflated recent days, but also depressed deaths earlier in the pandemic. Beyond the old Dominion, however, deaths have remained fairly low. Only in Pennsylvania and Illinois do they hover around 20 deaths per day from the virus.

Death curves in PA, NJ, DE, AND IL.

Credit for the piece is mine.

Covid-19 Update: 21 September

Apologies for the lack of posting yesterday, but I wasn’t feeling well. I had some other things planned for today, but then some other things happened this weekend and then I took ill. But it’s still important to look at what’s going on with the pandemic, especially in the United States where it’s been disastrously handled by the White House.

As we approach 200,000 dead Americans, we still look at what’s going on in the tristate region alongside Virginia and Illinois. Specifically we compare last week’s post to this week’s post. Note that normally we look at Sunday data on Monday morning and today we’ll be looking at Monday data on a Tuesday. Both Sunday and Monday are reports from their preceding days, and so we are still looking at weekend reporting of figures. So we can expect them to be lower than workweek data.

New cases curves for PA, NJ, DE, VA, & IL.

If we compare the above chart to last week’s, we can see that Pennsylvania has decidedly reversed course. Whereas things had been headed down in terms of averages, I was worried about the days of daily new cases exceeding the average. Sure enough the average has caught up to the new cases and we’re seeing a rise in the average to levels not really seen since the summer.

New Jersey remains on the path of slowly increasing its numbers of new cases. Delaware looks to be heading back down after a small bump. We might be seeing the beginning of a decline in cases in Virginia, down from its long-running plateau of nearly 1000 new cases per day. And finally in Illinois, it’s not quite clear where things are headed at present. But for the one-day spike that raised the average, it seemed as if new cases had been in decline, but the end of that otherwise decline might have been an inflection point as the average may be trending back upwards again.

Death curves in PA, NJ, DE, VA, & IL.

Then when we look at deaths, well we see no real significant change in four of the states. But last week, we were saying Virginia was at a good spot with its latest surge cycle coming to an end. Well now look at that spike and deaths that are higher now than they were in the spring. If you follow my daily posts on social media, you’ll know that there’s a reason for this.

For the last week Virginia has been working through a backlog of deaths that were not entered into its electronic database. And so these deaths happened over the last several months. Consequently the rise, if there even is one, is not nearly as high as shown. But it also means that the earlier peaks may have been far higher than reported at the time.

Credit for the pieces is mine.

Covid-19 Update: 13 September

Apologies for the lack of posting last week. I’m on deadline for, well, today. Plus I had some technical difficulties on the server side of the blog. But it’s a Monday, so we’re back with Covid updates for Pennsylvania, New Jersey, Delaware, Virginia, and Illinois.

New cases curves for PA, NJ, DE, VA, & IL

The good news, such that it is during a global pandemic, is that in Pennsylvania, Delaware, and Illinois, the seven-day average appears to be lower than this time last week or, especially in Delaware’s situation, about to break. For the First State, I’m looking at those days prior to the weekend below the average line that, in combination with the weekend, will likely begin to push that trend downward, especially if we keep seeing fewer and fewer cases this week.

Unfortunately, some states like Virginia and New Jersey appear to be, not surging, but experiencing low and slow growth. Low and slow, while great for barbecue, is less than ideal during a pandemic. Granted, it’s better than the rapid infections we saw in March, April, and May, but it still means the virus is spreading in those communities.

Death curves in PA, NJ, DE, VA, & IL.

When we look at deaths from Covid-19 in these five states, the news is better. The only real significant level of deaths was in Virginia, but we can see that the latest little surge, which was at peak last week, has now all but abated, almost to a level not seen since the spring.

The other states remain low with, at most, deaths average about 20 per day. Again, not good, but better than hundreds per day.

Credit for the pieces is mine.

Covid-19 Update: 7 September

Yesterday was a holiday in the States, and so let’s begin this shortened week with a look at the Covid situation in Pennsylvania, New Jersey, Delaware, Virginia, and Illinois.

If we compare this morning’s charts of yesterday’s data to last Monday’s, we can see some concerning trends.

New case curves in PA, NJ, DE, VA, & IL.

In Pennsylvania, that includes a rising trend. Anecdotally, that might be tied to the outbreaks in and around universities. We see rising trends in Delaware and Virginia as well, though some of Delaware’s new numbers might be tied to some cases that failed to initially make into the state’s digital database. And so as the state begins to enter them now, it artificially inflates the new case numbers.

Illinois had an enormous spike of cases from a backlog that the state entered, over 5,000 new case in that one day. That’s going to mess with the average trend given the size of the anomaly. So we’ll need to wait until later this week to see where the trend really is.

Then in terms of deaths, the most worrying state was Virginia which last week was mid-peak. But that appears to maybe be trending back down. Though the data we have does include two day’s of weekend numbers and Tuesday’s numbers, instead of the usual “rebound” will be more of the usual weekend depressed numbers.

Death curves in PA, NJ, DE, VA, & IL.

Credit for the pieces is mine.

Covid-19 Update: 30 August

After dealing with hurricane forecast plots last Monday, we’re back to the nature-made, man-intensified disaster of Covid-19 in the United States. So in the five states we review, where are we with the pandemic?

Compared to the charts from two weeks, looking at daily new cases, in some places we are in a better spot, and in others not much has changed. In fact Illinois is the only place worse off with its seven-day average higher than it was two weeks ago, but not by dramatically much.

New cases curve in PA, NJ, DE, VA, & IL.

In fact we see in Pennsylvania, New Jersey, and Delaware that the average number of daily new cases is lower than it was two weeks ago. Virginia dipped lower, but has recently returned to approximately the same level and in that sense is in no different a place. Of course the key factor is how those trends all change over the coming week.

But what about in terms of deaths?

Deaths curve in PA, NJ, DE, VA, & IL.

Well here there is bad news in Virginia. Two weeks ago a spike in deaths there had largely subsided. Two weeks hence? We are in the middle of a third spike of deaths, reaching nearly 20 deaths per day.

Fortunately, the other four states remain largely the same, and that means few deaths per day. Indeed, for Pennsylvania and New Jersey that means deaths in the low double-digits or often in the single digits. Delaware has not reported a new death in four days. And Illinois, while up a little bit, is in the low single-digits, but generally just a few more deaths per day than Pennsylvania and New Jersey.

Credit for the piece is mine.

Covid-19 Update: 16 August

So here are the charts from the last week of Covid data in Pennsylvania, New Jersey, Delaware, Virginia, and Illinois.

When we compare last week’s update to today’s, we can see that Pennsylvania did indeed bottom out and is back on the rise and the same can probably be said for Delaware. Although a fair amount of the one-day spikes in those numbers we see today are from an outbreak in a correctional system.

Whilst Virginia did go up, by week’s end, it had settled back down to a point not dissimilar to last week. So nothing really changed and time stood still in Virginia. The same can also be loosely said for New Jersey, where it was more about fluctuations than determined rises or falls.

In Illinois, however, we finally saw a plateauing of the new cases numbers and with the slightest of declines .

New cases in PA, NJ, DE, VA, and IL.
New cases curve in PA, NJ, DE, VA, and IL.

Then in deaths we have not much to say as they remain low in New Jersey and Delaware and stable and moderate in Illinois.

Virginia’s recent spike appears to have subsided, as it’s back to nearly 10 deaths per day from the virus.

But most concerning is Pennsylvania. Here, while the numbers are still relatively low, they are on a slow and gradual rise. At this point the seven-day average is beginning to rise above 20 deaths per day.

Deaths in PA, NJ, DE, VA, and IL
Death curve in PA, NJ, DE, VA, and IL

Credit for the piece is mine.

Covid-19 Update: 9 August

Weekend data means, usually, lower numbers than weekdays. And with the exception of Delaware that’s what we have today. Some drops, like Illinois, are more dramatic than others, like New Jersey. And so we look at the seven-day trend.

And that tells a slightly different story. On the one hand we have states like Virginia and Illinois that appear to be continuing upward. The rise in Illinois has been slow and steady, but the average is approaching nearly 2000 new cases per day. In Virgina, the rise was more abrupt and the question is whether this peak has crested in recent days or if come the middle of next week it will resume rising.

In New Jersey and Delaware we see two states with does declines after some sudden spurts of new cases. Jersey had risen to nearly 500 new cases less than two weeks ago, but that’s now back down to fewer than 350. And in Delaware, while today’s number is greater than yesterday’s, the trend is still downard after being at over 100 new cases per day two weeks ago.

New cases curves for Pennsylvania, New Jersey, Delaware, Virginia, and Illinois.

Then we have Pennsylvania. At one point doing it had done so well in controlling the outbreak to bend the curve to fewer than 500 new cases per day at one point. Then as the state began to reopen, cases began to rise again in the west and now the east. But over the last week that statewide average began to fall. But in the last two days that fall appears to have potentially bottomed out. So come the middle of next week, the question will be does the downward trend continue or has the state hit a new valley before another rise?

Finally, in terms of new deaths, with the exception of Virgina, we have yet to see any rise in deaths that might correlate with the recent rises in new cases. And so nothing new there. But it’s worth pointing out that New Jersey has now reached the high single digits in terms of daily deaths from Covid-19. That’s remarkable for a state that back in April saw nearly 300 people dying every single day.

New death curves for Pennsylvania, New Jersey, Delaware, Virginia, and Illinois.

Credit for the graphics is mine.

Covid-19 Update

As I mentioned last week, I am going to try using my blog here for the weekly update on the five states people have asked me to explore. And for the second week in a row, we are basically seeing numbers down compared to previous days. But given that numbers are generally lower on the weekends, that is not terribly surprising.

The real question is by Friday, will these numbers have rebounded?

The Covid-19 curves for PA, NJ, DE, VA, and IL
The Covid-19 death curves for PA, NJ, DE, VA, and IL.

Credit for these graphics is mine.

Sunday’s Covid Numbers

I do not want this blog to become a permanent Covid-19 data site. So in my push to resume posting last week, I tried to keep to from posting the numbers and instead focused on discussing how the data is displayed.

But I hear from quite a few people via comments, DMs, emails, and text messages that they find the graphics I produce helpful. So on the blog, I’m going to try posting just one set of graphics per week. Will it always be Monday? I don’t know. On the one hand, new week, new data. But on the other, weekend numbers tend to be lower than the rest of the week and could make it seem like, yay, the numbers are starting to go down especially if you only come to my blog and only see this data once a week.

Daily cases and their rolling average for Pennsylvania, New Jersey, Delaware, Virginia, and Illinois
Daily new cases
Daily new deaths and their rolling average for Pennsylvania, New Jersey, Delaware, Virginia, and Illinois.
Daily new deaths

So yeah, we’ll see how this goes. And I’ll try to keep Tuesday–Friday to discussing the world of data visualisation, although in these days, a good chunk of it will likely revolve around Covid.

Credit for these graphics is mine.

Wednesday’s Covid-19 Data

Here we have the data from Wednesday for Covid-19.

The situation in Pennsylvania

Pennsylvania saw continued spread of the virus. Notably, Monroe County in eastern Pennsylvania passed 1000 cases. It was one of the state’s earliest hotspots. That appears to have been because it was advertised as a corona respite for people from New York, not too far to the east and by then in the grips of their own outbreak.

The situation in New Jersey

New Jersey grimly passed 5000 deaths Wednesday. And it is on track to pass 100,000 total cases likely Friday or Saturday. Almost 2/3 of these cases are located in North Jersey, with some South Jersey counties still reporting just a few hundred cases and a handful of deaths.

The situation in Delaware

Delaware passed 3000 cases and Kent Co. passed 500. While those don’t read like large numbers, keep in mind the relatively small population of the state.

The situation in Virginia

Virginia has restarted reporting deaths, this time at the county level and not the health district level. What we see is deaths being reported all over the eastern third of the state from DC through Richmond down to Virginia Beach. In the interior counties we are beginning to see the first deaths appear. And in western counties, we still see that the virus has yet to reach some locations, but counties are beginning to report their first cases.

The situation in Illinois

Illinois continues to suffer greatly in the Chicago area, and at levels that dwarf the remainder of the state. However, the downstate counties are beginning to see spikes of their own. Macon and Jefferson Counties each saw increases of 30–40 cases in just 24 hours.

Preview(opens in a new tab)

How about those curves?

A longer-term look at the states shows how the states diverge in their outbreaks. Pennsylvania looks like it might be forcing the curve downward whereas New Jersey appears to have more plateaued. Earlier I expressed concern about Virginia, which does now appear to have not peaked and continues to see an increasing rate of spread. Then we have Illinois, which may have plateaued, but we need to see if yesterday’s record amount of new cases was a blip or an inflection point. And in Delaware a missing day of records makes it tricker to see what exactly the trend is.

Credit for the piece is mine.