California Budget 2013–14

Yesterday I looked at the aboriginal Canadian identity infographic and wondered if bubbles in a bubble suffice for understanding size and relationship. Today we look at an interactive graphic from the Los Angeles Times where I do not think the bubbles suffice.

California Budget 2013–4

In this graphic, I cannot say the bubbles work. Besides the usual difficulty in comparing the sizes of bubbles, too many of the bubbles are spaced too far apart. These white gaps make it even more difficult to compare the bubbles. Furthermore, as you will see in a moment, it is difficult to see which programmes receive more than others because there is no ranking order to the bubbles.

Below is a quick data sketch of the state funds only data for 2013 and 2012.

California Budget 2013–14

While I did not spend a lot of time on it, you can clearly see how simply switching to a bar chart allows the user to see the rank of programmes by state funding. It is not a stretch to add some kind of toggle function as in the original. One of the tricky parts is the percent growth. You will note above that my screenshot highlights high speed rail; the growth was over 3000%. That is far too much to include in my graphic, so I compared the actuals instead. That is one of the tradeoffs, but in my mind it is an acceptable one.

Credit for the original goes to Paige St. John and Armand Emamdjomeh.

Nate Silver Predicts the Presidential Election

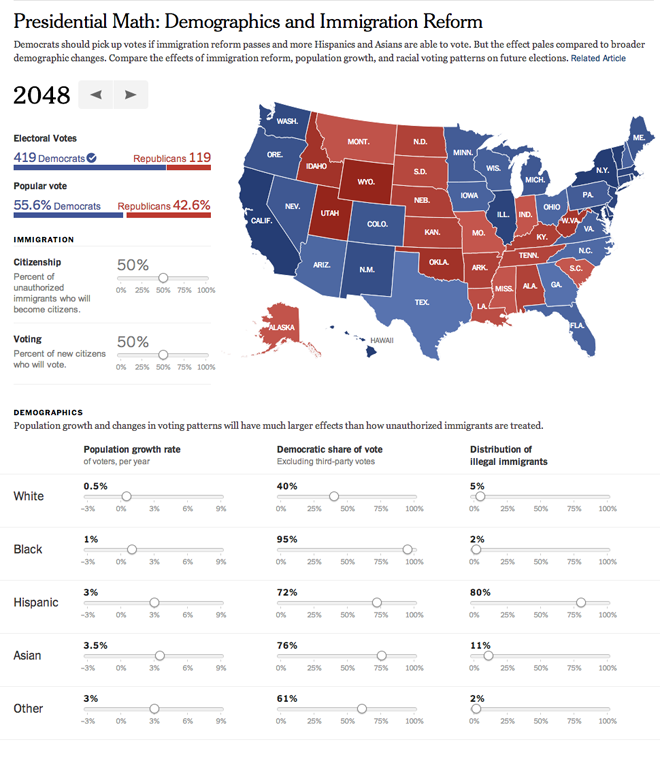
Of 2048. Well, kind of. Lately the country has been talking a lot about immigration and its impacts because of this bipartisan desire to achieve some kind of result on an immigration bill working its way through the Senate. One of the common thoughts is that if we legalise a whole bunch of illegals or document most of the undocumented (I’ll leave the language for you to decide), the new American citizens will overwhelmingly vote Democratic and there goes the Republic(an Party).

Nate Silver—yes, that Nate Silver who accurately predicted the presidential results and a whole bunch of other stuff too—looked at a more complex and more nuanced set of demographic variables and found that the aforementioned argument greatly oversimplifies the results. The problem is not entirely the entry of newly documented or illegal workers. Instead, there are systemic demographic issues.

So here comes the New York Times with an excellent data explorer and forecast modeller. You can set the year to examine and then set the results of the immigration debate with how many immigrants are made legal/documented and then how many of them vote. After that you can begin to adjust population growth, voting patterns, &c. to see how those affect the elections. (The obvious caveats of acts of god, party platforms, candidates, &c. all hold.)

2048 Results
2048 Results

The fascinating bit is that if you keep the demographic patterns as they are currently, adjusting the immigration factors at the outset have very little impact on the results. The country is moving towards the current Democratic platform. Even if 0% of the undocumented/illegal immigrants become documented/legal, and if 0% of 0% vote, the result is still a landslide for the Democrats. The real changes begin to happen if you adjust the population growth rates of the legal/documented citizens and voters. But those patterns/behaviours are a lot more difficult to adjust since you can’t legislate people to have more babies.

All in all a fascinating piece from the New York Times. The controls are fairly intuitive, drag sliders to adjust percentages. The sliders have clear labels. And the results on the map are instantaneous. Perhaps the only quirk is that the ranges of the colours are not detailed. But that might be a function of forecasting the data so far into the future and having growing ranges of certainty.

Credit for the piece goes to Matthew Bloch, Josh Keller, and Nate Silver.

The Republicans and Hispanic Voters

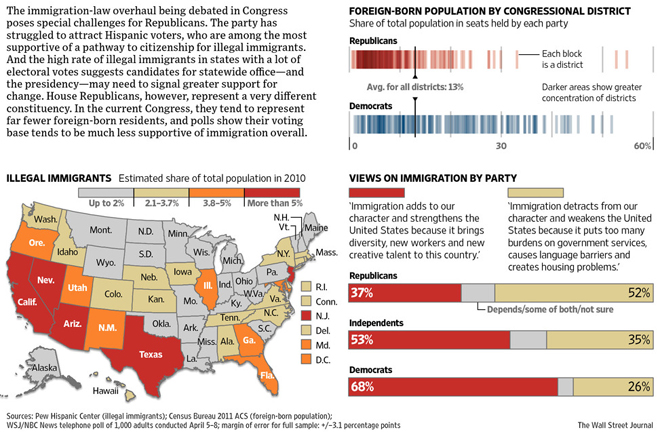
Following on last week’s posts on immigration comes today’s post on how that might impact Republican politics. Well I say might but pretty much mean definitely. The graphic comes from the Wall Street Journal and it takes a look at the demographic makeup of states, House congressional districts and then survey data on immigration broken into Republicans vs. Democrats.

The GOP's Tricky Terrain

I think the piece is a good start, but at the end of the introductory paragraph is the most salient point about the piece. And unfortunately the graphic does not wholly embody that part. Of course within limited time and with limited resources, achieving that sort of completeness is not always possible. That said I think overall the piece is successful, it just lacks that finishing graphical point.

Credit for the piece goes to Dante Chinni and Randy Yeip.

More Effective Cartograms

The other day I posted an example of a good cartogram, actually a pair of good ones from the New York Times. Today, I wanted to share another good example. The Economist created this cartogram, map of Great Britain’s constituencies. What is perhaps most effective in this chart, even more so than in the Times’, is its use of a “traditional” map form for comparison. You quickly get a sense of how large rural Britain’s constituencies are compared to those of London.

Mapping Britain
Mapping Britain

Credit for the piece goes to the Economist.

Immigrants’ Paths to Citizenship

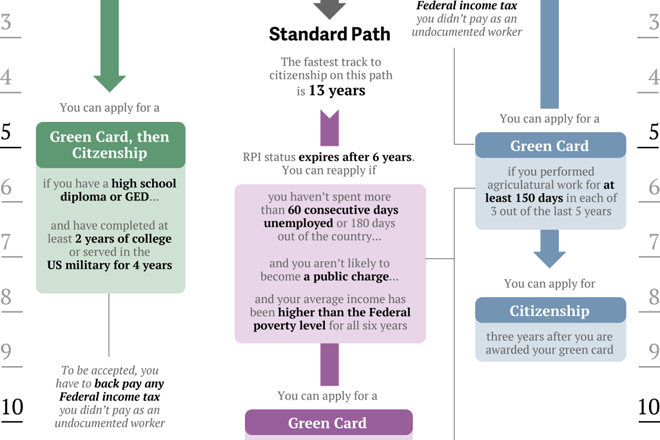
Last week several important stories were drowned out by the bombings in Boston. One of those stories was that a group of senators agreed on a compromise immigration bill that would offer undocumented workers in the United States definite plans to citizenship. Of course now that we know the suspects in the Boston bombings were legal, documented immigrants—one of whom was a naturalised citizen—the immigration debate might take on an entirely different character.

Here is a cropping from a graphic put together by Quartz that explains how the different paths work.

Cropping of different paths to US citizenship

Credit for the piece goes to Ritchie King.

Arming a Civil War

War is good for the arms business. So a long and bloody civil war in Syria is just what arms manufacturers want. And while arming the Syrian government is fairly easy, how do you get weapons and ammunition to the Syrian rebels? The New York Times maps the flow of arms through an almost Sankey-like diagram where the number of flights determines the width of the arrows from source to destination.

And while that would be sufficient information to warrant a map, the Times adds a further layer by showing when the flights arrived. Clearly the civil war began with a certain number of arms. But as the war has both drawn on and become bloodier, new weapons are needed and ammunition needs to be restocked. Those needs likely explain a recent surge in flights.

Map of routes used to arm Syrian opposition forces

Credit for the piece goes to Sergio Peçanha.

The Economies of Europe

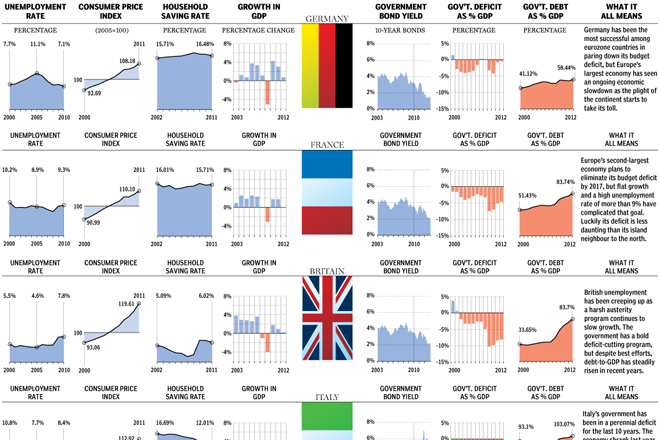
Cyprus has been in the news over the course of this past week because its financial system almost brought the country to bankruptcy. And that has meant trouble for European markets. So now it’s time to look at the economies of Europe once again. And the National Post has done a great job using clear and concise small multiples to examine key metrics for the ten largest European economies—not necessarily EU economies mind you. But at the end of each row, they summed up the country’s outlook in just one or two sentences.

Cropping of the overview for Europe's largest economies

Credit for the piece goes to Richard Johnson, Grant Ellis, John Shmuel, and Andrew Barr.

Diversity in Politics

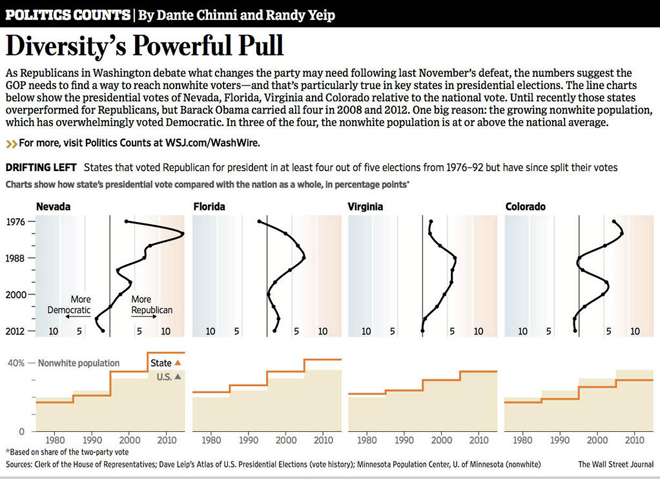
The Republican Party has a problem. Its policy platform appeals to “angry white guys” and they are not being bred fast enough. And as the quotes indicate, that isn’t my idea. That comes from no less than Lindsey Graham, Republican Senator for South Carolina. The Wall Street Journal looks at just four states previously safely Republican that are now trending Democratic.

Diversity in Politics

Credit for the piece goes to Dante Chinni and Randy Yeip.

Women in the US Senate

Women are half the population, but only twenty percent of the upper chamber of the United States Congress. As this great interactive timeline from the New York Times shows, at least that inequity has been narrowing over the last several elections.

The infographic comes in two main views. The first highlights women in the Senate and assigns them chronologically and then colours them by party. Important or notable senators are annotated appropriately. This view also shows the breakdown of women in the Senate at any one time in the small chart in the upper-left. Mousing over senators then provides a little bit of information about the woman in question.

Women in the US Senate

But to put it in perspective, by selecting All Senators, the user can see the whole elected history of the US Senate—remember, prior to the 1920s you did not directly elect senators. That makes for a lot of grey bars, i.e. a lot of men.

Men and Women in the US Senate

Credit for the piece goes to Hannah Fairfield, Alan McLean and Derek Willis.

Wealth Inequality in the United States

Reality is never what you think. Over at the Washington Post’s Wonkblog I found a post about a YouTube video looking at wealth inequality in the United States. It looks at a study that compared what Americans thought the distribution of wealth in the United States is vs. what they think is an ideal distribution. And then the video compares that to the actual distribution.

The video is rather solid and does a fairly good job at explaining its point. And those unsure about wealth inequality and how it is different from and sometimes more meaningful than income inequality should read the post along with the video.

Wealth inequality
Wealth inequality

Credit for the video goes to a YouTube user named Politizane.