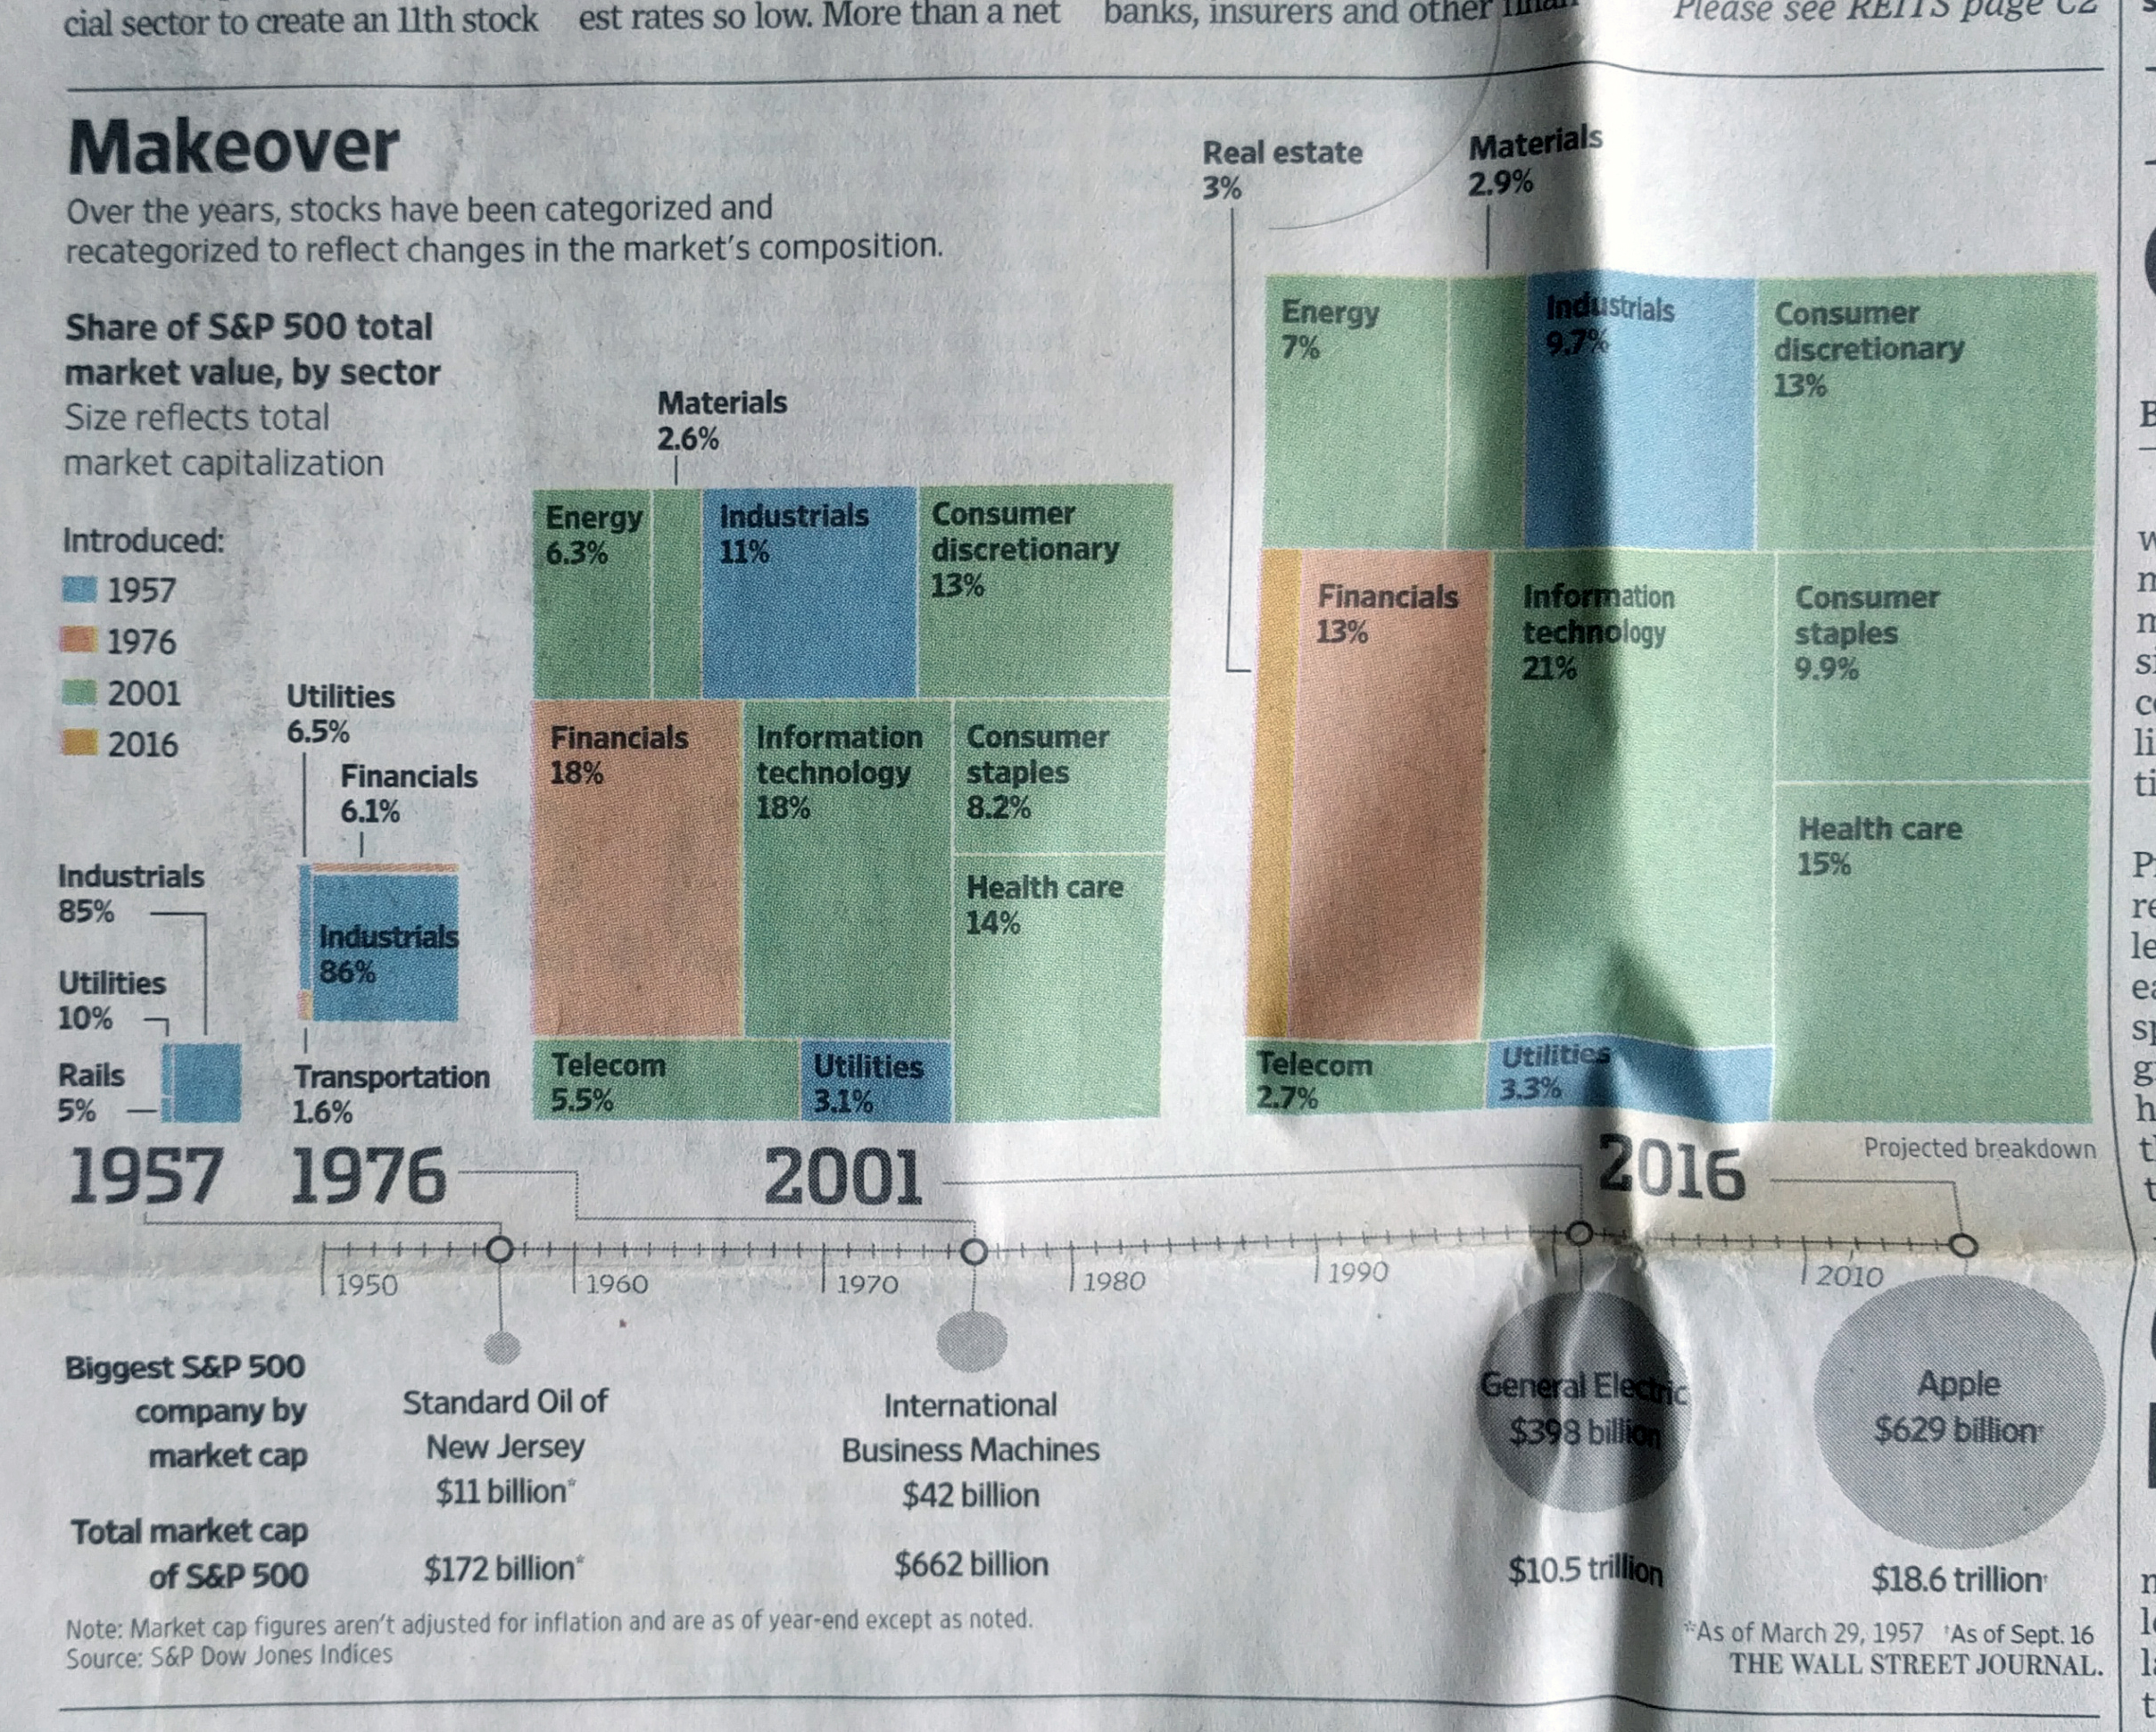
I found myself doing a bit of summer cleaning yesterday and I stumbled upon a few graphics of interest. This one comes from a September 2016 Wall Street Journal article about the changes in the S&P 500, a composite index of American stocks, some of the 500 largest.
In terms of the page design, if it were not for that giant 1/6 page advert in the lower right corner, this graphic could potentially dominate the visual page. The bulk of it sits above the page’s fold and the only other competing element is a headshot to the upper-right. Regardless, it was clearly enough to grab my attention as I was going through some papers.

As for the graphic itself, I probably would have some done things differently.

To start, are these actual tree maps? Or are they things attempting to look like tree maps? It is difficult to tell. In an actual tree map, the rectangles are not just arranged by convenience, as they appear to be here. Instead, they are in descending—or perhaps occasionally ascending—area, within groupings.
The groupings would have been particularly powerful here. Imagine instead of disparate blue boxes for industrials and utilities in the latter two years that they were combined into a single box. In 2001, that box may have been larger than the orange financials. Then by 2016, you would have seen those boxes switch places—in both years well behind the green boxes of 2001 debuts. If instead the goal was to show the percentages, as it might be given each percentage is labelled, a straight bar chart would have sufficed.
I am not always a fan of the circle for sizes along the bottom. But the bigger problem I have here is the alignment of the labelling and the pseudo-tree maps. One of my first questions was “how big are these years?”. However, that was one of the last points displayed, and it is separated from the tree maps from the listing of the largest company in the index from that year. I would have kept the total market cap closer to the trees, and perhaps used the whole length of line beneath the trees and instead pushed the table labels somewhere between the rather large gap from 1976 and 2001.
Credit for the piece goes to the Wall Street Journal graphics department.
