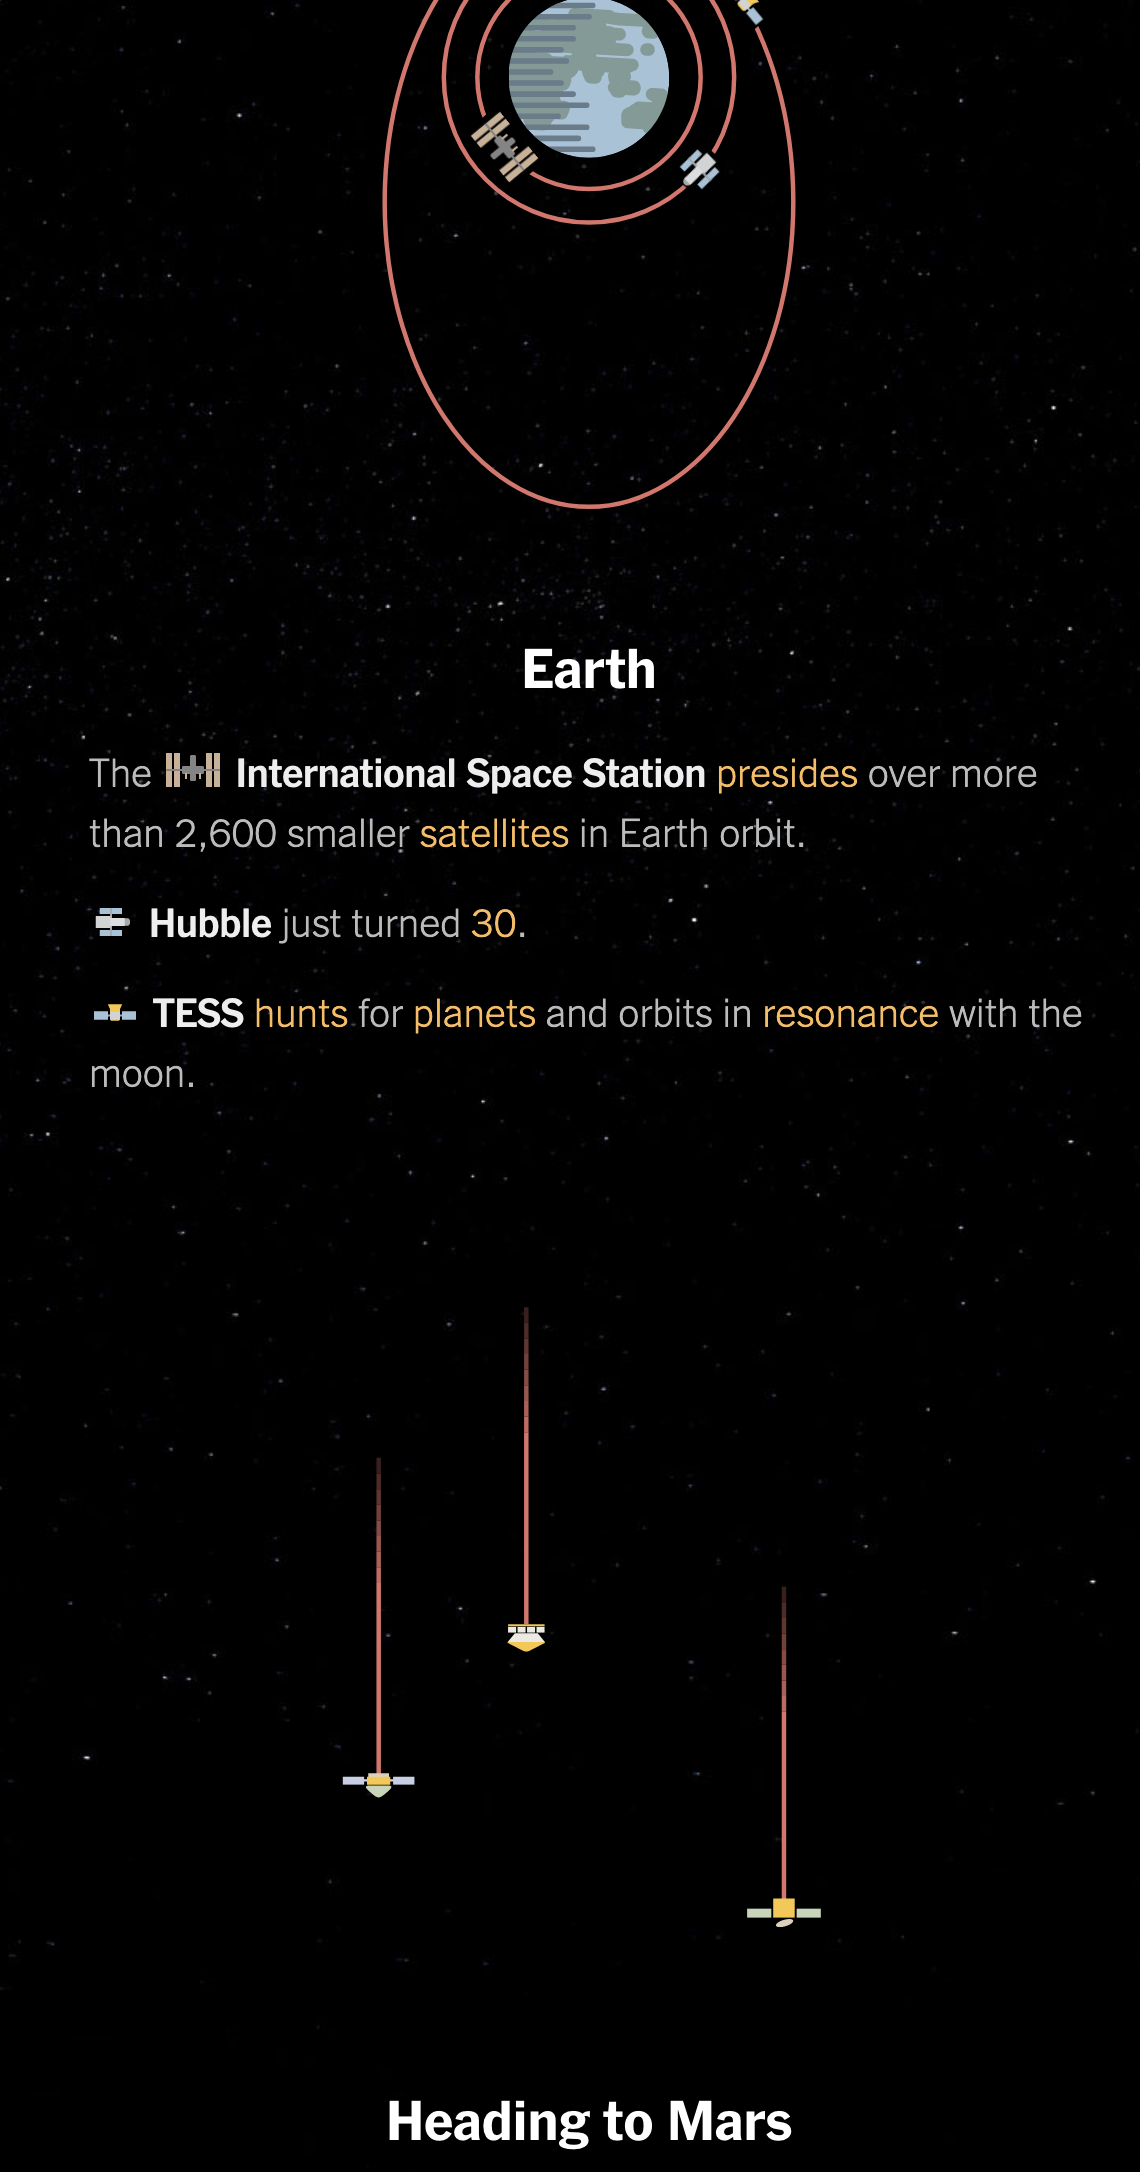
Early tomorrow morning, weather permitting, NASA’s Perseverance rover will blast off from Cape Canaveral on a six-plus month trip to Mars. There, hopefully it will land successfully and join all the rovers that have come before.
And so this piece from the New York Times feels appropriate. It’s a great illustration of all the spacecraft we have sent into space, including the active and inactive, with some notable exceptions.
I really like how it pays attention not just to the planets and their satellites (like the Moon), but also the comets, asteroids, and even the Lagrange points. And it does this all with small illustrations of the spacecraft.
In science news, we turn to graphics about planets and things. Specifically we are talking about exoplanets, i.e. planets that exist outside our solar system. Keep in mind that we have only been able to detect exoplanets since the 1990s. Prior to then, how rare was our system with all our planets? It could have been very rare. Now we know, probably not so much.
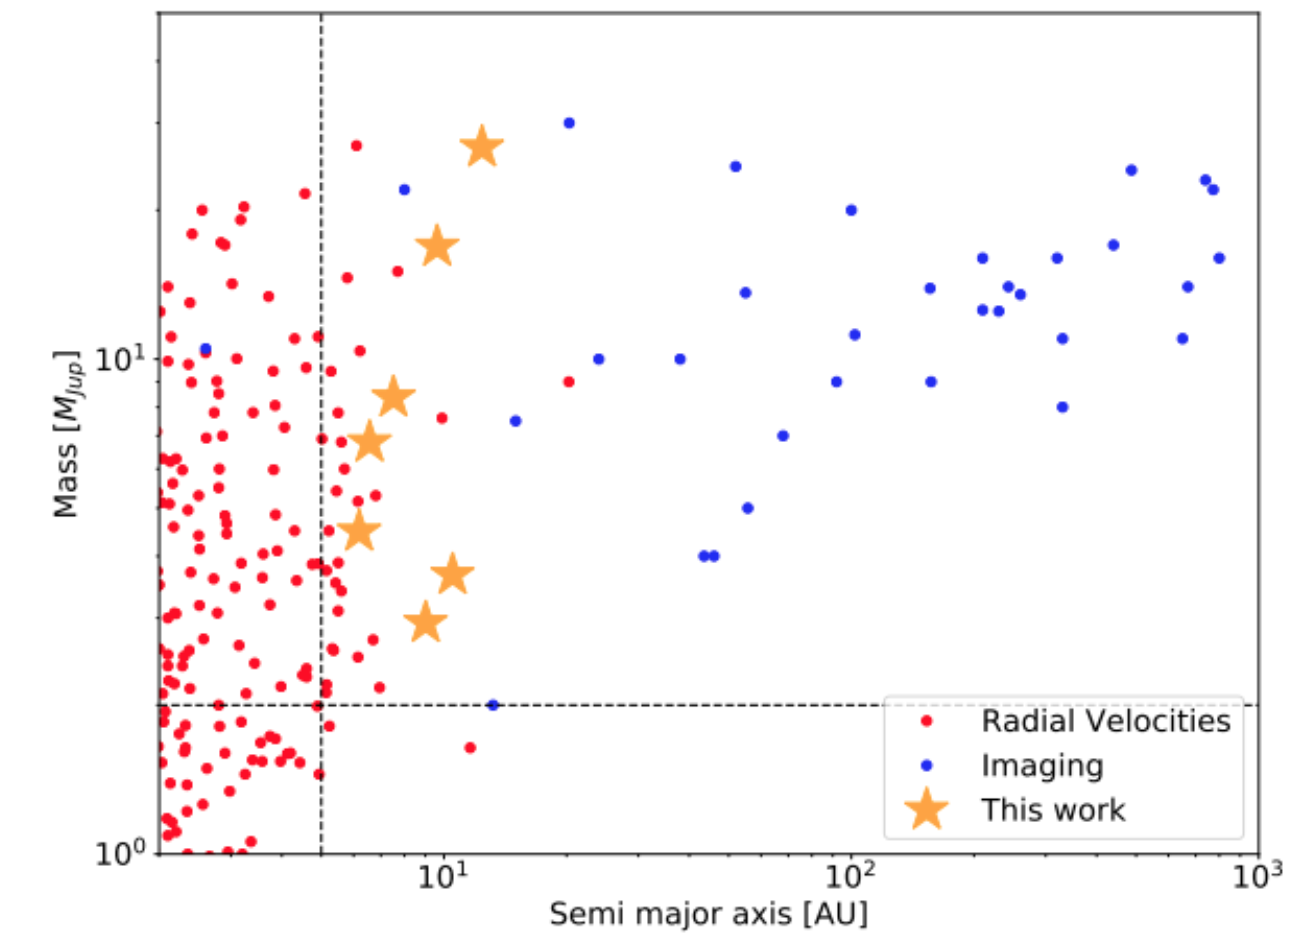
But, in all of that discovery, we are missing entire types of planets. This article published by Forbes does a nice job explaining why. But one of the key types of planets that we have been unable to discover heretofore have been: intermediately distant, giant planets. Think the Jupiters and Saturns of our system. Prior to now we could detect massive Jupiter-like planets orbiting super near to their distant stars. Or, we could detect super massive planets orbiting very far away. The in-betweeners? Not so much.
There’s still a pretty wide gap out there…
The above screenshot does a good job of showing where new detection methods have allowed scientists to begin to fill in the gaps. It shows how there is an enormous gap between what we have discovered and how they have been discovered. And the article does a nice job explaining how the science works in that only now with our longer periods of observation will help resolve certain issues.
From a design standpoint, this isn’t a super complicated graphic. It does rely upon a logarithmic scale, which isn’t common in non-scientific or academic papers. But this graphic comes from that environment, so it makes a lot of sense. The article is full of graphics from third-party sources, but I found this the most informative because of that very gap it highlights and how the new work (the stars) begin to fill it in.
Credit for the screenshotted piece goes to E. L. Rickman et al.
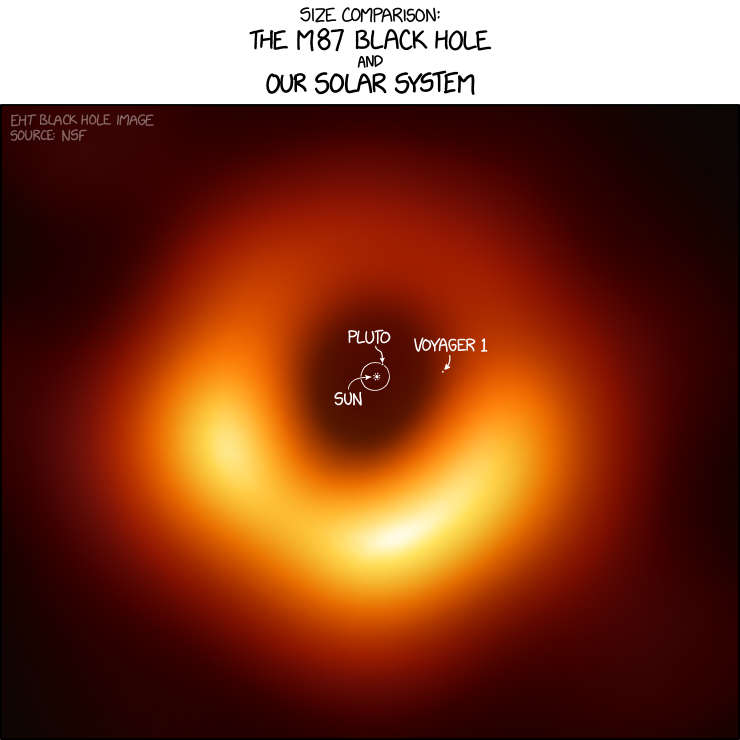
Last week we looked at the amazing news that astronomers had finally photographed a black hole. Or, technically, the shadow of a black hole since the black hole itself cannot be seen. I want to return to that news, because it’s awesome. And because xkcd published a piece that annotated the image to show the size of things by comparison.
I had mentioned that it was a supermassive black hole, some of the biggest of the bigs. And M87 is a beast.
On Sunday night I went to see the English rock band Muse perform here in Philadelphia. The concert was to support their latest album, but of course they played Starlight, a song which gave us its respective album’s title: Black Holes and Revelations.
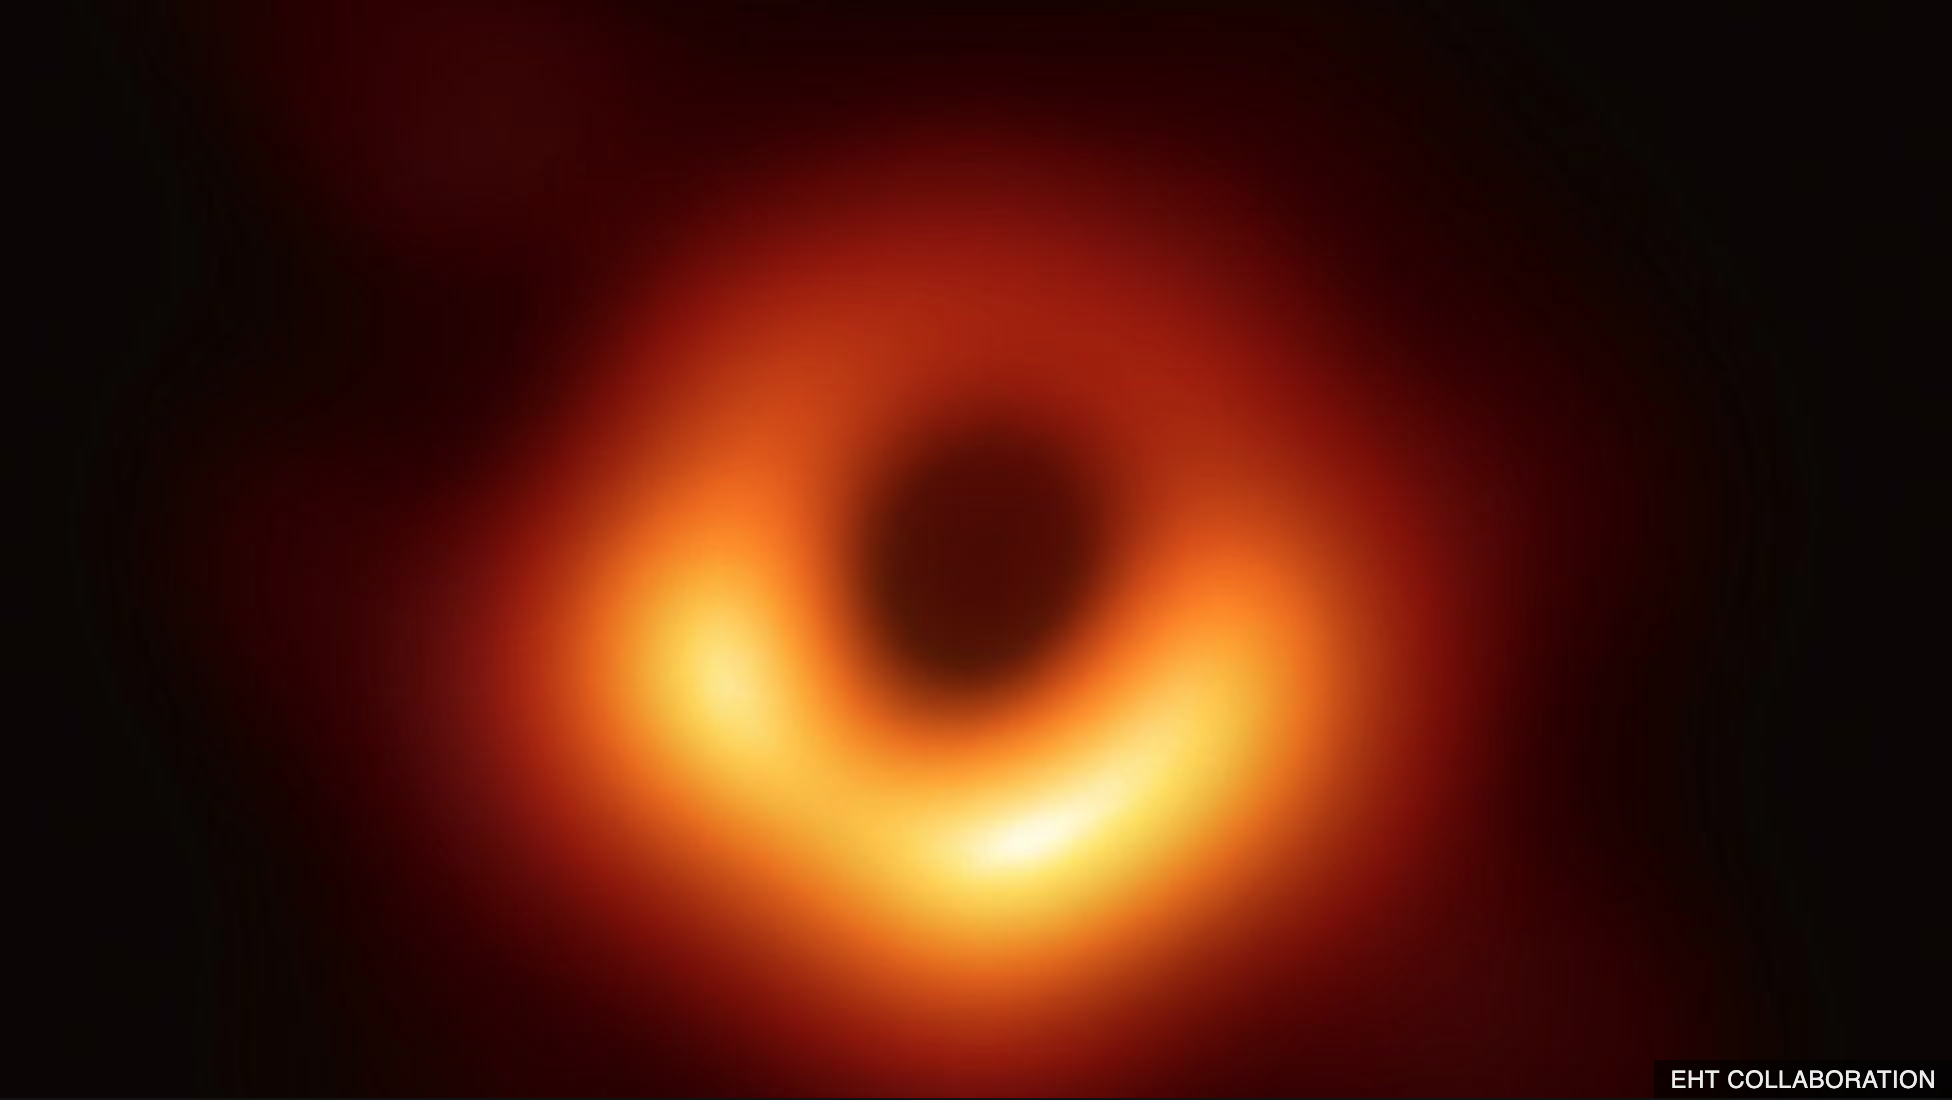
Then on Wednesday, scientists announced that for the very first time, we have actually been able to take a photograph of a blackhole. This one is a supermassive black hole at the heart of the M87 galaxy, some 500 million trillion kilometres distant.
Hopes and expectations?
The bright light, or ring of fire, is the heated gas before falling beneath the event horizon, which here is the black disk. Beyond that point, the gravitational force is so strong that not even light can escape. And of course without light escaping to be seen, a black hole cannot be directly imaged. Instead, we have to look for its accretion disc.
It’s just cool.
Credit for the piece goes to the Event Horizon Telescope Collaboration.
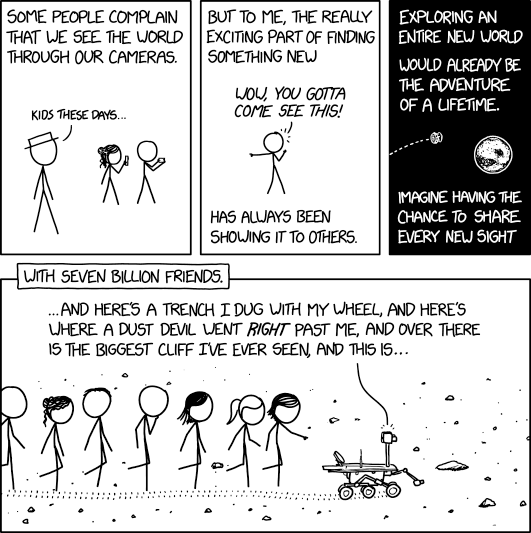
Last summer NASA’s Martian exploration rover Opportunity went dark as its solar panels, needed to power the golf-cart sized explorer, were covered in dust from a planet-wide dust storm. Everyone hoped that over the following months the light Martian winds and dust devils would wipe clean the dust from the solar panels and the rover could recharge its batteries, turn on its heaters, and resume contact with Earth. It hasn’t. Consequently, on Wednesday NASA called Opportunity’s mission complete. And thanks to xkcd we have a proper little farewell.
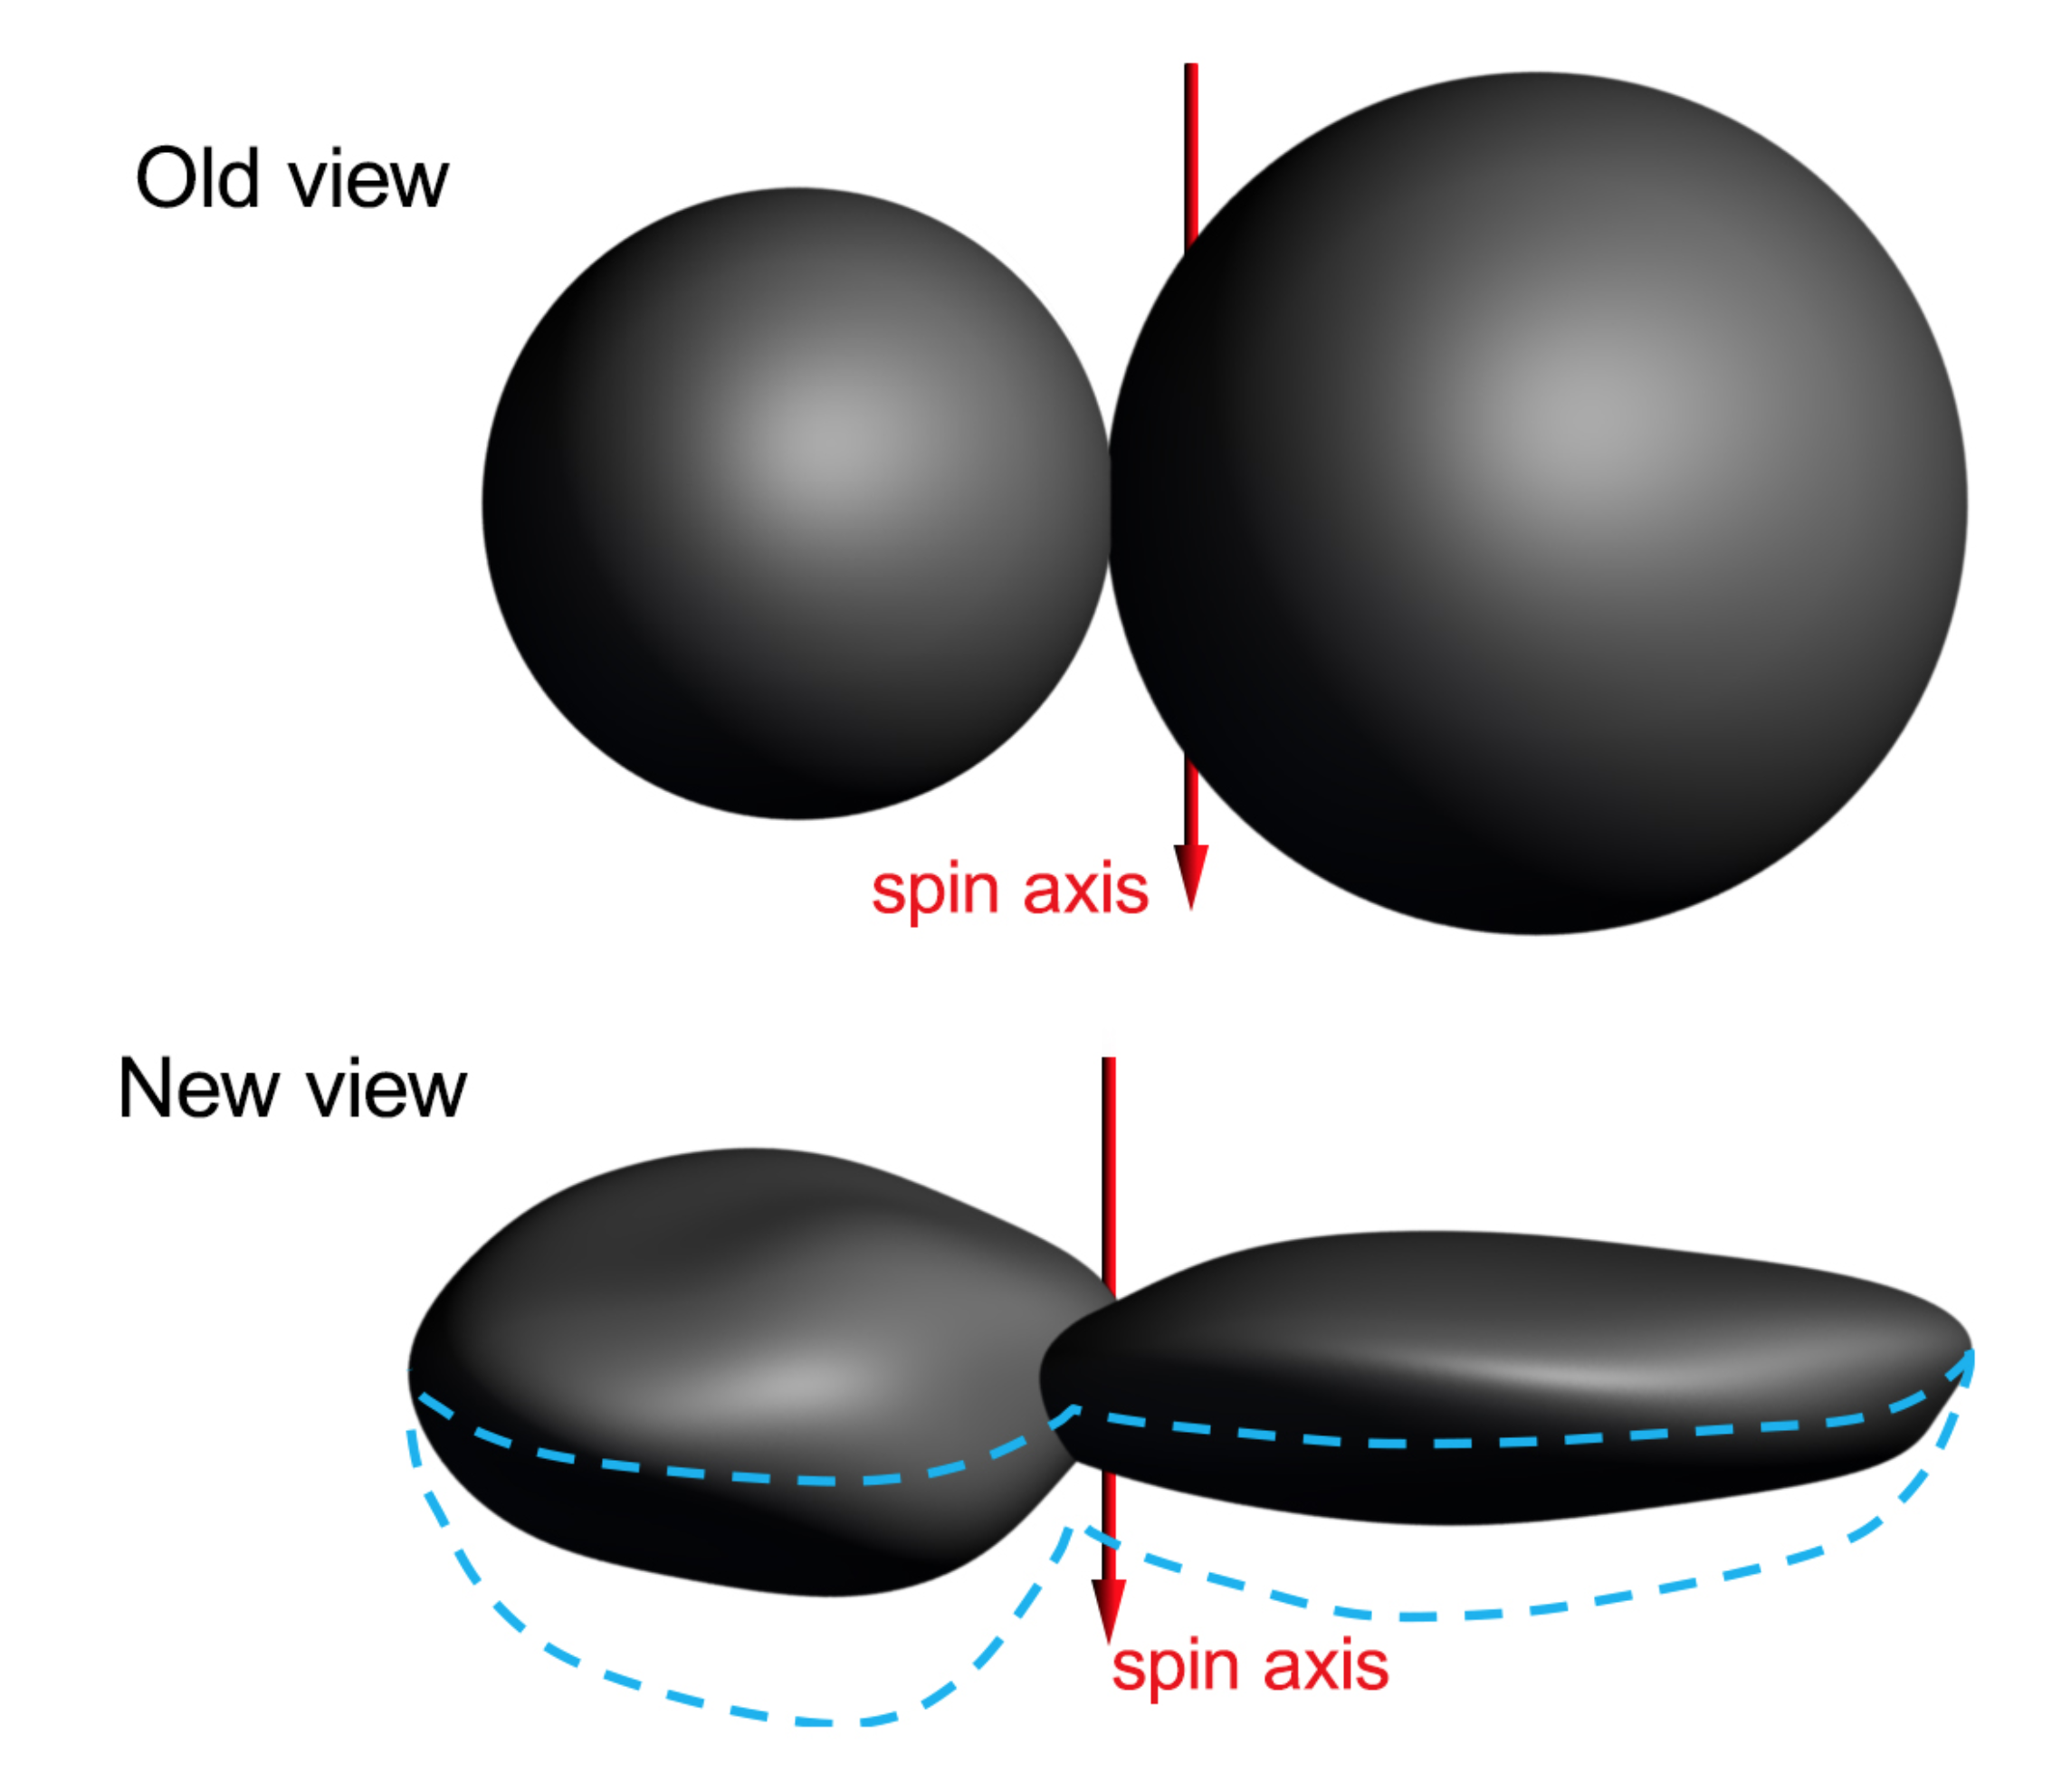
One of the really neat things about space exploration has been the New Horizons probe that raced past Pluto, giving us the image of the now famous heart shape on the dwarf planet. But as it raced past a Kuiper Belt object named Ultima Thule on New Year’s, we received some tantalising first images of a snowman in space. Basically, two spheroid bodies fused together like a snowman or a peanut.
Except it’s not.
It probably doesn’t taste like a walnut pancake, though…
This is a fascinating graphic produced by the science research teams that show how the latest downloaded photographs from New Horizons—it will take many more months for the full set—show Ultima Thule is not very snowman-like in its shape. Instead, it is far flatter and more, in their words, shaped like a dented walnut and a pancake.
The article has some additional material that show how that spin axis changes the view. They are short videos, but if you are interested in space things, it is neat to see. We are accustomed to seeing spherical objects in orbit around the sun. Not pancakes.
Credit for the piece goes to NASA, Johns Hopkins University Applied Physics Laboratory, and Southwest Research Institute.
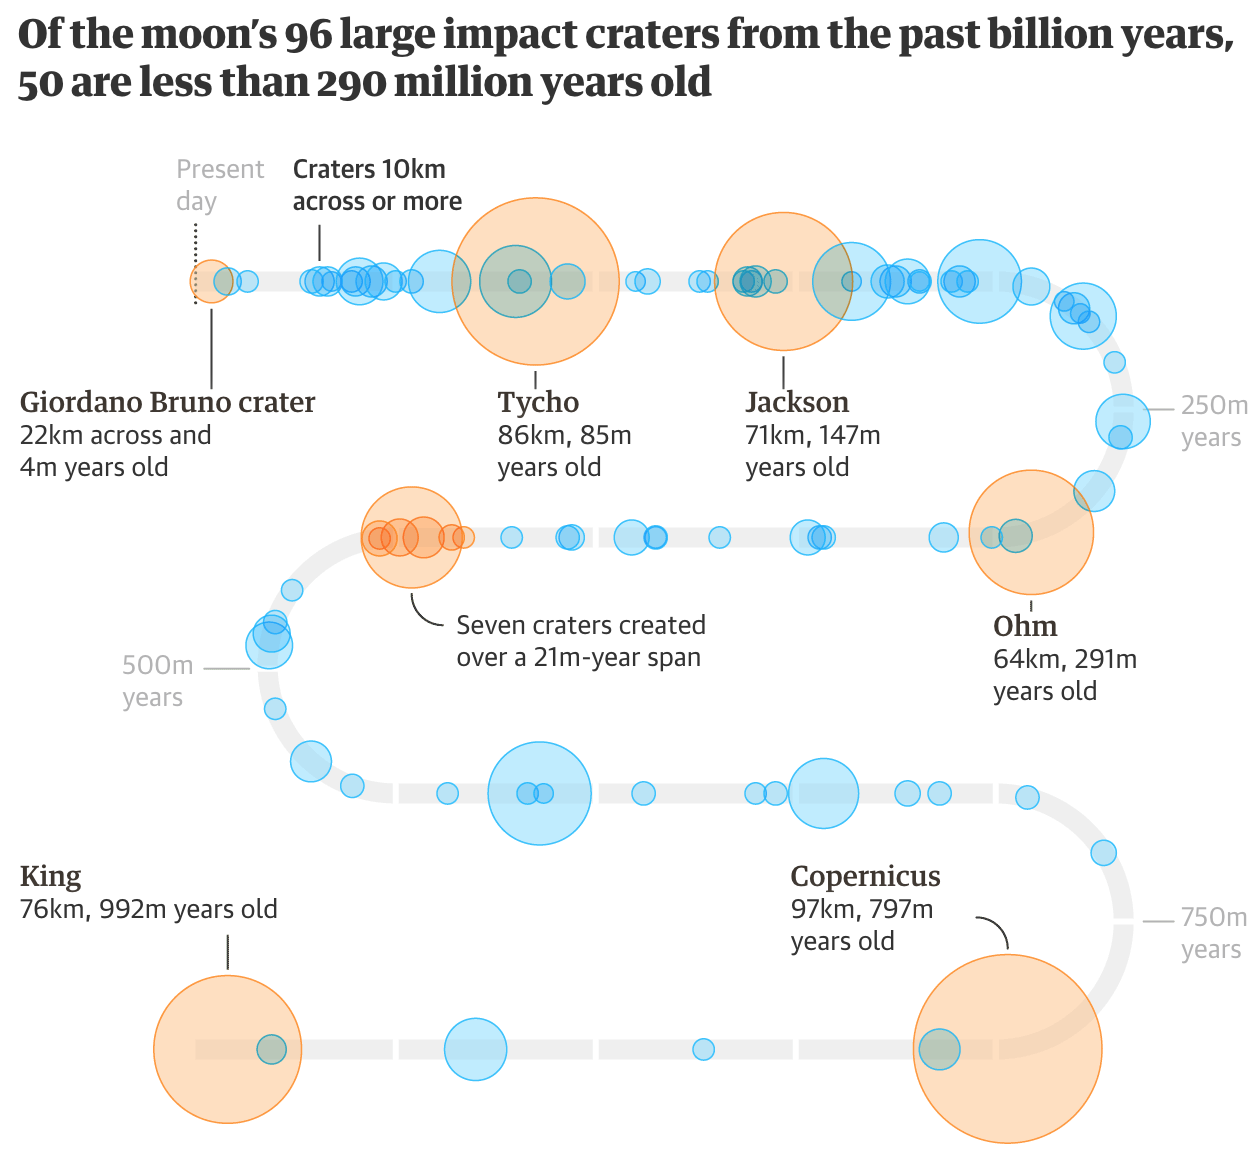
I hope everybody enjoyed their holiday. But, before we dive back into the meatier topics of the news, I wanted to share this serpentine graphic from the Guardian I discovered last week. Functionally it is a timeline charting the size of 96 known large asteroid impact craters on the Moon, between 80ºS and 80ºN.
Impacts on the Moon
The biggest question I have is whether the wrapping layout is necessary. I would prefer a more simplistic and straightforward, well, straight timeline, but I can imagine space constraints forcing the graphic into this box—either for the digital version and/or the likely print version.
The transparencies help to give a sense of density to the strikes, especially in the later years. And the orange ones highlight important or well-known craters like Tycho.
I do wonder, however, if the designer could have added a line at the 290 million years point. Since the graphic’s title calls that year out in particular, it might help the audience more quickly grasp the graphic’s…impact. In theory, the reader can more or less figure it out from the highlighting of the Ohm impact crater that is listed as 291 million years old. But a small grey line like those for the 250 million year increments could have been a nice little touch.
Overall, however, it’s nice to see a compact and helpful space graphic.
Credit for the piece goes to the Guardian graphics team.
For those of my readers in Europe, Africa, Asia, Australia, and South America, you are in for a treat tonight as you get to experience the longest lunar eclipse of the year. For those of us in North America, i.e. Canada, the United States, and Mexico, we get nothing.
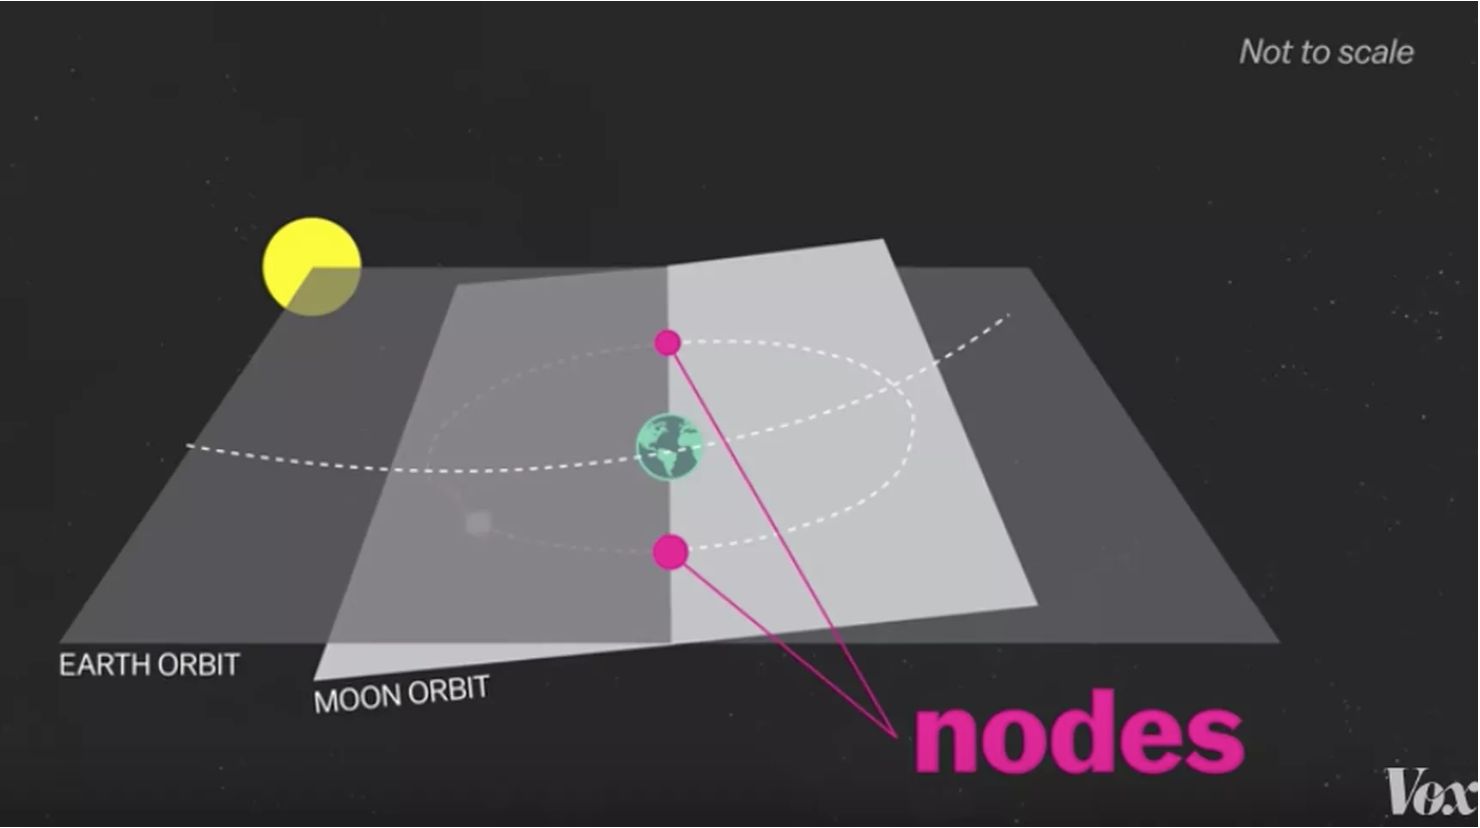
So for a reminder, we turn to this nice piece from Vox that explains a lunar eclipse and why they are not as common as one might expect.
It’s all about the nodes
The piece uses illustrations like these from Vox and supplements them with graphics from NASA. The whole piece is worth a read, especially if you enjoy space things.
Enjoy your Friday, and if you live anywhere but North America, enjoy your lunar eclipse tonight.
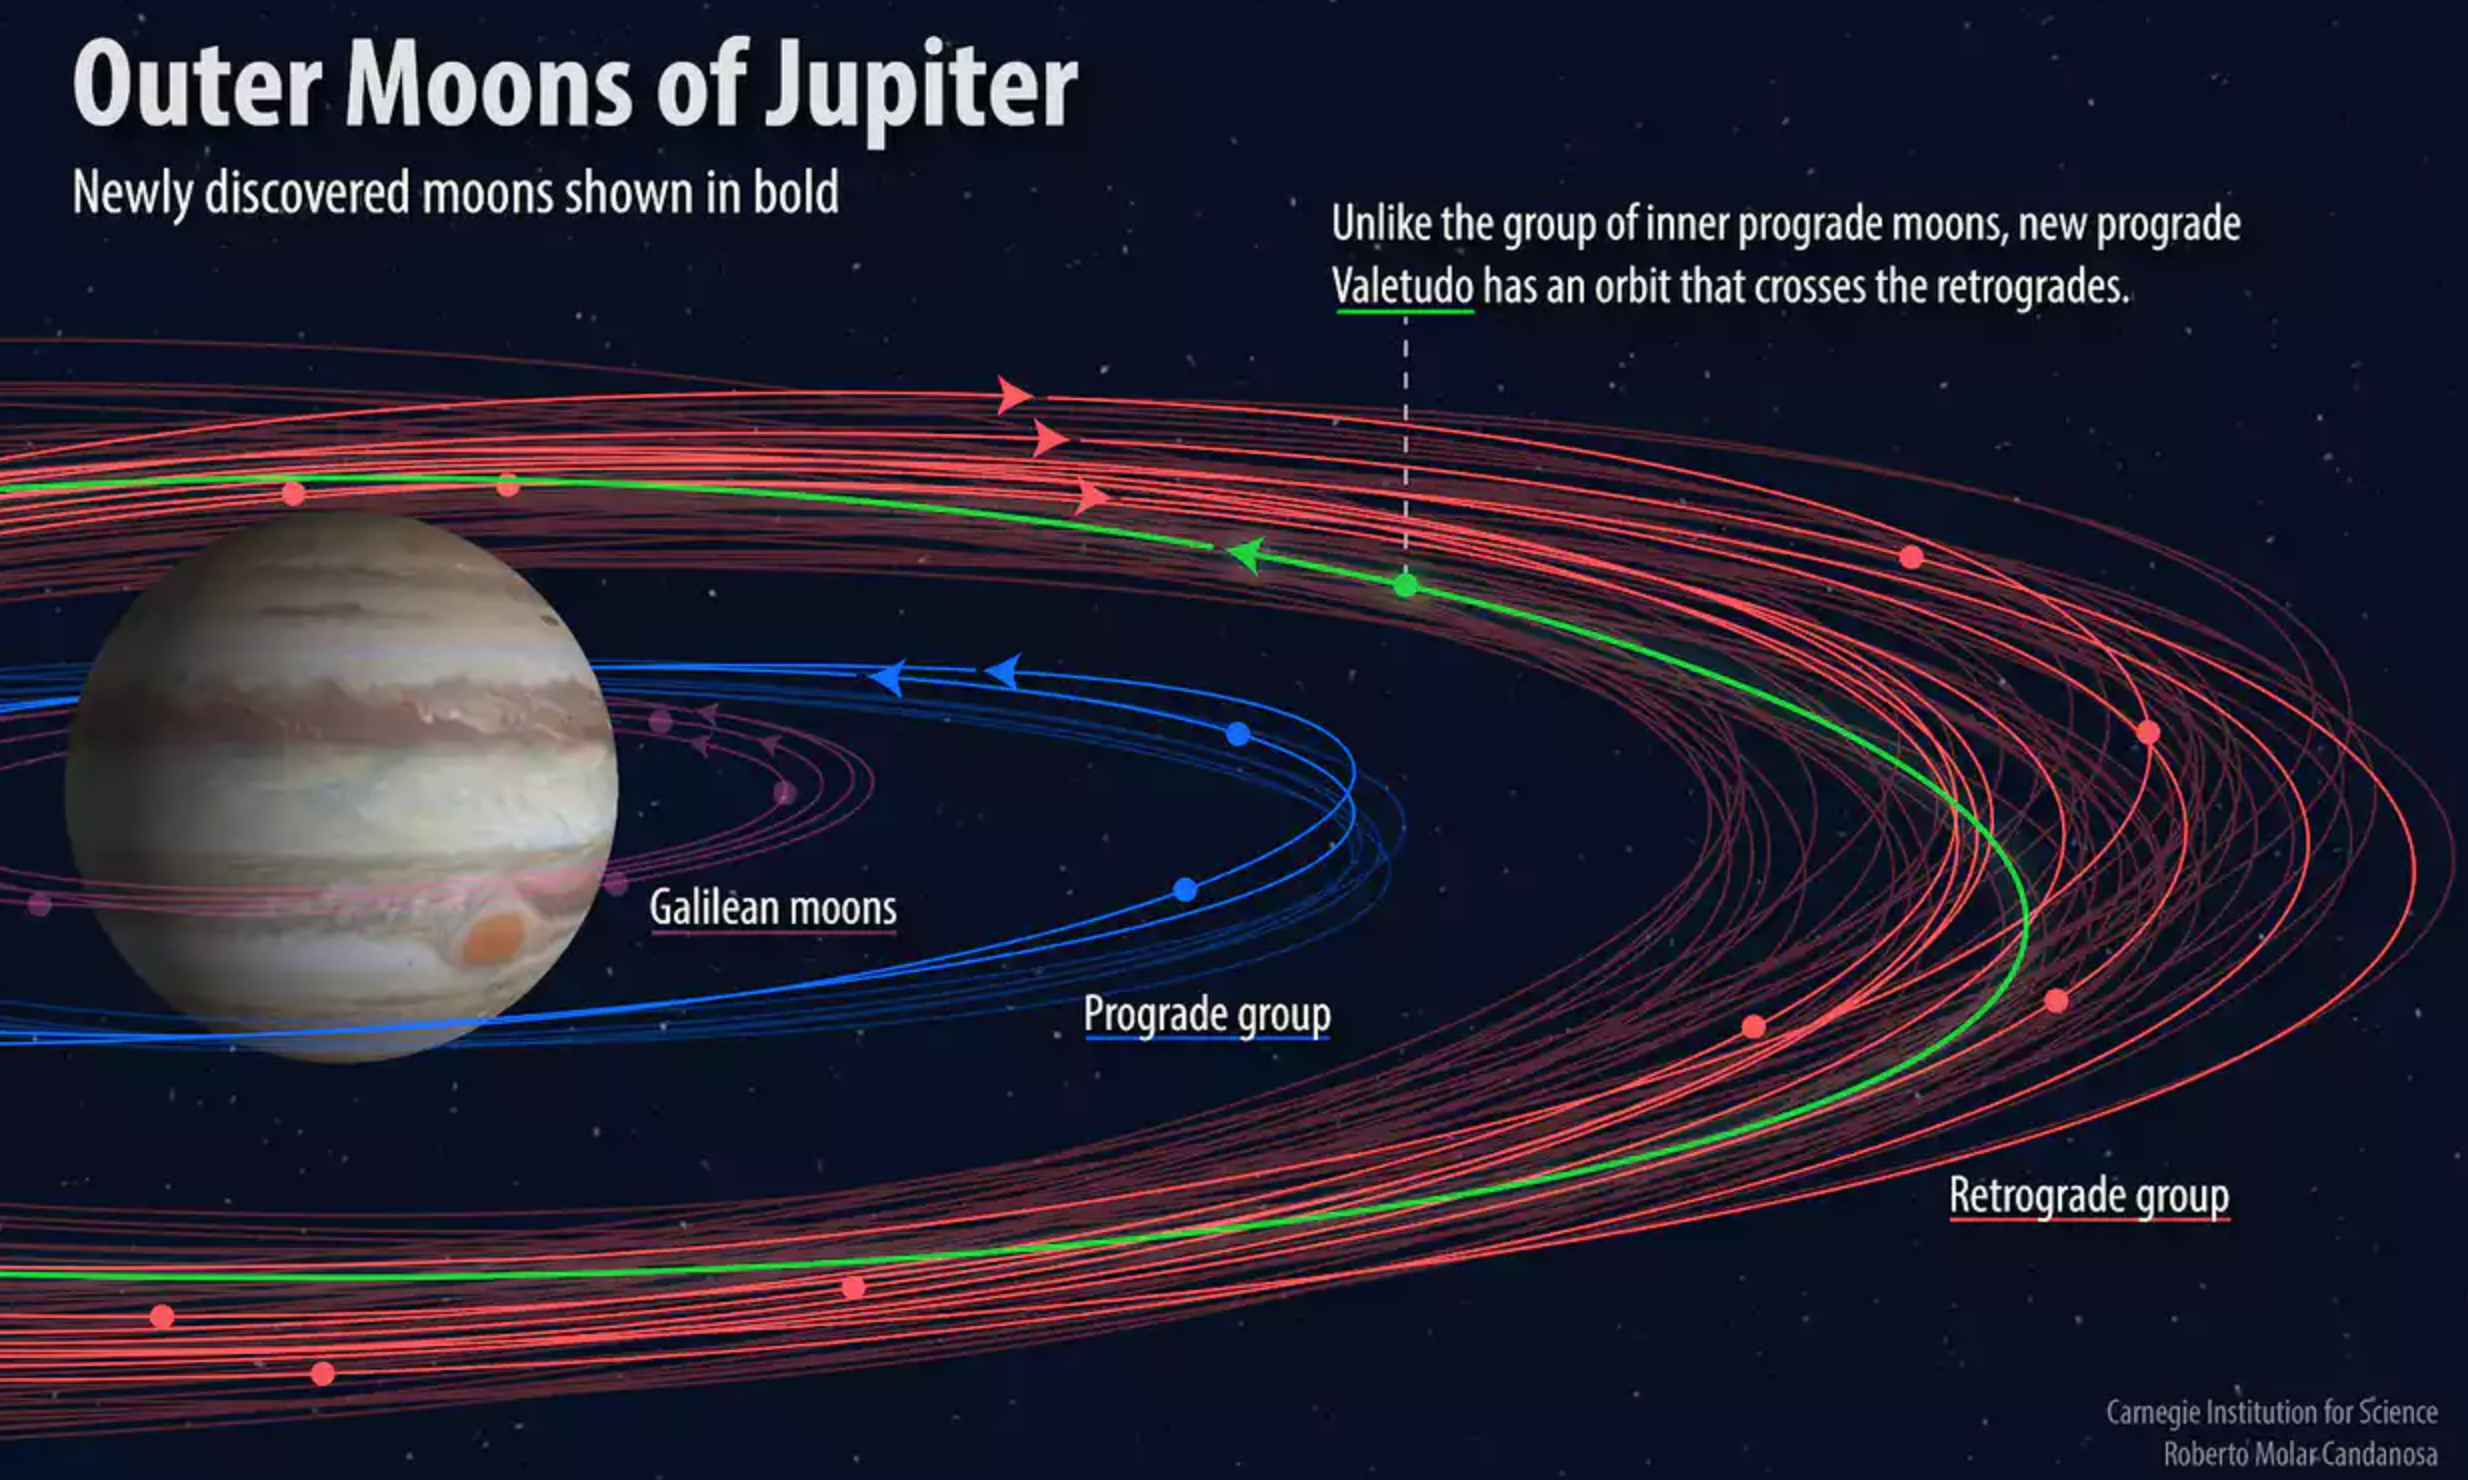
Yesterday, space nerds were alerted to the news that 12 new moons have been discovered in orbit of Jupiter. These are much smaller than Jupiter’s moon Ganymede, which is the largest moon in the Solar System and is larger than even Mercury. The point is that there are almost certainly no Ganymede-esque moons orbiting Jupiter that remain undiscovered.
But despite their small size, these moons do have some interesting features, as the article I read in the Guardian pointed out. The most interesting is the orbit of the moons. In general, Jovian moons orbit either prograde, i.e. with the orbit of Jupiter, or retrograde, i.e. against the orbit of Jupiter. The two inner moons discovered are prograde and nine of the other 12 are in an outer orbit of retrograde moons. But Valetudo, the 12th, which orbits in the retrograde group, actually orbits in a prograde fashion. The graphic below from the Carnegie Science Institute does a pretty good job of showing this.
Consider this your collision warning
Ultimately this means that at some point in the future, Valetudo will slam head-on collision style with another Jovian moon. And reportedly that will be so intense we will be able to see it from Earth. Bangin’. Catch is that it will not likely happen anytime soon.
As for the graphic above, I am of two minds. I generally like the use of colour. The bright green contrasts starkly against the red—though it should be pointed out it would fail a red-green colour blindness test. And then the interesting, but admittedly less interesting prograde and previously discovered Galilean moons are in more muted blues and purples, which puts them further into the background. It works nicely as a complete package.
But should it be on a deep blue background? Lots of space visualisations use black backgrounds, including mywork and the workofothers. But sometimes work that uses a white or otherwise light background could more clearly show things like orbits. It is difficult to say with certainty because of the lack of a light background for comparison’s sake.
The other thing that gets to me is the viewing angle of the orbits. Clearly we are looking neither dead-on nor from high above. And that makes it a bit more difficult to compare orbits. Of course these might not all be on the same plane because orbits are in three-dimensional space. But if the orbits were all shown from above, it would certainly aid with problems of foreshortening.
All in all, though, I shan’t complain because we have more moons in the Solar System. And who knows how many more smaller moons both Jupiter and Saturn have.
Credit for the piece goes to Roberto Molar Candanosa.
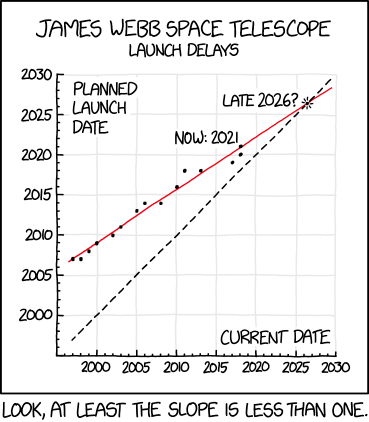
A few weeks ago it was announced that NASA’s James Webb space telescope would see its launch delayed again. The successor to the Hubble telescope was originally supposed to launch several years ago, but now it won’t fly until at least 2021. Thankfully xkcd covered this slipping launch date.