The Urban Future

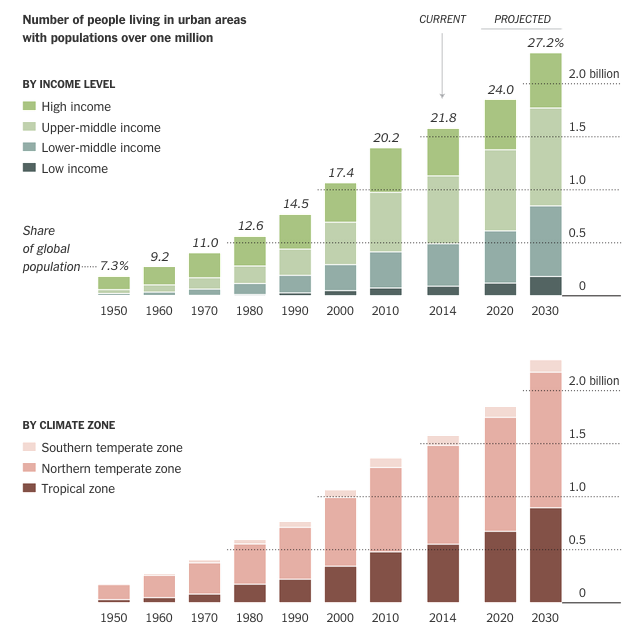
Today’s selection is a little old—dating from July of last year—but is still a nice example of an inline graphic supporting the premise of its accompanying article. The New York Times looks at what was then data published by the United Nations on urban growth out to 2030. The article talks about the growth of megacities in lower income countries and those in the tropical regions. So smack in the middle of the article are two stacked bar charts breaking down urban populations into those two categories.
Urban population makeup

Personally I would have preferred a series of line charts to better compare the growth—the lack of a common baseline makes it very difficult to compare segments of the bars. But below the stacked bar charts we have a nice table. Those are always good to see. They organise information clearly and make it quick to find what is relevant.

Credit for the piece goes to the New York Times graphics department.

The 76ers Are a Terrible Basketball Team

The Philadelphia 76ers are a terrible basketball team. FiveThirtyEight details the deficiencies of the team in this small table. Icons represent characteristics that can be either positive or negative. They are then placed within the table to quickly show how awful the team is. My favourite is the icon for poor player.

Just terrible
Just terrible

Credit for the piece goes to the FiveThirtyEight graphics department.

Comparing Urban Statistics

Sometimes when you are considering moving, you want to look at some broad statistics on the area in which you want to move. In Boston, the Boston Globe has put together a neat little application that does just that. Type in two settlements in the metro area and then get a quick comparison of the two.

Comparing Boston metro cities

Credit for the piece goes to Catherine Cloutier, Andrew Tran, Russell Goldenberg, Corinne Winthrop.

Leaving on a Jet Aeroplane

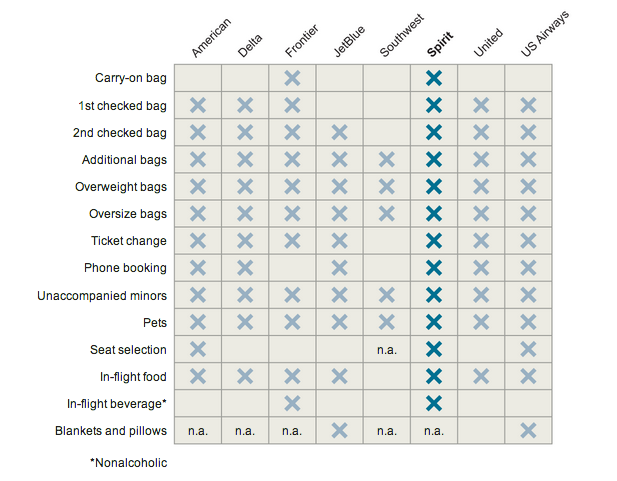
I am travelling abroad for two weeks. While I have a number of posts lined up, I doubt that I will be able to respond to anybody or post current and/or topical pieces. But at least you will have something. So to kick things off, this piece from the New York Times makes good use of a table. It simply marks which airlines charge fees for particular services or offerings.

Airline fees
Airline fees

Credit for the piece goes to the New York Times graphics department.

British Trident System

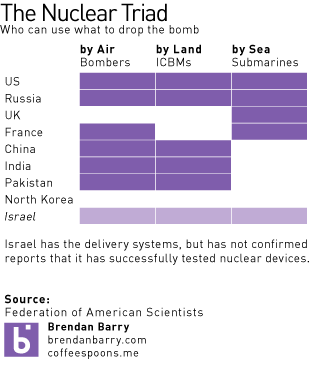
The United Kingdom is one of eight, probably nine nuclear powers. (Israel has never confirmed that it has tested/operates nuclear weapons.) Unlike most countries, the UK only uses one delivery system to operate its weapons: submarines using Trident ballistic missiles.

A triad power is a country with all three delivery systems

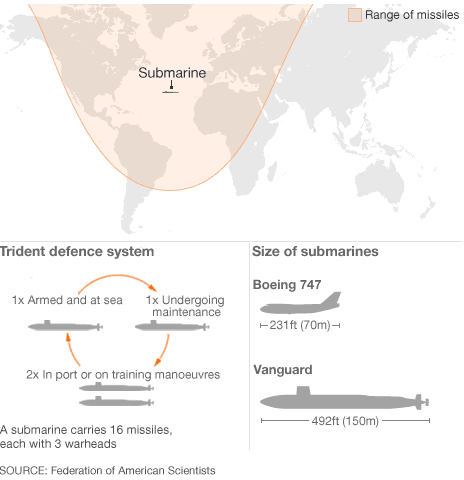
The British Trident system became an issue in the coalition government. While it was supported by both the previous Labour government and the Conservatives, the programme had to be reviewed per the coalition agreement. The review has been completed and it will be made public. But to explain to the public how Trident works, the BBC created this graphic. It does a really good job of showing the reach of the British submarines from one location, but then showing why an adequate replacement would need at least three to four submarines.

The British Trident programme

Credit for the Trident graphic goes to the BBC. The table is my own work.

Improving Efficiency

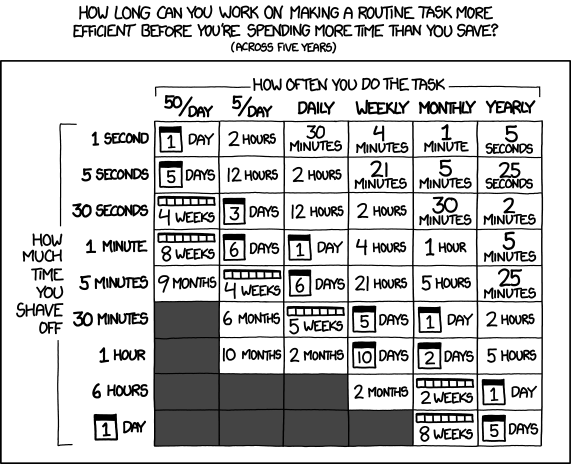
Today’s post comes from xkcd. It looks at how much time can be spent improving efficiency before you become an inefficient efficiency person. It is important to note that this is over a five year span. And while I do not know about my readers, I can barely stick doing one thing for more than a year.

Improving efficiency

Credit for the piece goes to Randall Munroe.

Analysing Amtrak

The Brookings Institution released a report investigating the ridership of Amtrak’s various routes in an attempt to identify ways of cutting costs. They also released an interactive piece along with the report that pairs a map with a simple table.

Highlighting a route in the table highlights the route in the map and links the two together for the user. Clicking a dot on the map shows the details for the metropolitan area ridership along with the total number of stations. Lastly, because the table is sortable, the user can identify for themselves the conclusion reached by the report. To become solvent, Amtrak should divest itself of its long-haul routes that run at significant losses and focus on the profitable routes that could subsidise the popular though still minor loss-making routes.

Amtrak routes with the Northeast Regional highlighted

Credit for the piece goes to Alec Friedhoff.

Japanese Radiation in Perspective

Japan continues to deal with damage from the earthquake and its subsequent tsunami. Yet, much of the news that seems to come out of Japan focuses on the leak of radioactive materials from the Fukushima power station. Certainly that is a story, but is it more important than the tens of thousands of people missing and presumably dead?

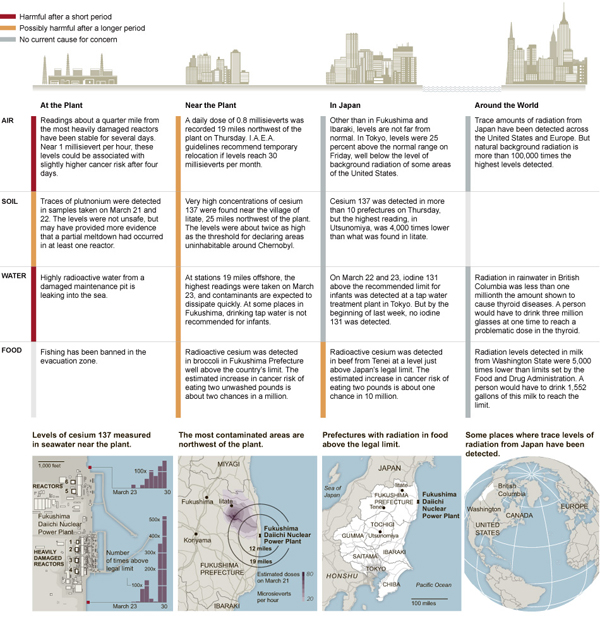
The New York Times printed a graphic on Saturday that details the danger from the radiation at the plant, near the plant, across Japan, and then across the rest of the world.

Radiation Graphic Reduced

And largely, if you live in the United States, you have no reason to fear the radiation leak. In general, unless you maybe live near the plant, you have no reason to fear the radiation leak.

Overall, it communicates its message clearly and adds nice detail in the bottom third of the graphic about whatever spread of radiation there has been.

Credit for the graphic goes to Joe Burgess, Amanda Cox, Sergio Peçanha, Amy Schoenfeld and Archie Tse.