Thanksgiving Side Dishes

American Thanksgiving meals often feature elaborate spreads of side dishes. And everyone has a favourite. A common theme around the holiday is for media outlets to conduct surveys to see which ones are most popular where. In today’s piece we have one such survey from pollster YouGov. In particular, I wanted to focus on a series of small multiples maps they used to illustrate the preferences.

Big splashes of colour do not necessarily make for a great map

I used to see this approach taken more often and by this I hope I do not see a foreshadow of its comeback. Here we have US states aggregated into distinct regions, e.g. the Northeast. One could get into an argument about how one defines what region. The Midwest is one often contested such region—I have one post on it dating back to at least 2014.

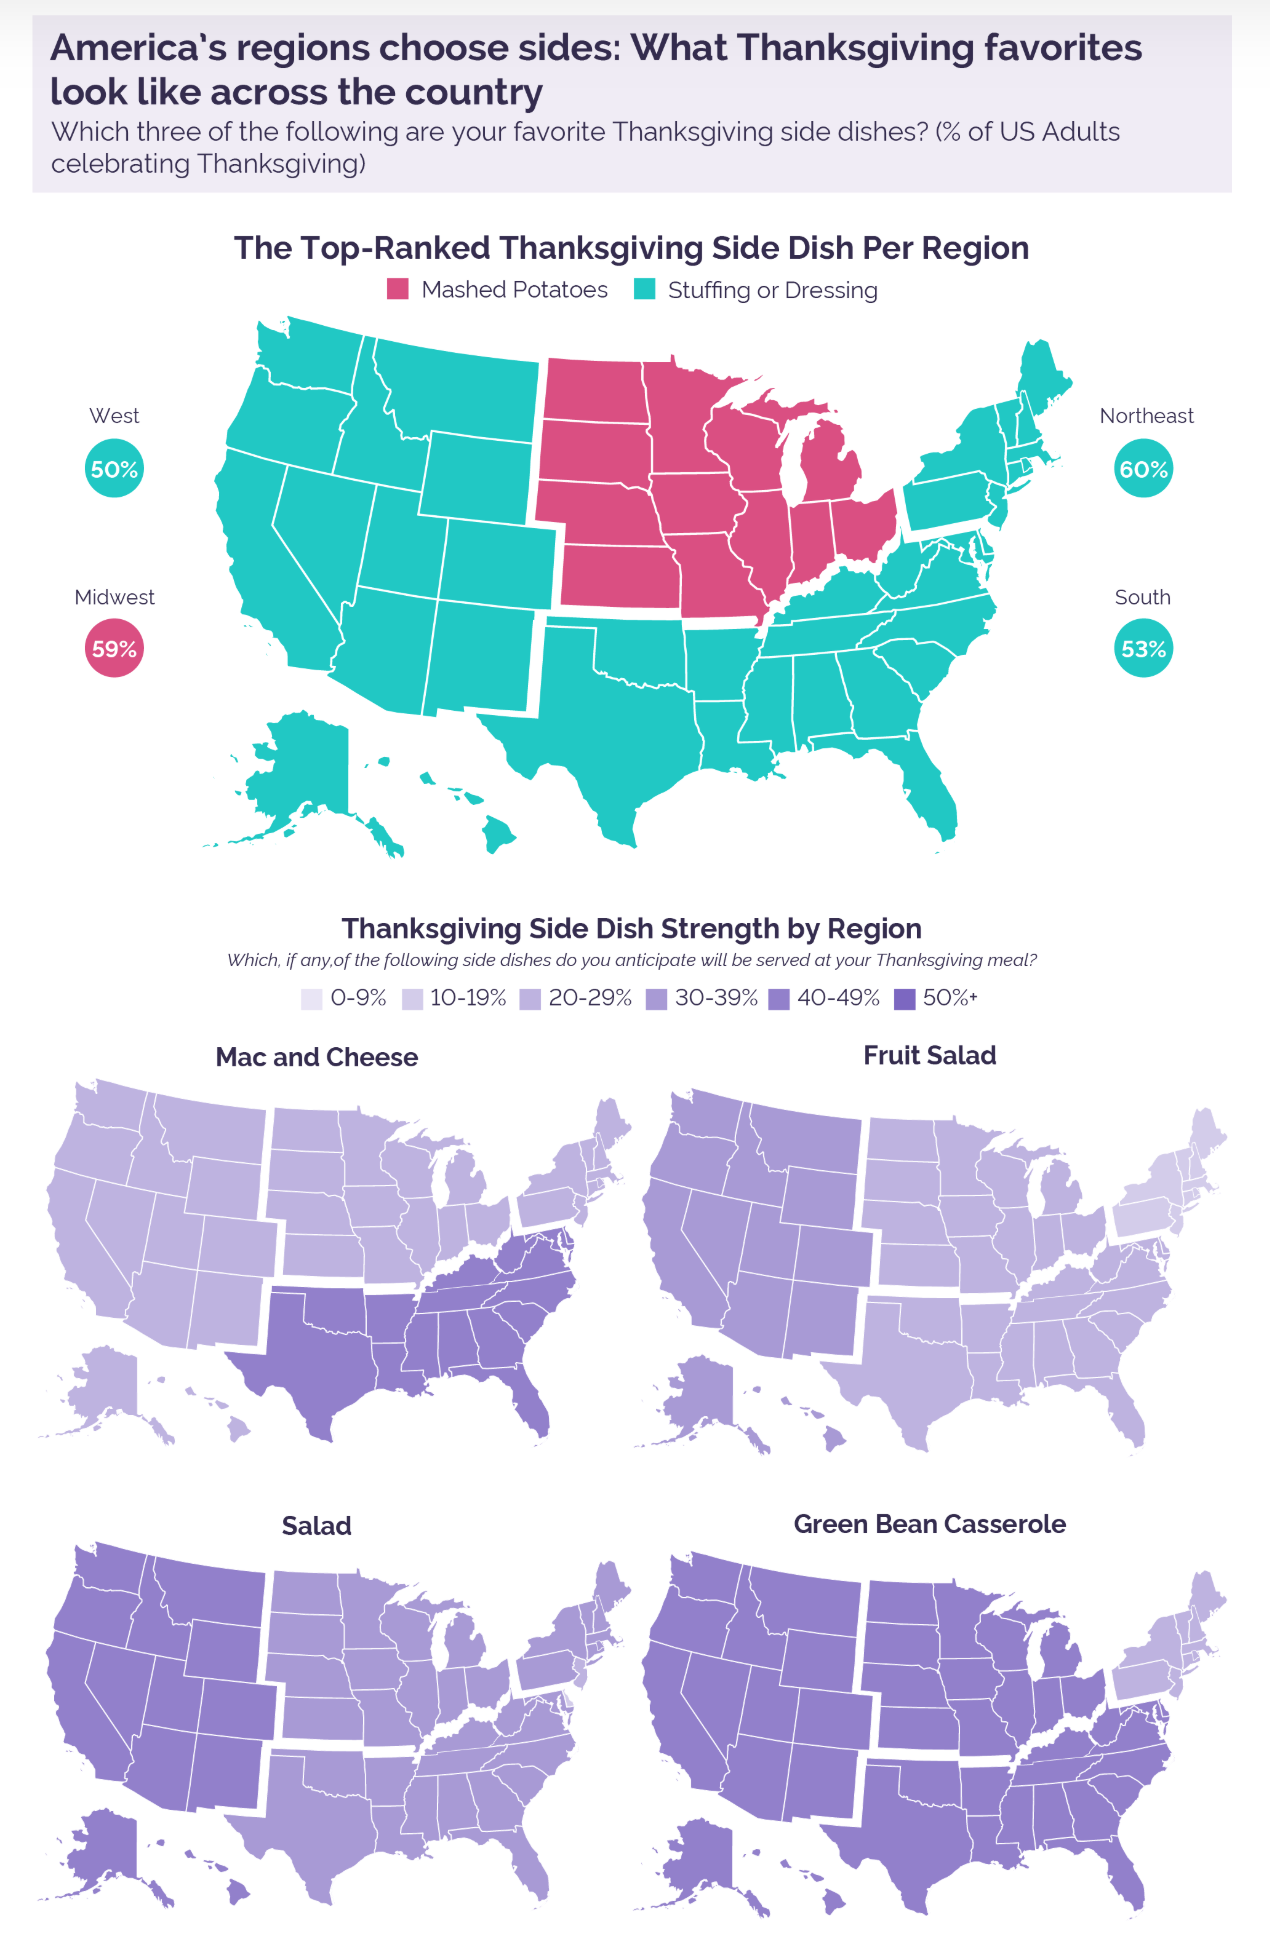
Instead, however, I want to focus on the distinction between states and regions. This small multiples graphic is a set of choropleth maps that use side dish preferences to colour the map. Simple enough. However, the white lines delineating states imply different fields to be coloured within the graphic. Consequently, it appears that each state within the region has the same preference at the same percentage.

The underlying data behind the maps, at least that which was released, indicates the data is not at the state level but instead at the regional level. In other words, there are no differences to be seen between, say, Pennsylvania and New Jersey. Consequently, a more appropriate map choice would have been one that omitted the state boundaries in favour of the larger outlines of the regions.

More radically, a set of bar charts would have done a better job. Consider that with the exception of fruit salad, in every map, only one region is different than the others. A bar chart would have shown the nuance separating the three regions that in almost all of these maps is lost when they all appear as one colour.

I appreciate what the designers were attempting to do, but here I would ask for seconds, as in chances.

Credit for the piece goes to the YouGov graphics team.

Ratings the Foods

For my American audience, Happy Thanksgiving. Coffeespoons will be on holiday for the remainder of the week. But don’t worry, we’ll be back. For my non-American audience, we basically celebrate a tale of the Pilgrims feasting with Native Americans after a successful harvest.

Today’s graphic is really just a series of tables. I think I missed this back in 2016 because, surprise, I had just moved to Philadelphia and was still settling into things—including running Coffeespoons. Anyway, FiveThirtyEight published an article trying to discover the most popular dishes. This is just a sampling , a screenshot of the meats. But you should go check it out to see if your favourite dishes made the cut.

Where's the beef?
Where’s the beef?

Mine did not. I am not a big fan of turkey and am doing a pork roast tomorrow . I guess I could go with the ham in a pinch though.

Credit for the piece goes to Walt Hickey.

Flying for Thanksgiving

This is a piece from a few years ago, but the New York Times cleverly brought it to the front of their Upshot page. And it seemed just so appropriate. Many of you are likely travelling today—I’m not, I’m headed to work—and many of you will be driving or taking the train. But some will be flying. But to and from where?

If only it captured other travel data

The map has some nice features that allow you to selectively few particular cities. Philadelphia has relatively few travellers by air, but that’s probably because places in the Northeast are more easily accessible by road or rail.

Chicago also has relatively few travellers, though more than Philadelphia. I would posit that is because most people are not flying to visit their relatives, but rather driving to places in Wisconsin, Iowa, and Indiana.

No post tomorrow, because I intend on sleeping in. But you can expect something on Friday.

Credit for the piece goes to Josh Katz and Quoctrung Bui.