Migration within the European Union

Today’s post comes via one of my coworkers. She sent me this graphic from Thomson Reuters that uses a Sankey diagram to show the movement of European Union citizens within the EU. As with my post yesterday, I feel this piece would benefit from even limited interactivity. Exploring individual countries or individual flows by touch or by mouse would be more useful than relying on annotations. But also as I said, that might not have been possible within the production constraints of this piece.

Migration within the EU

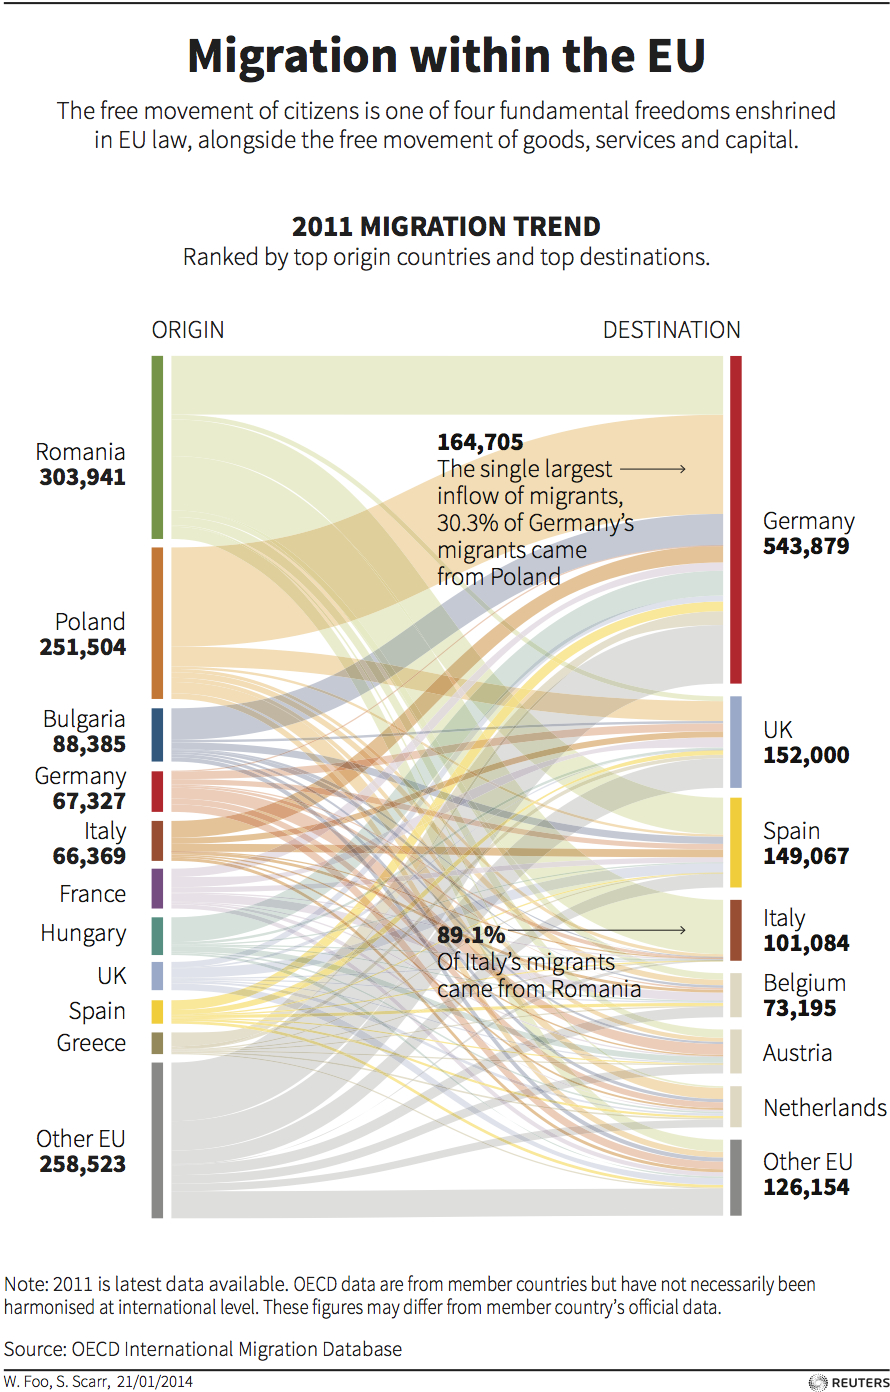
Credit for the piece goes to W. Foo and S. Scarr.

Squeezing You Into Your Airline Seat

Airlines want to make flights as profitable as possible. And that largely entails cramming as many people into those hollow cylinders called aircraft fuselages as possible. This is despite advice from Airbus, one of the world’s largest aircraft manufacturers to set a minimum seat width standard greater than US airlines are investigating. Thomson Reuters does a nice job illustrating the changes in this graphic.

Airline seat sizes
Airline seat sizes

Credit for the piece goes to the Thomson Reuters graphics staff.

Delivery Delays

Today’s graphic looks at the backlog of aircraft delivery, i.e. the manufacturing of civilian aircraft. Why? Because Boeing is attempting to increase production of its 787 Dreamliner. And this weekend I arrived in Chicago from Warsaw via a 787.

This is a really nice piece from Thomson Reuters that looks at the manufacturing lines for both Boeing and Airbus and how many planes have yet to be delivered. The annotations really help to explain some of the stories behind some of the aircraft and their delayed deliveries.

Aircraft manufacturing backlog

Credit for the piece goes to Simon Scarr and Christian Inton.

Changes in Global Life Expectancy

Today’s post is a scatter plot from Thomson Reuters looking at changes in global life expectancy since 1990. What is really nice about this piece is the main space for the data visualisation presents all of the data for all of the available countries. Beneath the main visualisation, the designer chose to use small multiples of the same chart to highlight broader regional trends.

Change in global life expectancy

Credit for the piece goes to, I think, Hwei Wen Foo. (Credit on the graphic is W. Foo.)