Alaska Airlines

Here’s an older, March graphic from the New York Times that looks at Alaska Airlines. This exemplifies what maps do well; it maps relevant data onto a map. Perhaps that reads silly, but too often people map data just because most things are tied to a geography; things that happen in the world happen somewhere, ergo everything could be mapped.
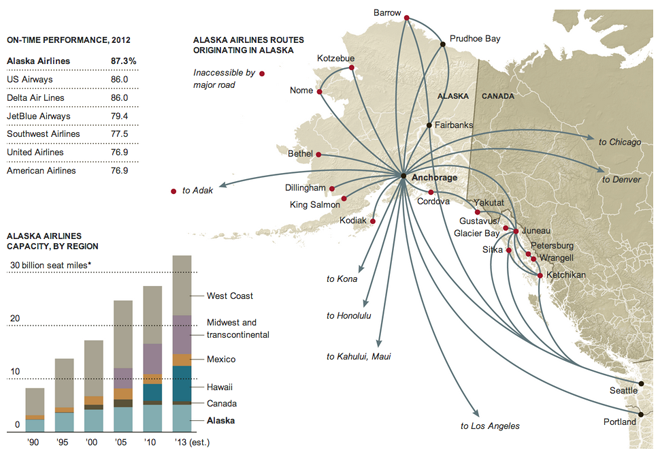
The growth of Alaska Airlines

In this graphic, however, mapping the tight and Alaska-focused network with tendrils sneaking off-map to distant cities. The map supports the article that tells how after decades of focusing on Alaska, the airline has begun to expand to Midwestern cities in the US, cities in Mexico, and Hawaii.

I am not terribly keen on the stacked bar chart. It highlights the steady Alaska market over the decades at the cost of showing dynamism in those Midwestern, Mexican, and Hawaiian markets.

Credit for the piece goes to the New York Times Graphics Department.

On Holiday in Ganister

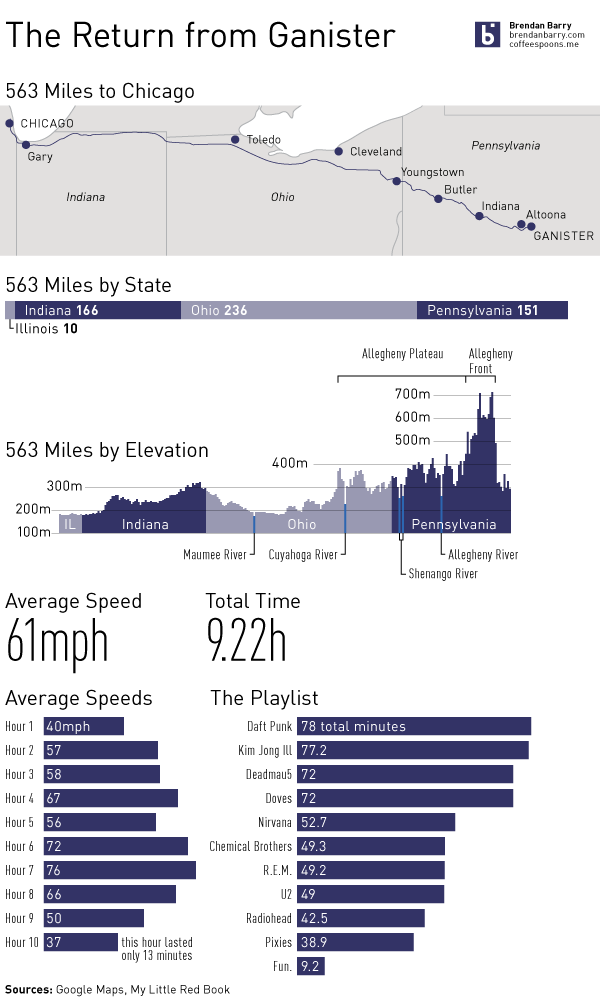
Well, actually, your author is driving back from Ganister today. Unfortunately, while on holiday I was not working (nor was I planning to.) So while I could of run silent today, I wanted to share with all of you again a project I created last year about my return drive from Ganister. For all of who familiar with the piece, I apologise for my re-posting of previous work. For those of you unfamiliar with the work or with Ganister and its distance/remoteness, enjoy. (It’s full-size, so no click-for-higher-resolution.)

My return trip from Ganister from 2012

North American Transit Map

Wrapping up this week of map-themed work, we have xkcd. He created an integrated map of North America’s subway systems from Vancouver to Chicago to Philadelphia to Washington to Mexico City.

I only wish I could take the Red Line from Belmont and transfer to the Market–Frankford near West Trenton. Because I could then take the (Frankford) El out to 69th Street and catch the 104 to West Chester.

Subways of North America

Credit for the piece goes to Randall Munroe.

Proposed Expansion of Massachusetts Railway Network

When we talk about new rail projects, or even highway or airport expansions, we like to include maps of new routes and destinations. In that sense this map from the New York Times is not new. However, we often forget in such visualisations that we have the opportunity to add layers of information that show why these expansions are beneficial.

Proposed Massachusetts railway network expansion


Here, note in particular how the proposed improvement projects link the dense corridor of urban settlements stretching from Boston through Worcester to Springfield. Additional lines connect more distant southerly cities such as Fall River to Boston. These might normally be seen as dots at ends of a line, but by showing the density of the population in these corridors, readers can understand how the proposed lines might benefit more people than just those living at the dots.

Credit for the piece goes to the New York Times.

Analysing Amtrak

The Brookings Institution released a report investigating the ridership of Amtrak’s various routes in an attempt to identify ways of cutting costs. They also released an interactive piece along with the report that pairs a map with a simple table.

Highlighting a route in the table highlights the route in the map and links the two together for the user. Clicking a dot on the map shows the details for the metropolitan area ridership along with the total number of stations. Lastly, because the table is sortable, the user can identify for themselves the conclusion reached by the report. To become solvent, Amtrak should divest itself of its long-haul routes that run at significant losses and focus on the profitable routes that could subsidise the popular though still minor loss-making routes.

Amtrak routes with the Northeast Regional highlighted

Credit for the piece goes to Alec Friedhoff.

The Sky Is Falling…No…Wait…It’s Just a Dream(liner)

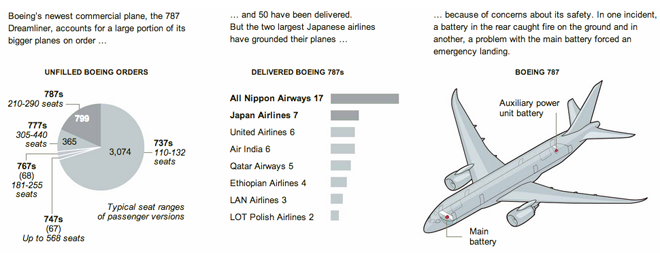
Boeing has been having some problems with its new aircraft, the 787 Dreamliner from cracked windshields to oil leaks to perhaps most problematic battery problems. Over the course of the last week, the New York Times has published a series of small graphics to complement stories about the problems and the investigations.

The first graphic looked at the Dreamliner and where its batteries are located. Unfortunately for Boeing, the Dreamliner is critical to its success moving forward and the remainder of the graphic shows just how important.

The importance of the Dreamliner

The next day a graphic about total deaths on US airline flights supported a piece about the Dreamliner.

Fatalities aboard US flights

Then yesterday the NYT published a graphic about the specific battery type (lithium ion) and what role it played in aircraft incidents, be them cargo or passenger related.

Battery incidents
Battery incidents

Fighter Jets

A large-scale infographic with lots of drawings of fighter jets. That’s pretty much what this is. And that’s cool enough for me. The background is that the US fighter programme for the F-35 is increasingly ridiculously expensive and beyond budget. Some nations, like Canada, are starting to have second thoughts. This post outlines potential options and adversaries.

Not all of these aircraft are really options. For example, the US has banned the export of the F-22 and it is highly unlikely that Canada would purchase the Raptor. Will the Russians ever build the PAK FA? They’ve been trying to build them for years and the aircraft has yet to go into production. Regardless of the likelihood of facing the adversaries or procuring the options, they’re still pretty cool illustrations and side-by-side comparisons.

Fighter jet options and adversaries for Canada

Credit for the piece goes to Jonathon Rivait, Mike Faille, and Matt Gurney.

Better, Safer Driving

Hannah Fairfield at the New York Times created a great infographic a few years ago that looked at the history of the price of gasoline and how many miles, on average, an American drove in a car per year. The piece told some rather interesting stories starting in the 1950s with the explosion of the suburb, interstate highways, and car ownership. The energy crises of the late 1970s and early 1980s provided a spike that eventually subsided for the 1990s and early 2000s when the United States was the dominant economic power and the only country that really consumed that much gasoline. (I remember those days well for that was when I first started filling my own car’s gas tank. How great $1.xx/gal gas was.)

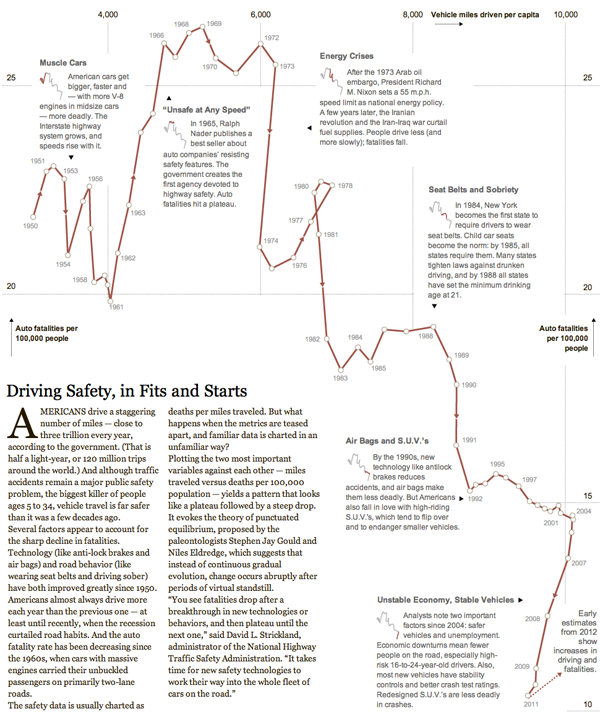
Earlier this week she returned in a similar fashion to look at driver safety over time. The metrics were average annual miles driven and the number of auto fatalities per 100,000 people. Segments of time characterised by a common theme, story, or technology are highlighted and the annotated to explain the change from the previous time period. It’s a rich story that walks the reader through the history of the American auto experience since World War II.

Driving safety
Driving safety

Credit for the piece goes to Hannah Fairfield.

Missions to Mars

Curiosity shall soon be exploring the surface of Mars seeking to understand the geological history of the planet. But in this infographic, see the cropping below, from the National Post we can see previous missions to Mars. We have not always been successful in operations in and around Mars, but our recent track record is much improved.

Missions to Mars
Missions to Mars


Credit for the piece goes to Mike Faille.

Mexican Drug Cartels

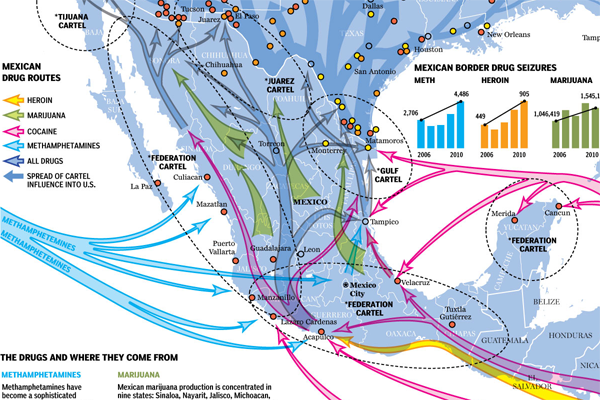
Mexico has some serious problems. Primarily with the drug cartels. About two weeks ago the National Post created an infographic that looked at the northern spread of Mexican drugs into the United States. The infographic also included details on the transit and transportation networks the different drugs take along with the geographic spread of the various cartels from the Tijuana, Federation, Juarez, and Gulf Cartels as reported by US cities.

Foreign Policy magazine rates countries as to how close they may or may not be to becoming failed states. Mexico is among those that have fallen into the “Warning” category over the recent years. The second half of the infographic looks at why. In short, in the past few years over 50,000 people have been killed in drug-related homicides and several more thousand have simply disappeared. The police, military, civilian officials, journalists, &c. have become targets of the cartel if they oppose the cartels.

Mexico has some serious problems. Sadly problems have a tendency to spill over borders.

Cropping of the Mexican Cartel infographic

Credit for the piece goes to Jonathan Rivait and Richard Johnson.