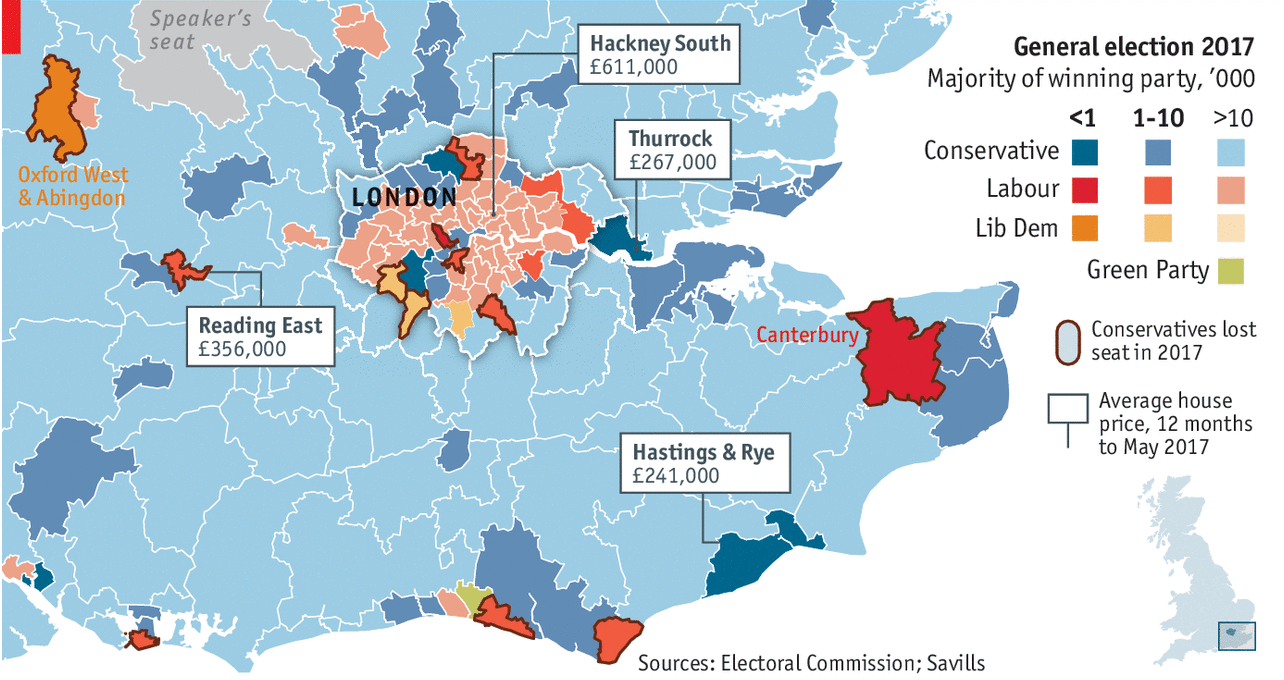
We have a nice little piece from the Economist today, a look at the electoral majority for London-area constituencies and how their housing prices may begin to draw out priced-out Labour votes from London proper.
The political impact of scarce housing supply
What I really like from the design side is the flip of the traditional choropleth density. In other words, we normally see the dark, rich colours representing high percentages. But here, those high majority constituencies are not the ones of focus, so they get the lighest of colours. Instead, the designers point attention to those slimmest of majorities and then offer the context of average home prices.
Credit for the piece goes to the Economist’s Data Team.
Today’s post is, I think, the first time I’ve featured the Politico on my blog. Politico is, I confess, a regular part of my daily media diet. But I never thought of it as a great publication for data visualisation. Maybe that is changing?
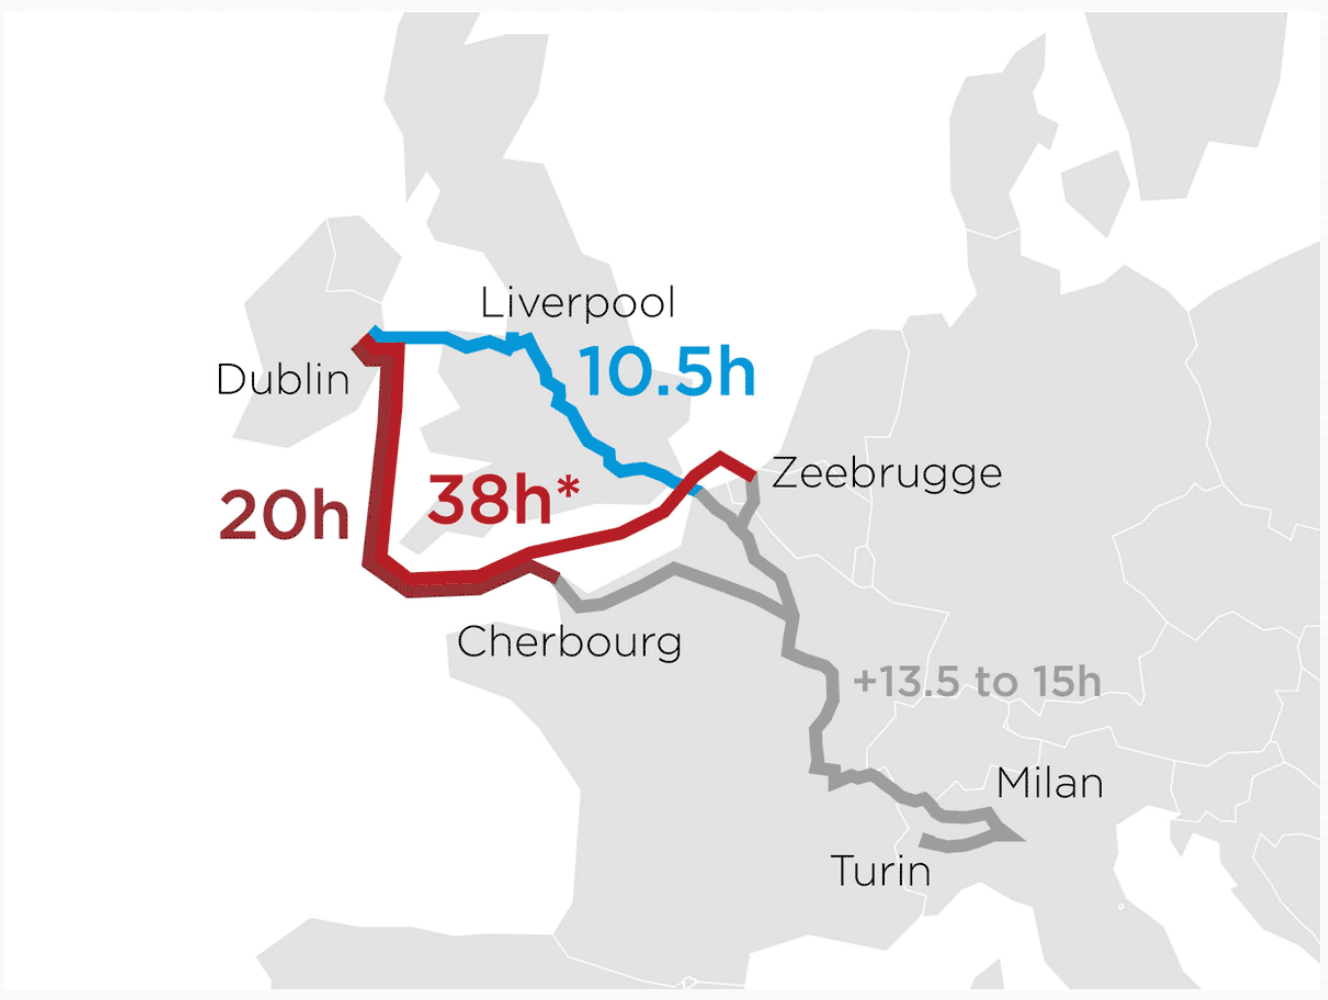
Anyway, today’s post highlights an article on how the Irish shipping/logistics industry could be affected by Brexit. To do so, they looked at data sets including destinations, port volume, and travel times. Basically, the imposition of customs controls at the Irish border will mean increased travelling times, which are not so great for time-sensitive shipments.
This screenshot if of an animated .gif showing how pre-Brexit transit was conducted through the UK to English Channel ports and then on into the continent. Post-Brexit, to maintain freedom of movement, freight would have to transit the Irish Sea and then the English Channel before arriving on the continent. The piece continues with a few other charts.
Brexit strikes again
My only question would be, is the animation necessary? From the scale of the graphic—it is rather large—we can see an abstracted shape of the European coastlines—that is to say it’s rather angular. I wonder if a tighter cropping on the route and then subdividing the space into three different ‘options’ would have been at least as equally effective.
Credit for the piece goes to Politico’s graphics department.
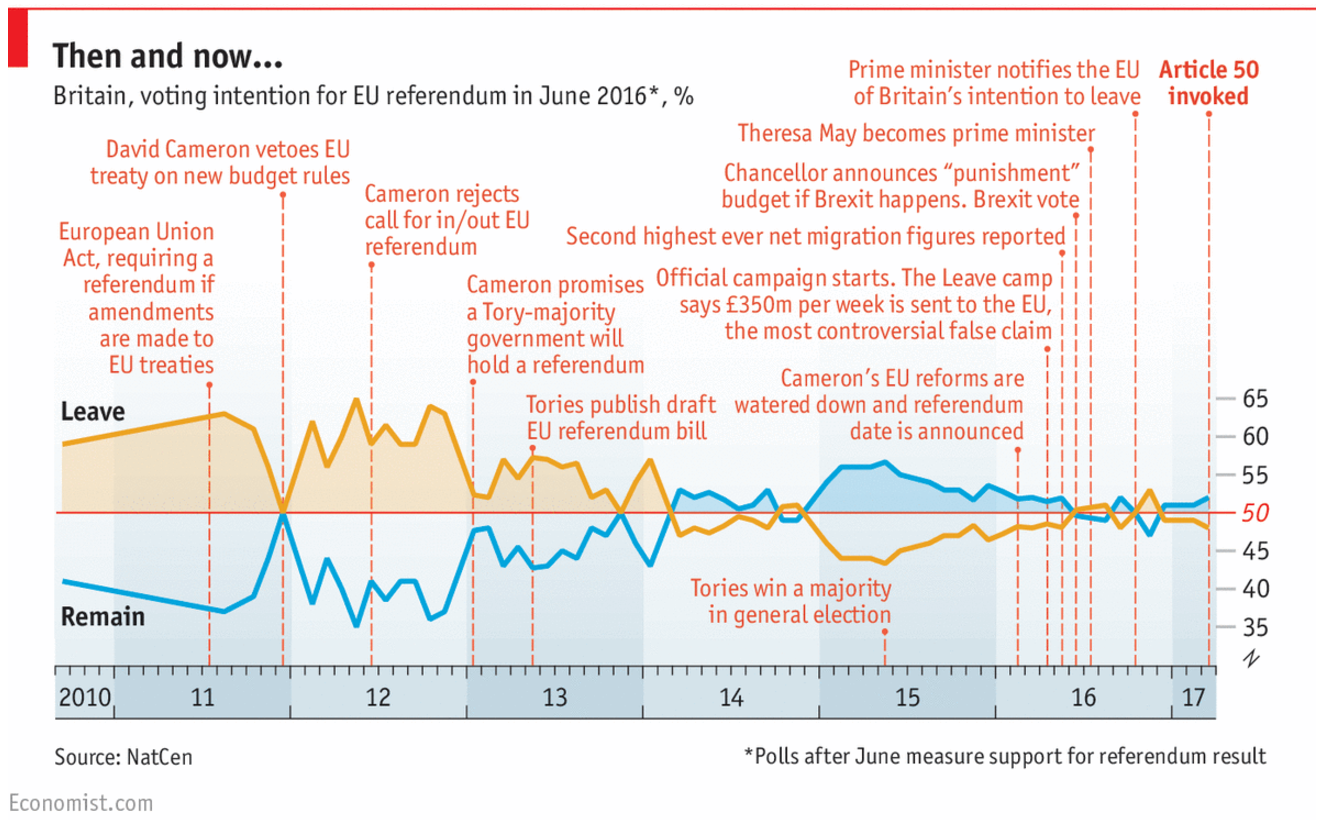
So yesterday was Article 50 Day and several British media companies published graphics about the historic event. I wanted to focus on this piece from the Economist, which is a timeline of the events leading up to Article 50. But more importantly, it includes the polling data for Remain or Leave along the length of those events.
The Brexit campaign timeline
There isn’t a whole lot more to say about this. Article 50 is just kind of a downer.
Credit for the piece goes to the Economist’s graphics department.
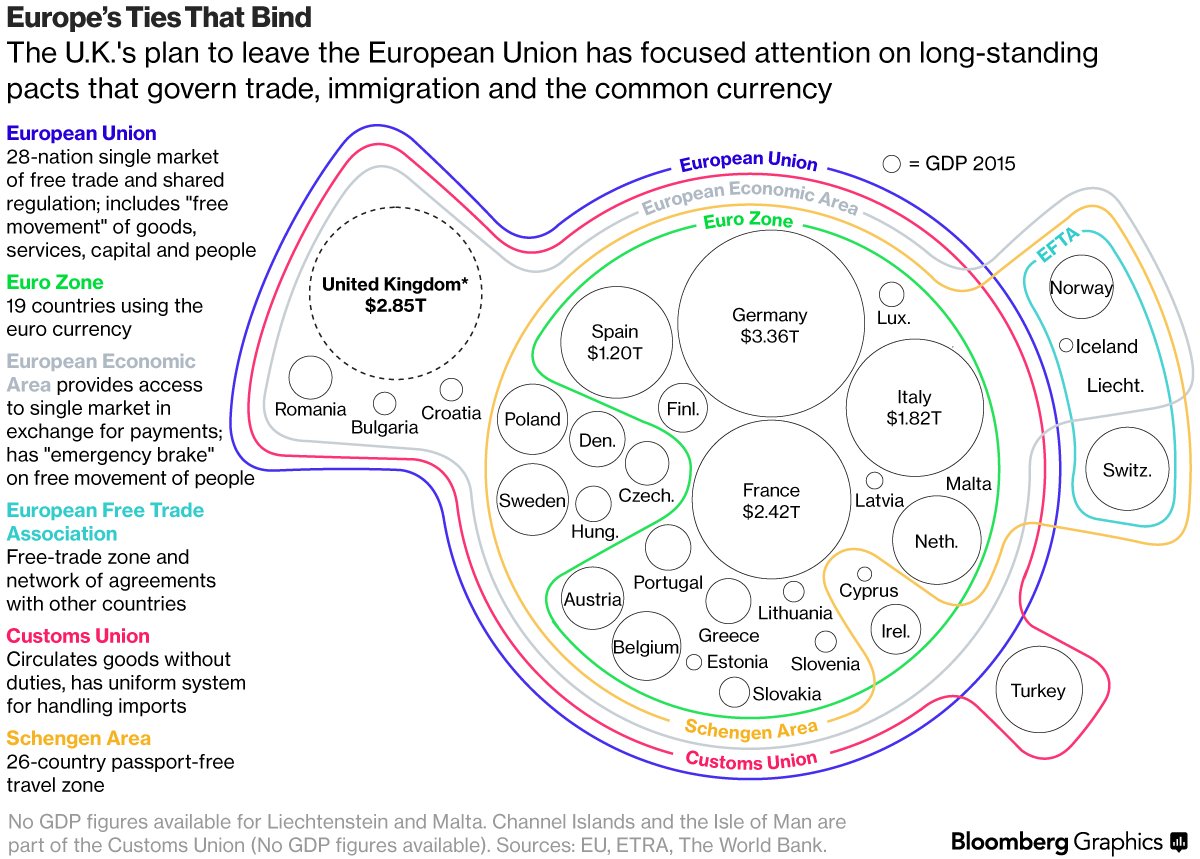
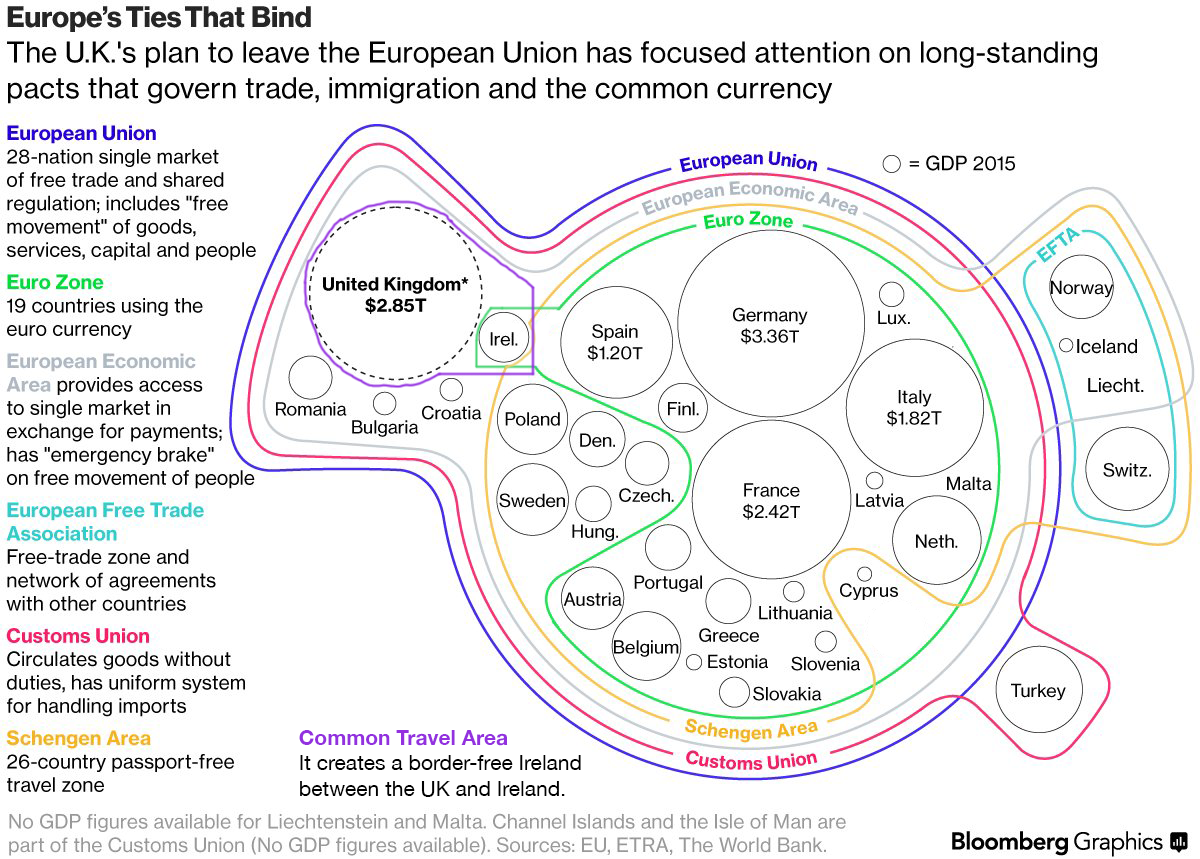
Well today’s the day. Earlier this morning (East Coast time) the British government notified the European Council that it invoked Article 50 and is withdrawing from the European Union. So what precisely does that mean? Well, it means the structure of the ties binding Europe will be altered. How could it not when one of Europe’s largest and most powerful countries leaves the European Union?
How all the countries of Europe fit together, and yes that includes Turkey
This piece comes from Bloomberg Politics and it deals with the overlapping structures binding Europe together. My quibble, however, is with the complexity as it now relates to the United Kingdom. Obviously where it fits is an unresolved question. But one of the trickier issues to untangle is just how Ireland and the UK fit. (And then in 2020 we can worry about Scotland’s role in the graphic.)
The Common Travel Area predates the European Union by decades and, loosely speaking, creates border-free travel between the United Kingdom and Ireland. So I tried to amend Bloomberg’s version to show the CTA.
I moved Ireland to show the complexity in its relationship with the UK
Credit for the piece goes to the Bloomberg graphics department.
Sorry about last week, everyone. I had some trouble with the database powering the blog here. Great week for things to go down, right? Well, either way, we’re back and it’s not like the news is stopping. This week? Brexit’s back, baby.
I’m never using the word “baby” again on this blog.
I have been saving this piece until the announcement of Article 50 by the UK government. I know the British and Europeans among my audience likely know what that means, but for the rest of you, Article 50 is the formal mechanism by which the United Kingdom starts the two-year process to leave the European Union.
Think of it like signing the divorce papers, except that the divorce isn’t unofficial for two years until after that date. The interim period is figuring out who gets which automobile, the dinnerware, and that ratty-old sofa in the basement. Except that instead of between two people, this divorce is more like a divorce between polygamists with multiples husbands and wives. So yeah, not really like a divorce at all.
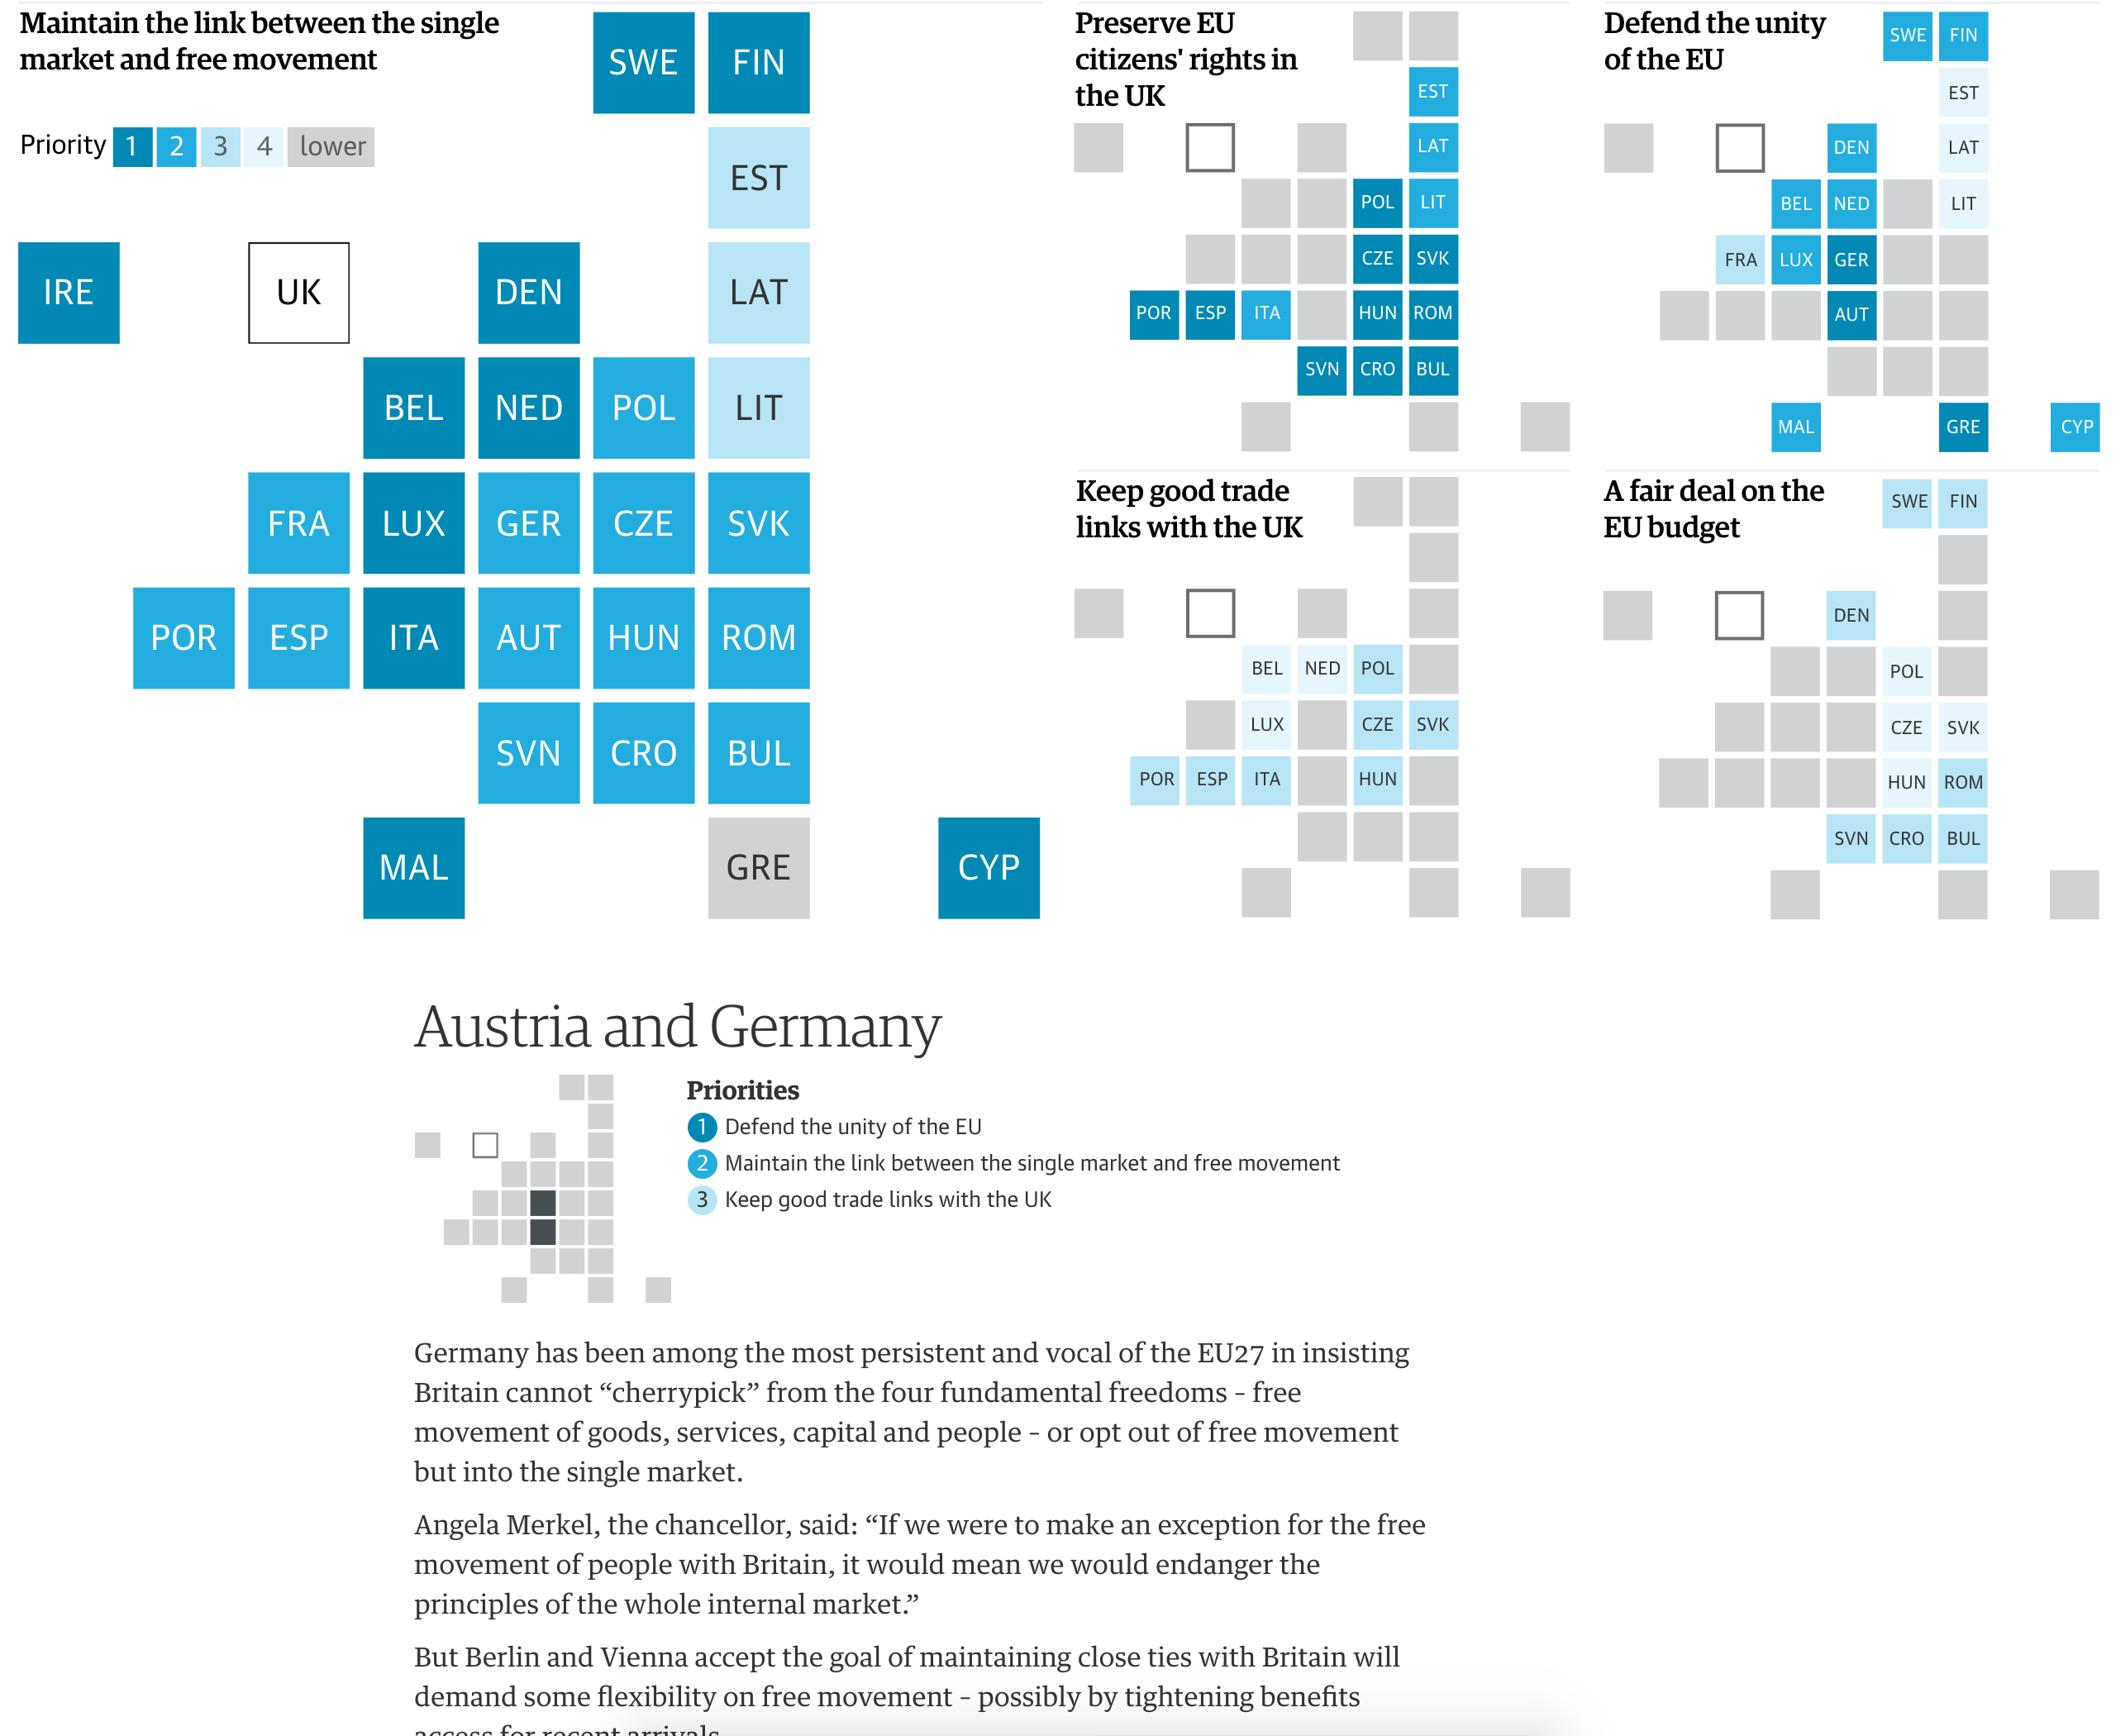
What the EU wants from Brexit at a desktop scale
This piece from the Guardian attempts to explain what the various parties want from the United Kingdom and from the eventual settlement between the UK and the EU. It leads off with a nice graphic about the importance of a few key issues in a cartogram. And then several voting blocs run down the remainder of the page with their key issues.
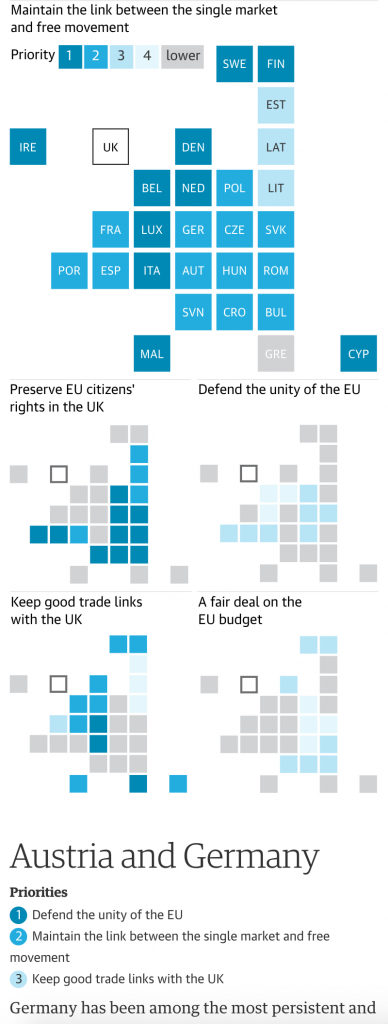
What the EU wants from Brexit at a mobile scale
I really like this piece as the small multiples for each section refer back to the opening graphic. But then on a narrow window, e.g. your mobile phone, the small multiples drop off, because really, the location of the few countries mentioned on a cartogram is not terribly important to that part of the analysis. It shows some great understanding of content prioritisation within an article. In a super ideal world, the opener graphic would be interactive so the user could tap the various squares and see the priorities immediately.
But overall, a very solid piece from the Guardian.
Credit for the piece goes to the Guardian’s graphics department.
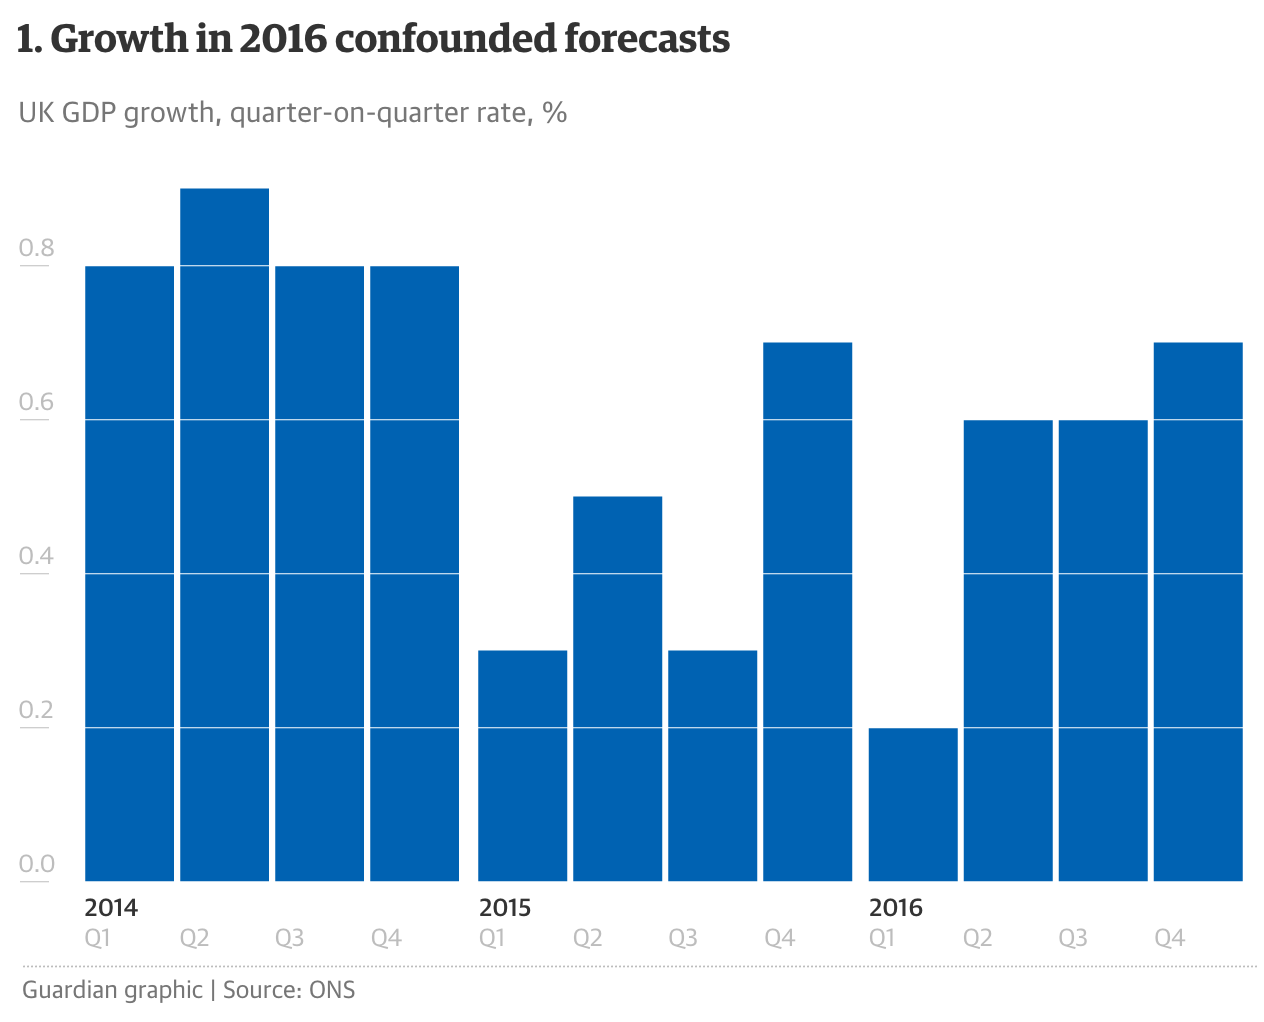
The British government is delivering its budget statement today. So as a teaser, the Guardian published this article with six charts to help understand where things are at. Chart-wise there is nothing radical or revolutionary here, but I have a soft spot for articles driven by data visualisation.
Quarterly growth
Credit for the piece goes to the Guardian graphics department.
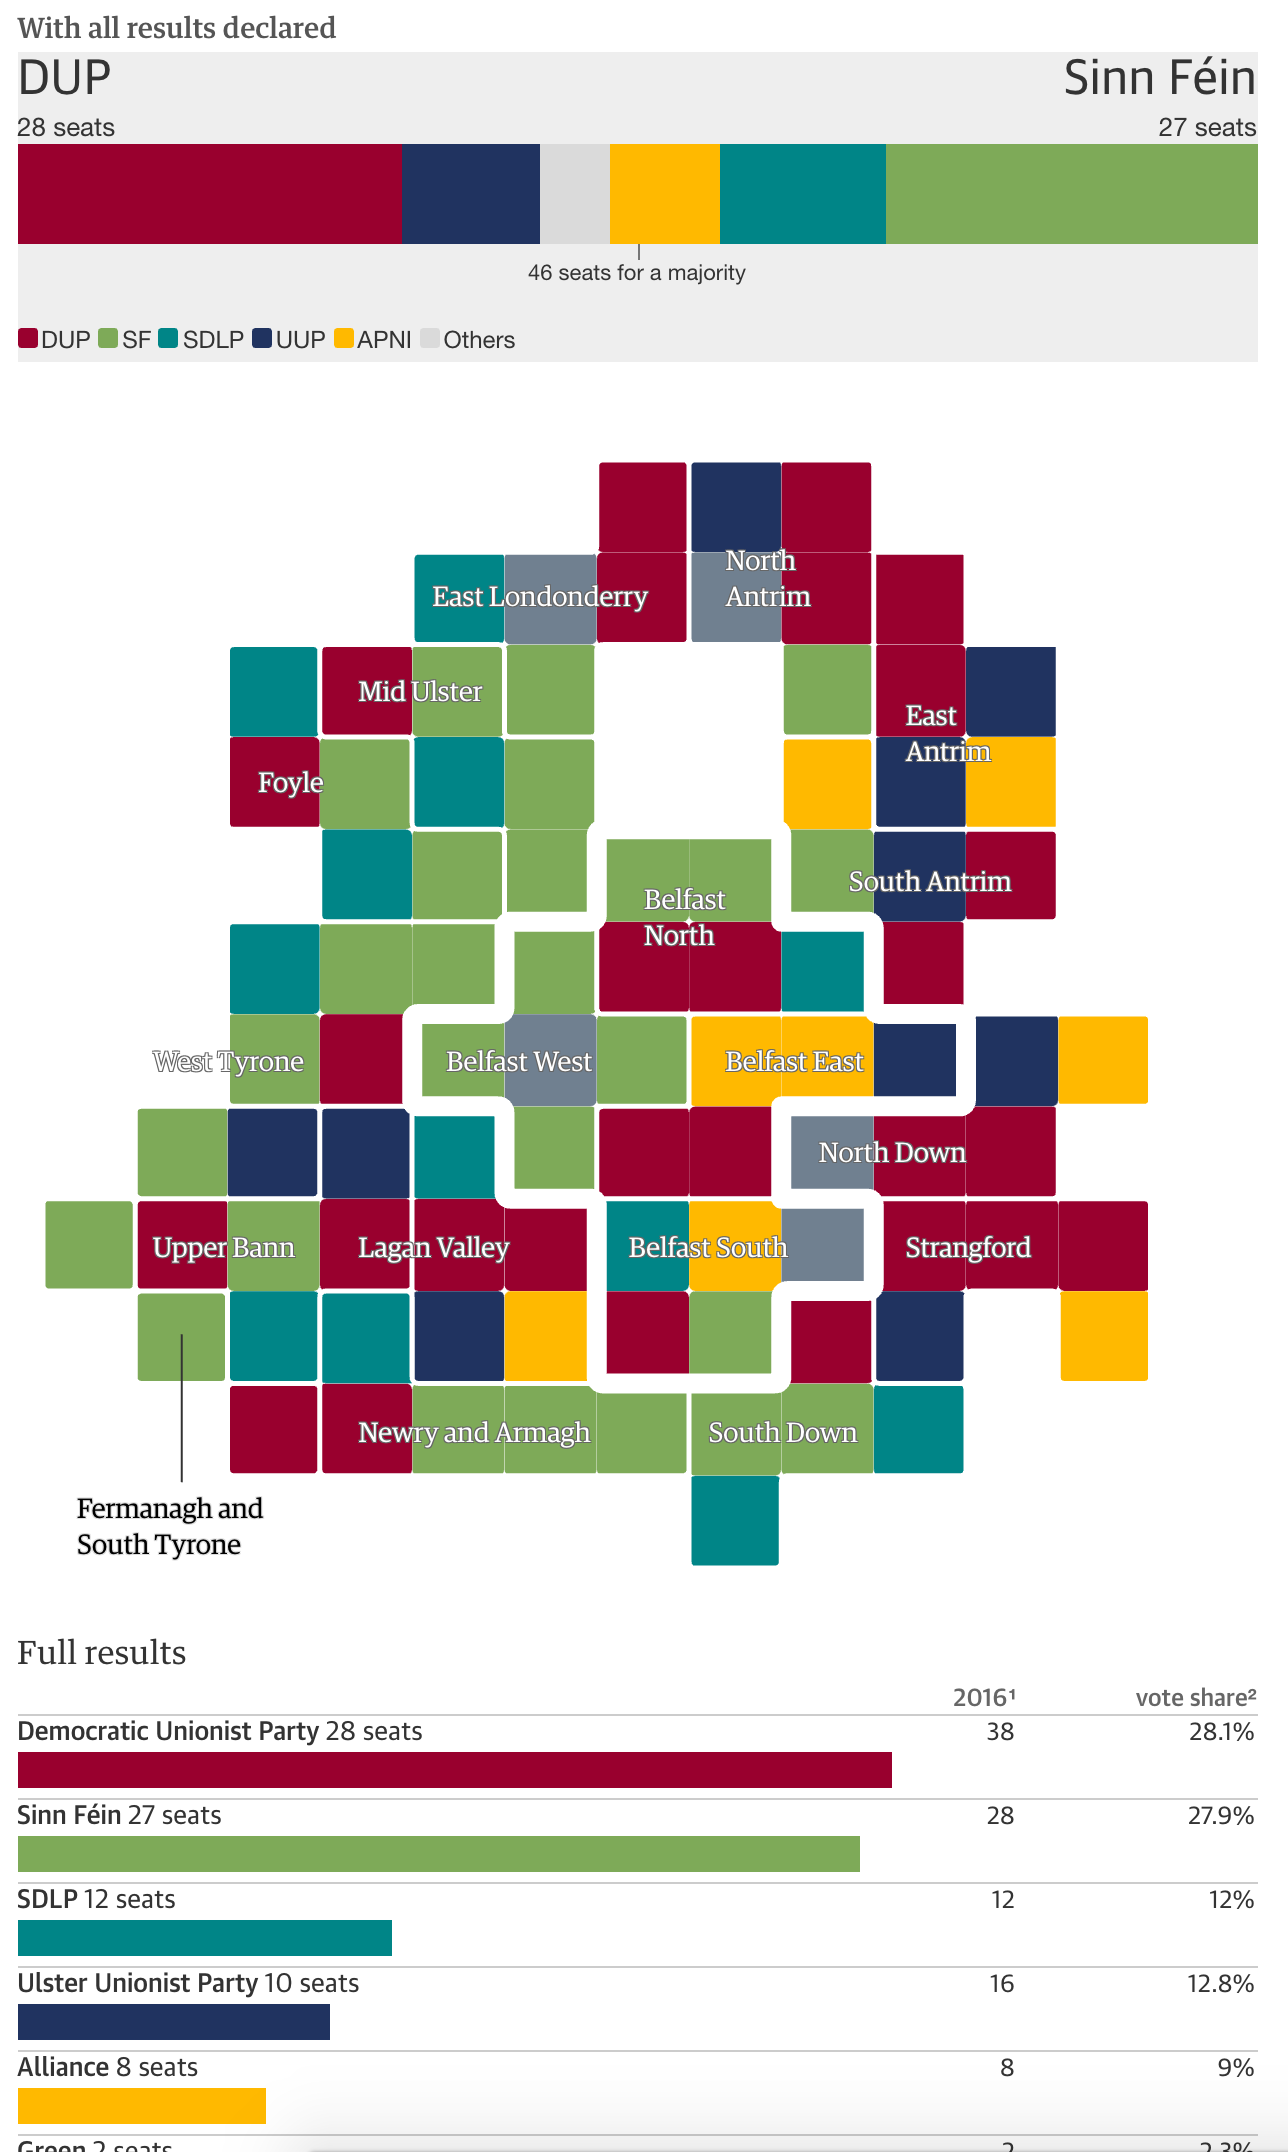
Friday was election day across Northern Ireland as voters elected their representatives for the assembly at Stormont. The headline results: the Nationalists have gained significant ground on the Unionists. The Guardian captured the tallies in this results page.
An almost even split
Credit for the piece goes to the Guardian’s graphics department.
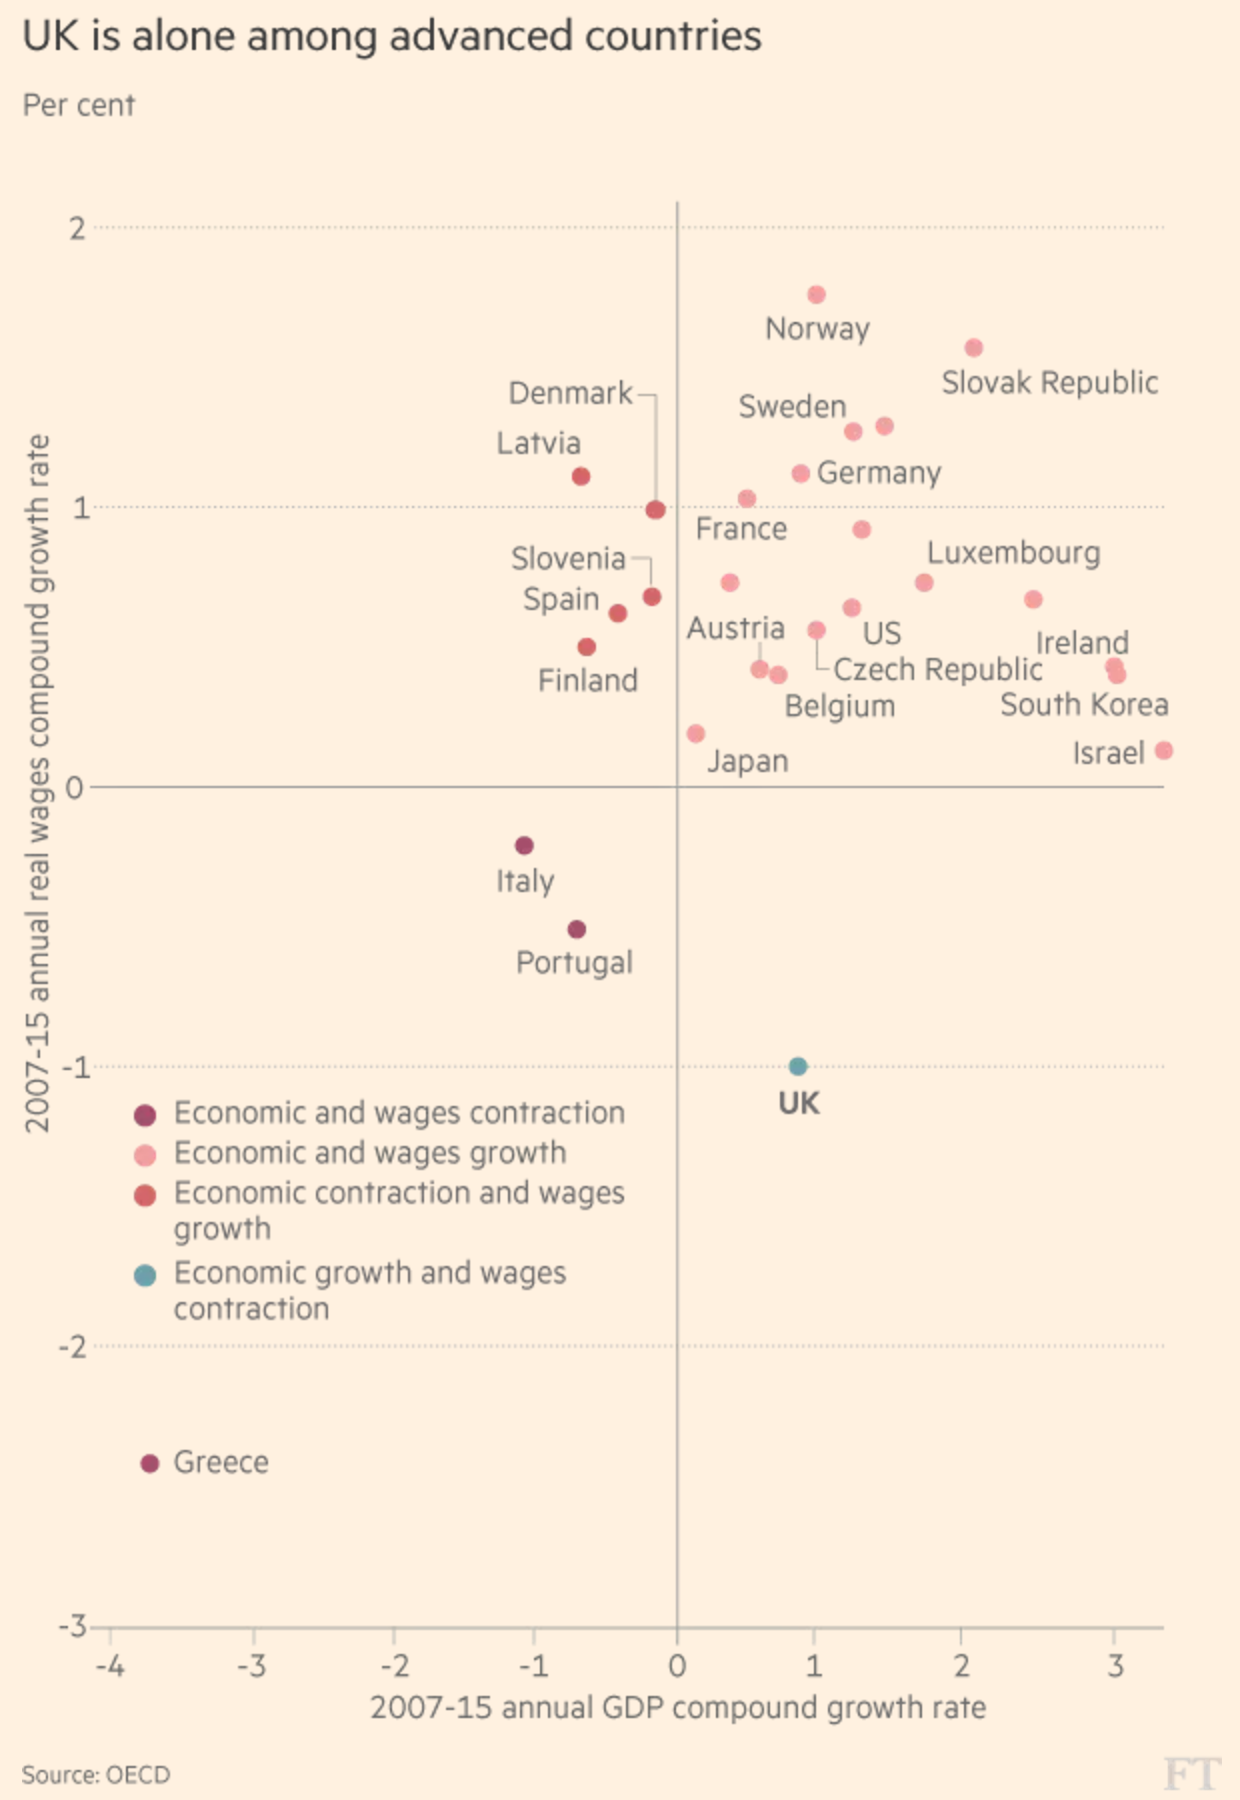
We have a scatterplot from the Financial Times that looks at wage and economic growth across the OECD, focusing on the exception that is the United Kingdom. And that is not an exception in the good sense.
The UK had the rare privilege of experiencing economic growth—that’s good—while simultaneously wages fell—that’s bad. But I wanted to comment on the chart today.
I would have designed this a little bit differently
Straight off the bat, the salmon-coloured background does not bother me. That is FT’s brand and best to stick to it and make your graphics work around it. Possibly the colours in the plot could use a bit of a push to increase separation, but that is more a design quibble. Instead, I am not too keen on the colour coding here.
Not that the colours need not be applied, but why to the dots? Note how the dots of a colour fall into one of the quadrants. Instead of having people refer to the legend, incorporate the legend into the chart by moving the labels to the plot background. You could colour code the labelling or even colour the quadrants to make it a bit clearer.
Credit for the piece goes to the Financial Times graphics department.
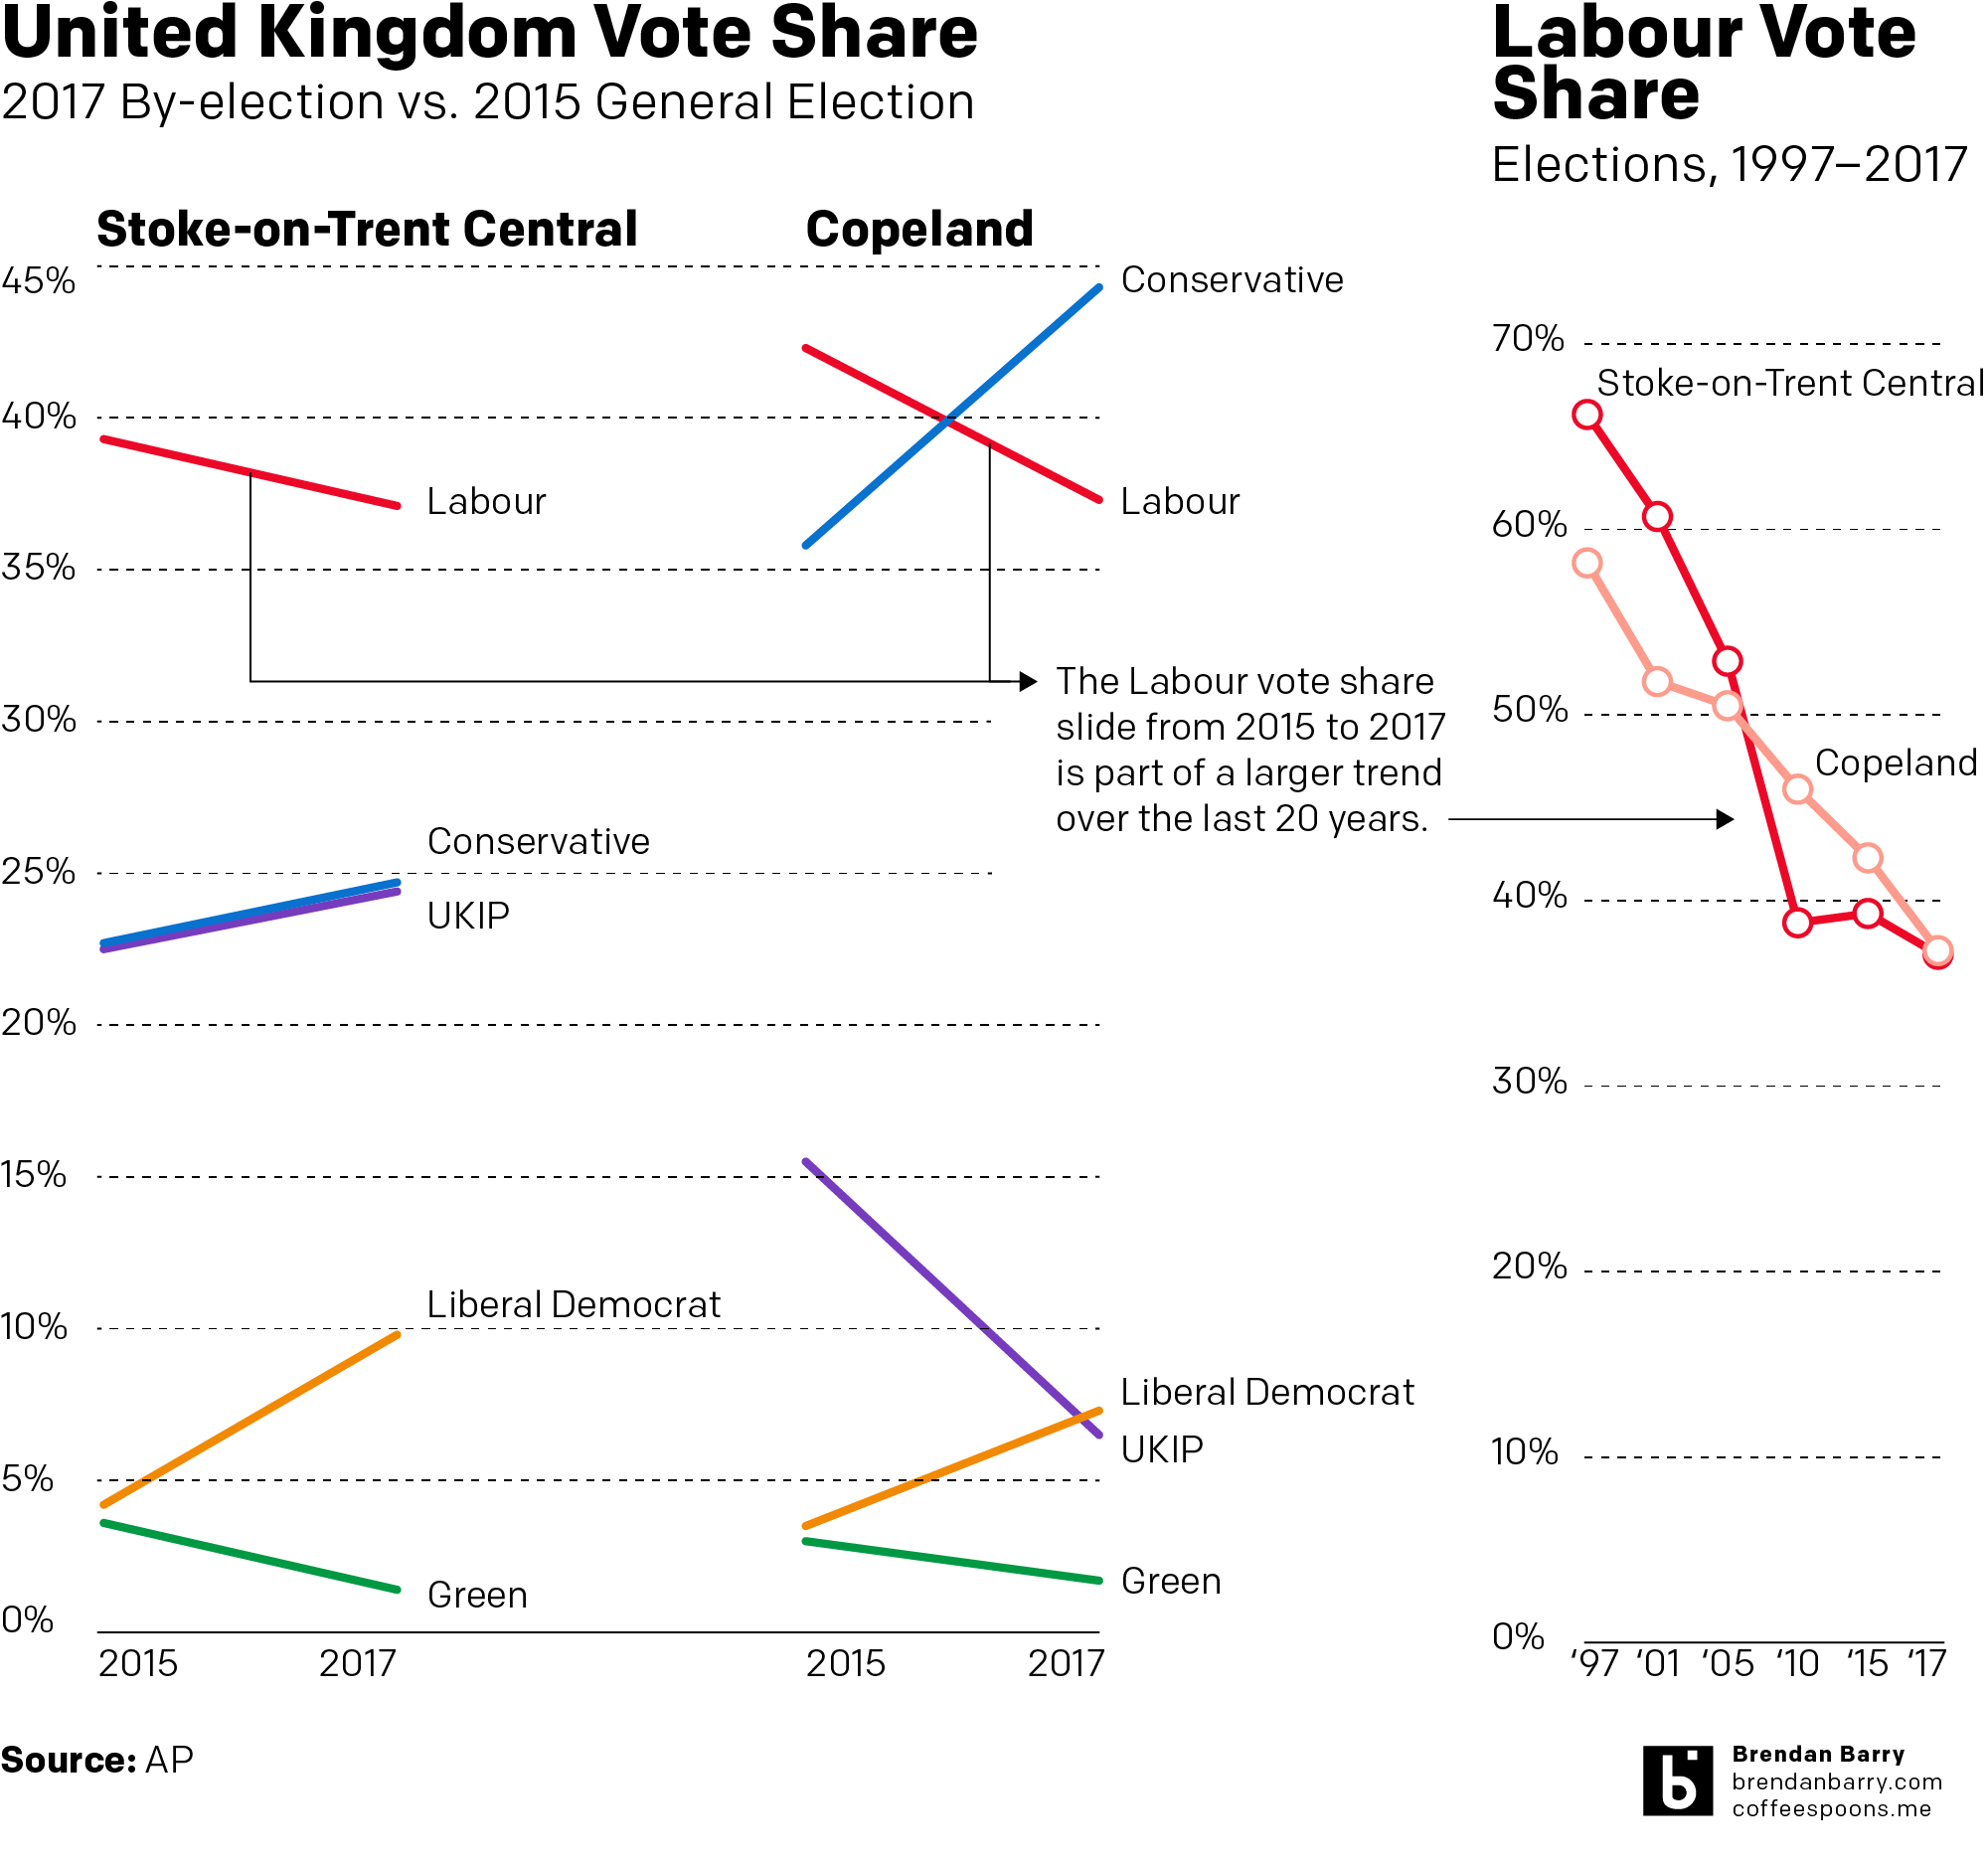
Labour’s collapse in Copeland in particular is comically bad, but this Friday indulge me in a non-comedic post. Instead, Thursday night we had the results for the by-elections in Stoke and Copeland, two long-held Labour Party constituencies.
Generally speaking in a by-election, the government of the UK can expect to see its vote share decrease if not altogether lose seats. Consequently Labour, as the party of the opposition, should have been expected to hold its two seats and increase its vote share.
Well Labour did win in Stoke, but its majority shrank by half. That’s not so good. And then in Copeland, the bottom sort of fell out. The charts I put together using AP data show what in Copeland was an historic win for the Tories. I could get into the hows and the whys, but you’re best off to go read a British politics site for that. But…something something Corbyn.
I was having a conversation with a mate the other night about what Brexit means for Scottish independence. This mate, however, is an American. Because when American politics are depressing and nonsensical, we turn to British pol—wait, never mind.
Despite the overall UK vote to leave the European Union, Scotland (and London, and Northern Ireland) voted overwhelmingly to remain. But since part of the whole vote no to independence thing was remaining part of the EU thing, shouldn’t Scotland now be well positioned for IndyRef2?
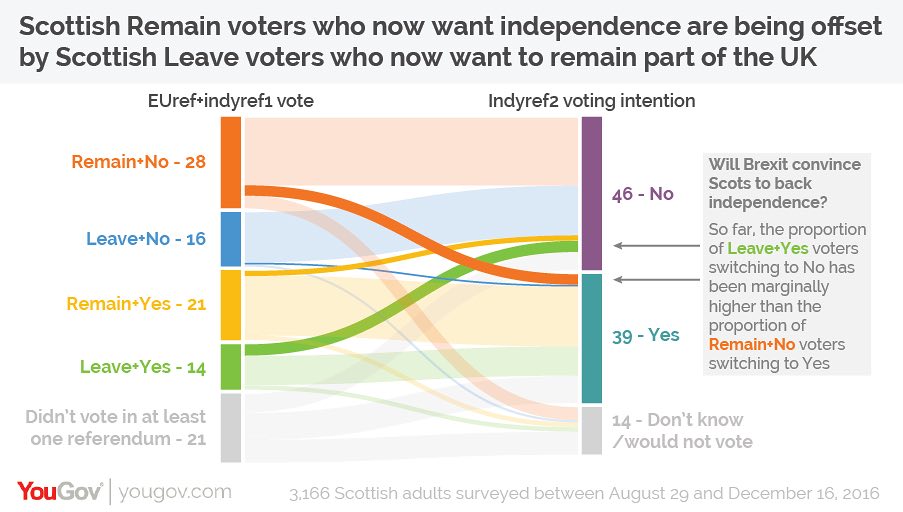
I read this article from the Guardian back in January and meant to share it with you all, but I somehow forgot about it. So at long last, it turns out no, not so much. The whole thing is worth a read; it uses YouGov survey data to break out voters into different camps. And what sort of nails the argument is this graphic.
About that independence…
There are four/five groups of Brexit/IndyRef1 voters that then get sorted into two/three IndyRef2 results (yes, no, maybe I don’t know?). And what you can see is that yes, a significant number of those who voted to Remain in the EU, but voted no to Scottish independence would now vote for independence. But, an almost equal number of those who voted to Remain and also voted for Scottish independence would now vote against Scottish independence. In effect, these two voter movements are cancelling out any potential gains for a future Scottish independence vote.
Credit for the piece goes to the YouGov graphics department.