Recent Military Expenditure

The Crimean situation has highlight how much not just Ukraine is not ready to fight Russia, but also how much less Western Europe is prepared to fight. This piece from the Washington Post examines actual defence expenditure and then defence expenditure as a share of GDP. While Europe has remained steady or in decline, Russia has been ramping up its defence spending since the beginning of the 21st century.

Defence spending
Defence spending

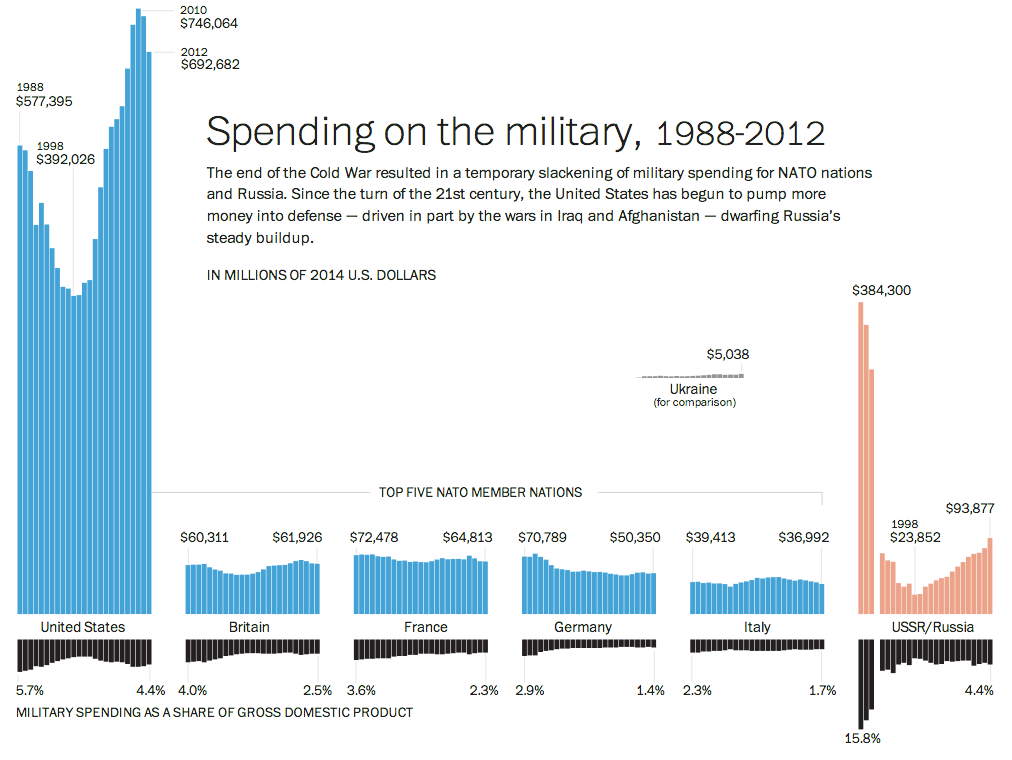
Credit for the pieces goes to Patterson Clark.

The Scale of Searching for MH370

Search authorities may have finally found the missing Malaysian Airlines flight in the southern Indian Ocean. The Washington Post created this great interactive piece to give you a sense of scale of just how difficult it has been to find the aircraft.

The MH370 Search Area

Credit for the piece goes to Richard Johnson and Denise Lu.

One Proposal to Simplify the Tax Code

Republican congressman Dave Camp, Chairman of the House Ways and Means Committee (basically responsible for the tax code), wants to simplify the tax code. This nice graphic by the Washington Post basically sums up the changes.

Proposed bracket simplification

Credit for the piece goes to the Washington Post graphics department.

Malaysia Airlines Flight 370

Ukraine has dominated the news much of the last few weeks. But the new 24/7 international news story is the missing aircraft (at least as of my writing this) that was Malaysia Airlines Flight 370. There are presently two nice graphics I have seen attempting to explain the story. The first, a cropping of which is below, is from the Washington Post.

The Washington Post piece

The second piece, again another cropping, is from the South China Morning Post.

South China Morning Post's graphic
South China Morning Post’s graphic

Credit for the Washington Post piece goes to Gene Thorp, Alberto Cuadra, Laris Karklis, and Richard Johnson.

Credit for the South China Morning Post piece goes to the South China Morning Post graphics department.

Potholes

Today’s piece is from the Washington Post. However, it is less data visualisation and more of a neat little motion graphic explaining the formation of pot holes. Since it seems to be about that time of year when roads are destroyed by the things.

Potholes
Potholes

Credit for the piece goes to Sohail Al-Jamea and Bonnie Berkowitz.

Household Income Inequality

The Washington Post published this dot plot graphic to explore inequality in household income across numerous American cities.

Household income inequality

The chart, as most dot plots do, does a good job of showing where several distinct points within a set fall within the entire range of data. Or to put it into other words, where do the poorest, the richest, and the most middlest households in Philadelphia fall within all Philadelphia households? The data is interesting because you will begin to uncover some significant outliers. For example, by quick glance, the 50th percentile in both Detroit and Cleveland earn less than the 20th percentile in San Jose.

Credit for the piece goes to the Washington Post graphics department.

Explaining What is Going on in Ukraine

Not “the Ukraine” as it is (admittedly) fun to do in pop-culture references to Seinfeld. This comes from the Washington Post and the article tries to show that the protests in Kiev are not necessarily a vast majority against the government. Certainly the opposition is strong, but there is also a very strong pro-government movement. Why? Because in the broadest of senses, Ukraine is where the West, i.e. the European Union, meets the East, i.e. Russia.

A divided Ukraine
A divided Ukraine

Credit for putting this all together goes to Max Fisher. Credit for each of the original graphics is to their respective designers whom I cannot identify.

Mapping Economic Mobility

This piece from the Washington Post examines the idea of economic mobility. That is, what is the likelihood that children born and raised in an impoverished family will surpass their parents’ standard of living.

Economic mobility
Economic mobility

Credit for the piece goes to Darla Cameron and Ted Mellnik.

Smart Banking Cards

As I noted in my Friday post, I spent last week in Lithuania for work. That same Friday night, I had a conversation with a few coworkers over dinner and a beer about credit cards. They teased me that for all of America’s technological advances and advantages, even in Lithuania they were using more secure forms of bank card payment: chipped cards. And that story seems a perfect segue into today’s post from the Washington Post.

Through a combination of charts, maps, and illustrations—a cropping of which is shown below—the Post details the advantages of using microchipped cards in preventing certain types of fraud. Additionally, because of the integration of the visuals with the written explanations, text can be used to provide longer anecdotes to explain exceptions and outliers when and where necessary.

Cropping of microchipped card story

Credit for the piece goes to Todd Lindeman.

Washington’s New Ferris Wheel

This past weekend I was having a discussion with some friends about the height of various Ferris wheels. Specifically we were wondering the height difference between the London Eye and the wheel at Chicago’s Navy Pier. Well, it turns out that Washington, D.C. is preparing to begin construction on its own wheel. Naturally, the Washington Post covered the story with a graphic to compare the Capital Wheel to the London Eye.

The Capital Wheel
The Capital Wheel

And for those wondering about Chicago’s wheel at Navy Pier, well it clocks in at 150 feet. That makes it 25 feet shorter than the Capital Wheel in D.C.

Credit for the piece goes to Richard Johnson.