How Much Warmer Was 2015

When I was over in London and Dublin, most days were cool and grey. And a little bit rainy. Not very warm. (Though warmer than Chicago.) But, that is weather—highly variable on a daily basis. Climate is longer-term trends and averages. Years, again, can be highly variable—here’s looking at you kid/El Niño. But, even in that variability, 2015 was the warmest year on record. So the New York Times put together a nice interactive piece allowing the user to explorer data for available cities in terms of temperature and precipitation.

You can see the big chart is temperature with monthly, cumulative totals of precipitation. (I use Celsius, but you can easily toggle to Fahrenheit.) Above the chart is the total departure of the yearly average. Anyway, I took screenshots of Philadelphia and Chicago. Go to the New York Times to check out your local cities.

Philadelphia, PA
Philadelphia, PA
Chicago, IL
Chicago, IL

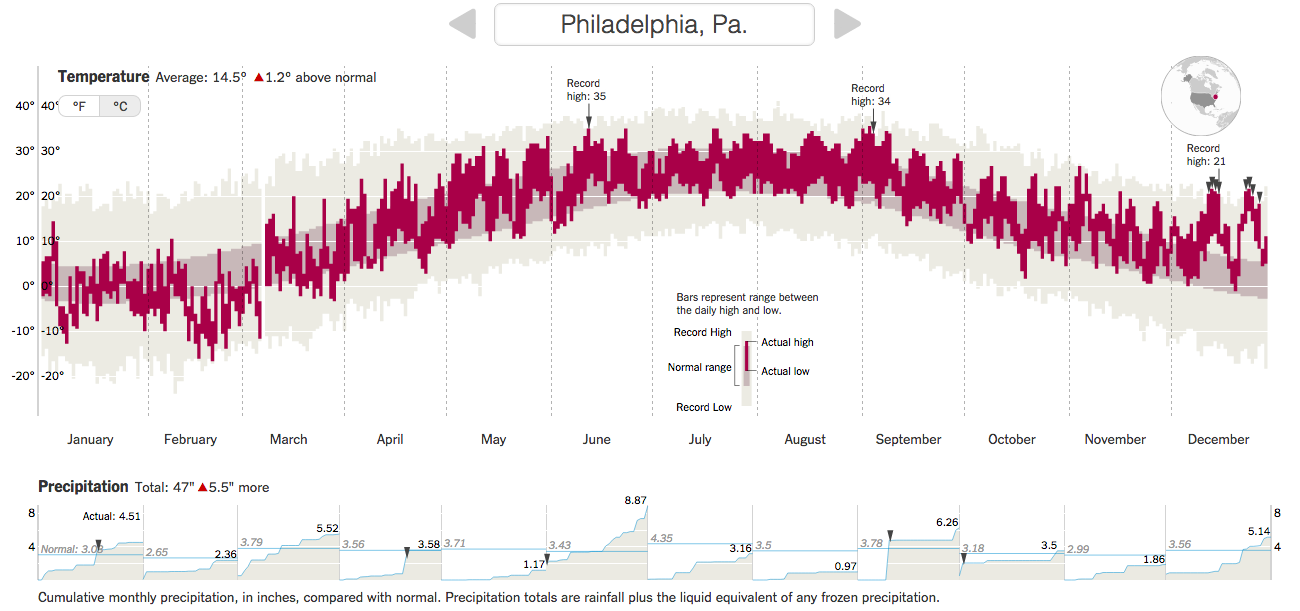
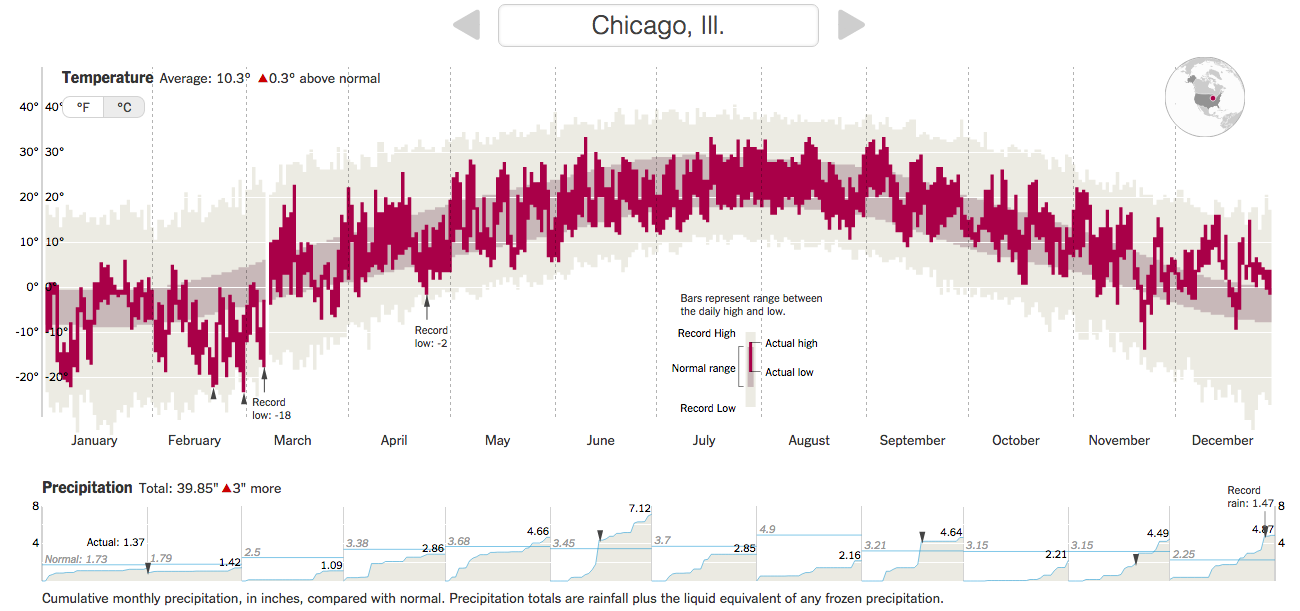
Credit for the piece goes to K.K. Rebecca Lai and Gregor Aisch.

Your Average Daily Sunshine

(Hint, it’s not me.)

I was talking with someone the other day about how I dislike warm weather. Give me nice, cool, crisp weather any day of the week. And also how I am okay without sunshine—a cool, misty, grey day is lovely. Much of weather, of course, is determined by sunlight, energy, hitting the Earth. Well, just a few weeks ago the Washington Post published a piece looking at daily sunlight. At the end of the piece it has a nice small multiple graphic too.

Average daily sunlight

Credit for the piece goes to the Washington Post graphics department.

Water Level on Lake Michigan

Today’s a little piece for those of you who follow me from the Chicago area. It turns out that in the last 30 months, the water level of Lake Michigan has risen three feet. Despite what some people think, Lake Michigan is not an ocean—I have overheard conversations in my neighbourhood about people who went “swimming in the ocean today” and want to show them a map that points out the Atlantic is almost a thousand miles away—and is not under the same threat as the coast via melting icecaps. The Great Lakes are instead impacted by other regional and cyclical patterns, e.g. El Niño. This article by the Chicago Tribune makes use of this small but clear line chart in its discussion of those very factors.

Water levels for Lakes Michigan and Huron

Credit for the piece goes to the Chicago Tribune’s graphics department.

Tornadoes

I just returned from my trip to Kansas City last night. Kansas, if you did not know it, exists within what people call Tornado Alley. That means they receive a lot of tornadoes. But what are tornadoes beyond the plot points of mid-90s action films? Basically complicated micro-weather systems. So complicated we still don’t entirely understand them. But the National Post looks at explaining what we do know.

Inside a tornado
Inside a tornado

Credit for the piece goes to Andrew Barr and Mike Faille.

Boston’s Snowy 2015

Boston has finally had it. And by it I mean the snowfall that broke the record. And by record I mean the record for the most snowfall in a year. Well, at least since they started recording it in 1872. The Washington Post has a nice chart placing the season not just in context, but also showing how quickly the snow fell. Most of the snow has fallen only from 25 January onward. And winter is not yet over.

DC is puny compared to  Boston

Credit for the piece goes to Kevin Uhrmacher.

Shovelling Out of Boston

Boston and the rest of Massachusetts are attempting to dig out of the blizzard that struck them earlier this week. The Boston Globe has provided its readers with a step by step set of directions for how to best extricate people and cars from snowed in homes.

Shovelling out
Shovelling out

Credit for the piece goes to James Abundis and Javier Zarracina.

How Different Temperature Profiles Make Different Precipitation Types

I apologise for the lack of posts over the last two weeks, but I was on holiday. Naturally, I have returned just in time for some snowstorms in the Midwest. But today’s piece comes from WGN and it explains how the type of winter precipitation that falls depends not solely on ground temperatures. Rather, temperature profiles in the upper atmosphere can make all the difference between rain, sleet, and snow.

How temperatures create different precipitation types

Credit for the piece goes to Steve Kahn and Jennifer Kohnke.

The Polar Vortex…Or Not

If you live in the United States, you probably have heard the term polar vortex by now. People have been using the term to describe the bitterly cold temperatures affecting the eastern two-thirds of the country. But the term polar vortex is a meteorological term that means a specific phenomenon. In other words, it’s more than a hashtag along the lines of snowmageddon. The Washington Post explains what the polar vortex is.

The Post explains the polar vortex

My caveat for this piece is that from my understanding, it’s not entirely correct. Or perhaps not detailed enough. In brief, we turn to the National Weather Service out of New York for a more technically correct, but more poorly designed graphic.

National Weather Service explanation

Poor type, poor colours, poor hierarchy. Those are abundantly clear, but the important part is that the NWS wants to correct many of the popular misconceptions. Somewhere between the well-intended but less-than-entirely-clear Post piece and the accurate-but-also-unclear National Weather Service piece is an opportunity to explain the concept to the public.

Credit for the Washington Post piece goes to Bonnie Berkowitz, Richard Johnson, Katie Park, and Gene Thorp.

Credit for the National Weather Service goes to the graphics team at the National Weather Service of New York.

Winds Across the World

Most of us have likely seen the wind map by Fernanda Viegas and Martin Wattenberg. However, this new wind map takes the idea and makes it a bit more useful. It offers the user the opportunity to look at winds at different levels of the atmosphere. Or you can look at different projections. Some projections show wind patterns better than others. You can also see wind across the world, not just the United States.

Wind map
Wind map

Credit for the piece goes to Cameron Beccario.