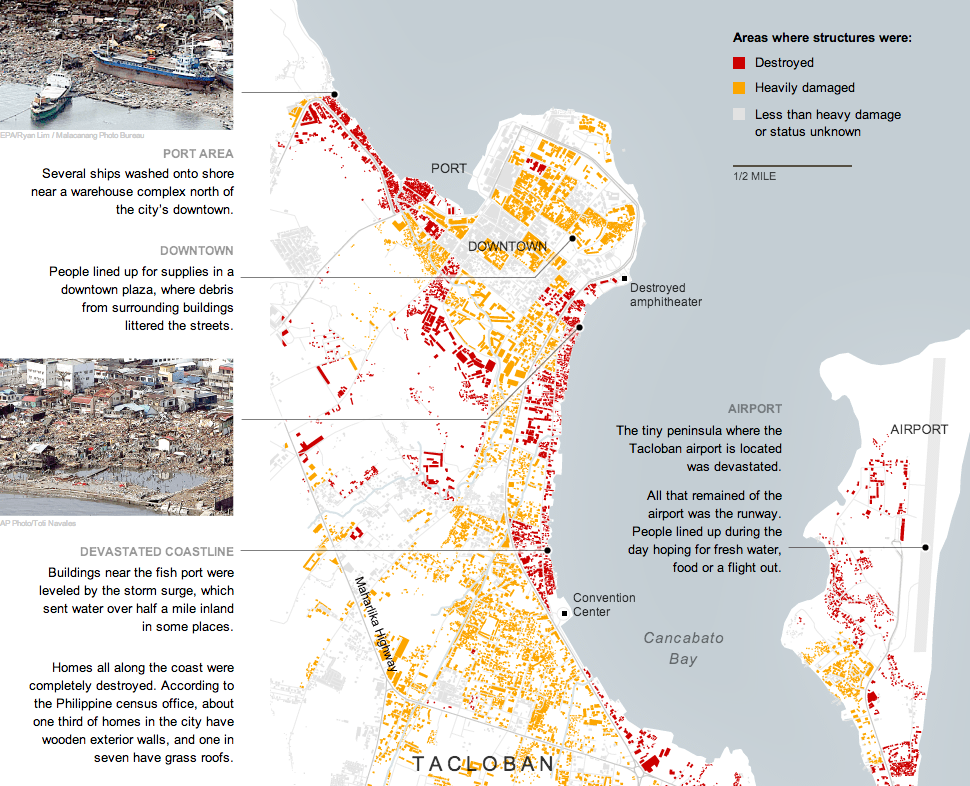
On 8 November, Typhoon Haiyan made landfall in the Philippines, killing what may well be 10,000 people. The New York Times covered much of the damage in Tacloban, perhaps the hardest hit city, in this interactive graphic.
Structural damage in Tacloban
Credit for the piece goes to the New York Times graphics department.
Yes, yes it is. This map from the Washington Post looks at global temperature change since 1901. The article it supports is about how scientists are now all but certain mankind is responsible for global warming. Personally I prefer the term climate change because global warming sounds as if everything warms and as this map shows, clearly that is not the case.
Snow should fall upon Chicago this afternoon and it may measure up to a few inches in depth. But much of this winter has been below average. And that is much the same from last year when snowfall did not even reach 20 inches.
I went through NOAA data to look at the last decade of monthly snowfall to see just how little snow has fallen this winter. (Not a lot.) And then I looked at the entirety of the NOAA records to see where 2011/2 fit in the span of winters. (One of the least snowy.) This graphic is the result.
This weekend I researched meteorological data for a graphic that I will post tomorrow. But in doing that research I came across a series of weather infographics from WGN that are better than the average. The one below details the snowstorm due to impact the Chicago area and how it will form (along with the storm that brought a few inches of snow last week).
The setup for this week's snowstorm in Chicago
Credit for the piece goes to Jennifer Kohnke and Faye Shanti.
If you do not live on the East Coast, you may be unaware that there was some minor snowfall in New England over this past weekend. The Weather Channel went ahead and named the storm Nemo. (I’m going to lay off the suspect and fishy jokes.) I wanted to revisit the storm because of two graphics that both mapped snowfall totals.
The first is from the New York Times. As one would expect, a quality graphic with clear colour ranges to show the impact across the wider New England area, western New York and New Jersey.
The New York Times snowfall totals
But from the local radio station WNYC came an interesting map of users’ observations. Because it’s a local radio station, the difference between the two versions is that the breadth of data is not as far-reaching as the Times’ data from the National Weather Service.
The limits of WNYC user-reporting
However, this sort of user-created data allows for more nuanced, locally-specific data visualisations.
User-reported snowfall in the near New York area
Of course, this creates issues with the accuracy of the data. And in the case of this map, whether the amount given was a snapshot of the snowfall at the time the snow was falling or the final tally.
Credit for the pieces go to the New York Times, and to Steven Melendez, Louise Ma and John Keefe for the WNYC piece.
So that fishy little storm the Weather Channel called Nemo—you may have heard of it—put a little snow across New England. Last week the New York Times published an interactive infographic that looked at when and where the snow would be falling, from New Jersey to New York to Maine.
The storm at or near its worst
The times are cut into six-hour blocks and show in the upper left where the snow would be falling by rate per six-hours. To the right of the map is a series of bar charts that show the snowfall pattern in more or less of a wave. Beneath all of it are a comparison of when, over the last several decades, the largest snowstorms hit Boston and New York (and how much snow each city received). A comparison of the map before to the end of the storm, except for parts of Maine.
The forecast for after the worst had passed
Credit for the piece goes to Tom Giratikanon, Matthew Ericson, Xaquin G.V., Archie Tse, and Jeremy White.
2012 was the hottest year since 1895. That’s 117 years by my count. Of course just being the hottest year ever recorded does not mean everywhere was warmer than usual. Some places were cooler. And the New York Times looked at the US pattern of warmer and cooler than average temperatures. Below the map are small multiples of charts recording the number of days above or below the normal for that day.
That's a lot of warmer than average temperatures…
And for anecdotal evidence, I will say that this past summer was godawfully hot in Chicago.
I live in the Midwest but I grew up on the East Coast. I spent my summers at the Jersey shore. (No, not that one.) I know a thing or two about hurricanes. Isaac is expected to make landfall later today in the New Orleans area almost seven years to the day when Katrina made landfall. There are some notable differences between the two storm systems and the New York Times has attempted to elucidate those important distinctions in this graphic.
Living in Chicago, hurricane season means rather little. Perhaps at worst the city would see a major rain system moving up from Texas or the Gulf Coast. But, from all my time living on the East Coast makes hurricane season a bit more meaningful if now just as an outside observer. The Weather Channel has launched a site called the Hurricane Tracker that allows you to follow the current season’s storms.
Active Tracker
While there has yet to be any major activity, there have been a few named tropical systems that are present in what is called the Active Tracker. The storms are tracked geographically, showing you the precise locations where the storm was recorded and then filling out the path between points. The data includes information on strength—hurricanes are classed on a 1–5 scale with 5 being really most unpleasant—such as windspeed and pressure—hurricanes are enormous low pressure systems. The panel on the left of the screen provides a detailed history of the storm and links the recorded data points to the corresponding geographic points on the map. Currently, the storms have all been relatively minor and short-lived; watching a major storm of some duration through the charts and the map progression could be quite fascinating.
Historical Tracker
But there is also the Historical Tracker that catalogues an impressive number of previous storms. The view first loads with an overwhelming number of storm tracks, but filters for controlling the years—which includes a interactive mini-graphic of the total number of storms for each year that when clicked filters for only that year—and for location of landfall begin to significantly bring your search or exploration into focus. I have yet to find any detailed information about specific storms, the one in this screenshot being those that made landfall in the Northeast roughly during my lifespan. (I have memories of being at the shore during Hurricane Bob with the winds and rain and warning sirens making an impression.) You cannot click to focus on a particular storm, instead, a mouseover is the only way of discovering the name of a particular track. But, that may simply be an unavailable level of data, especially with the storms from the 19th and early 20th centuries.
Now I just hope we can use this sort of information to help develop better forecasting and modelling to help save lives and property.