Arctic Chill

The Arctic air mass that has frozen the Midwest continues to spread and so today will be a tad chilly in Philadelphia. Yesterday, however, the Guardian had a piece that used data from NASA to show how the air masses over the Northern Hemisphere have been disturbed by unusually warm air.
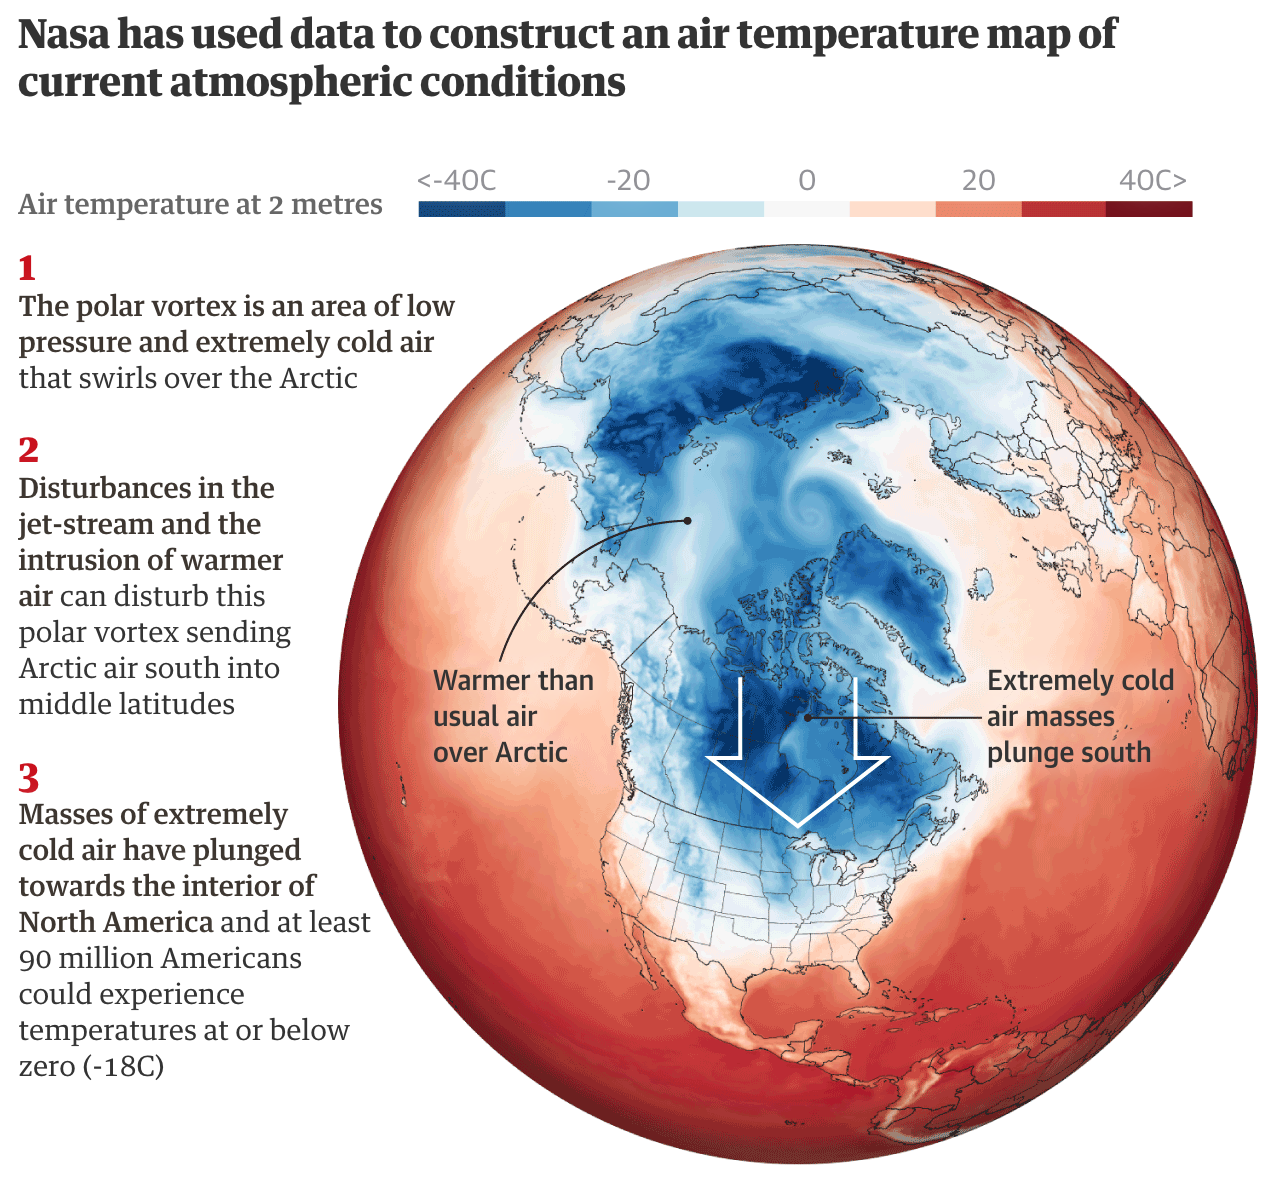
The Arctic plunge.
The Arctic plunge.

One theory to how this all works is that the reduced polar sea ice means water absorbs summer heat instead of being locked in the ice. But then that heat is basically released come winter. (I’m oversimplifying this.) That warms the air, which disturbs the polar vortex. As the Guardian then explains, the destabilised air mass can wobble and spill some of its frigid air down into the lower latitudes. (It takes a little while because the polar vortex is in the upper atmosphere and the air needs to sink to the ground.)

Point is, bundle up and stay warm.

Credit for the piece goes to the Guardian graphics department.

Arctic Sea Ice Levels Continue to Decline

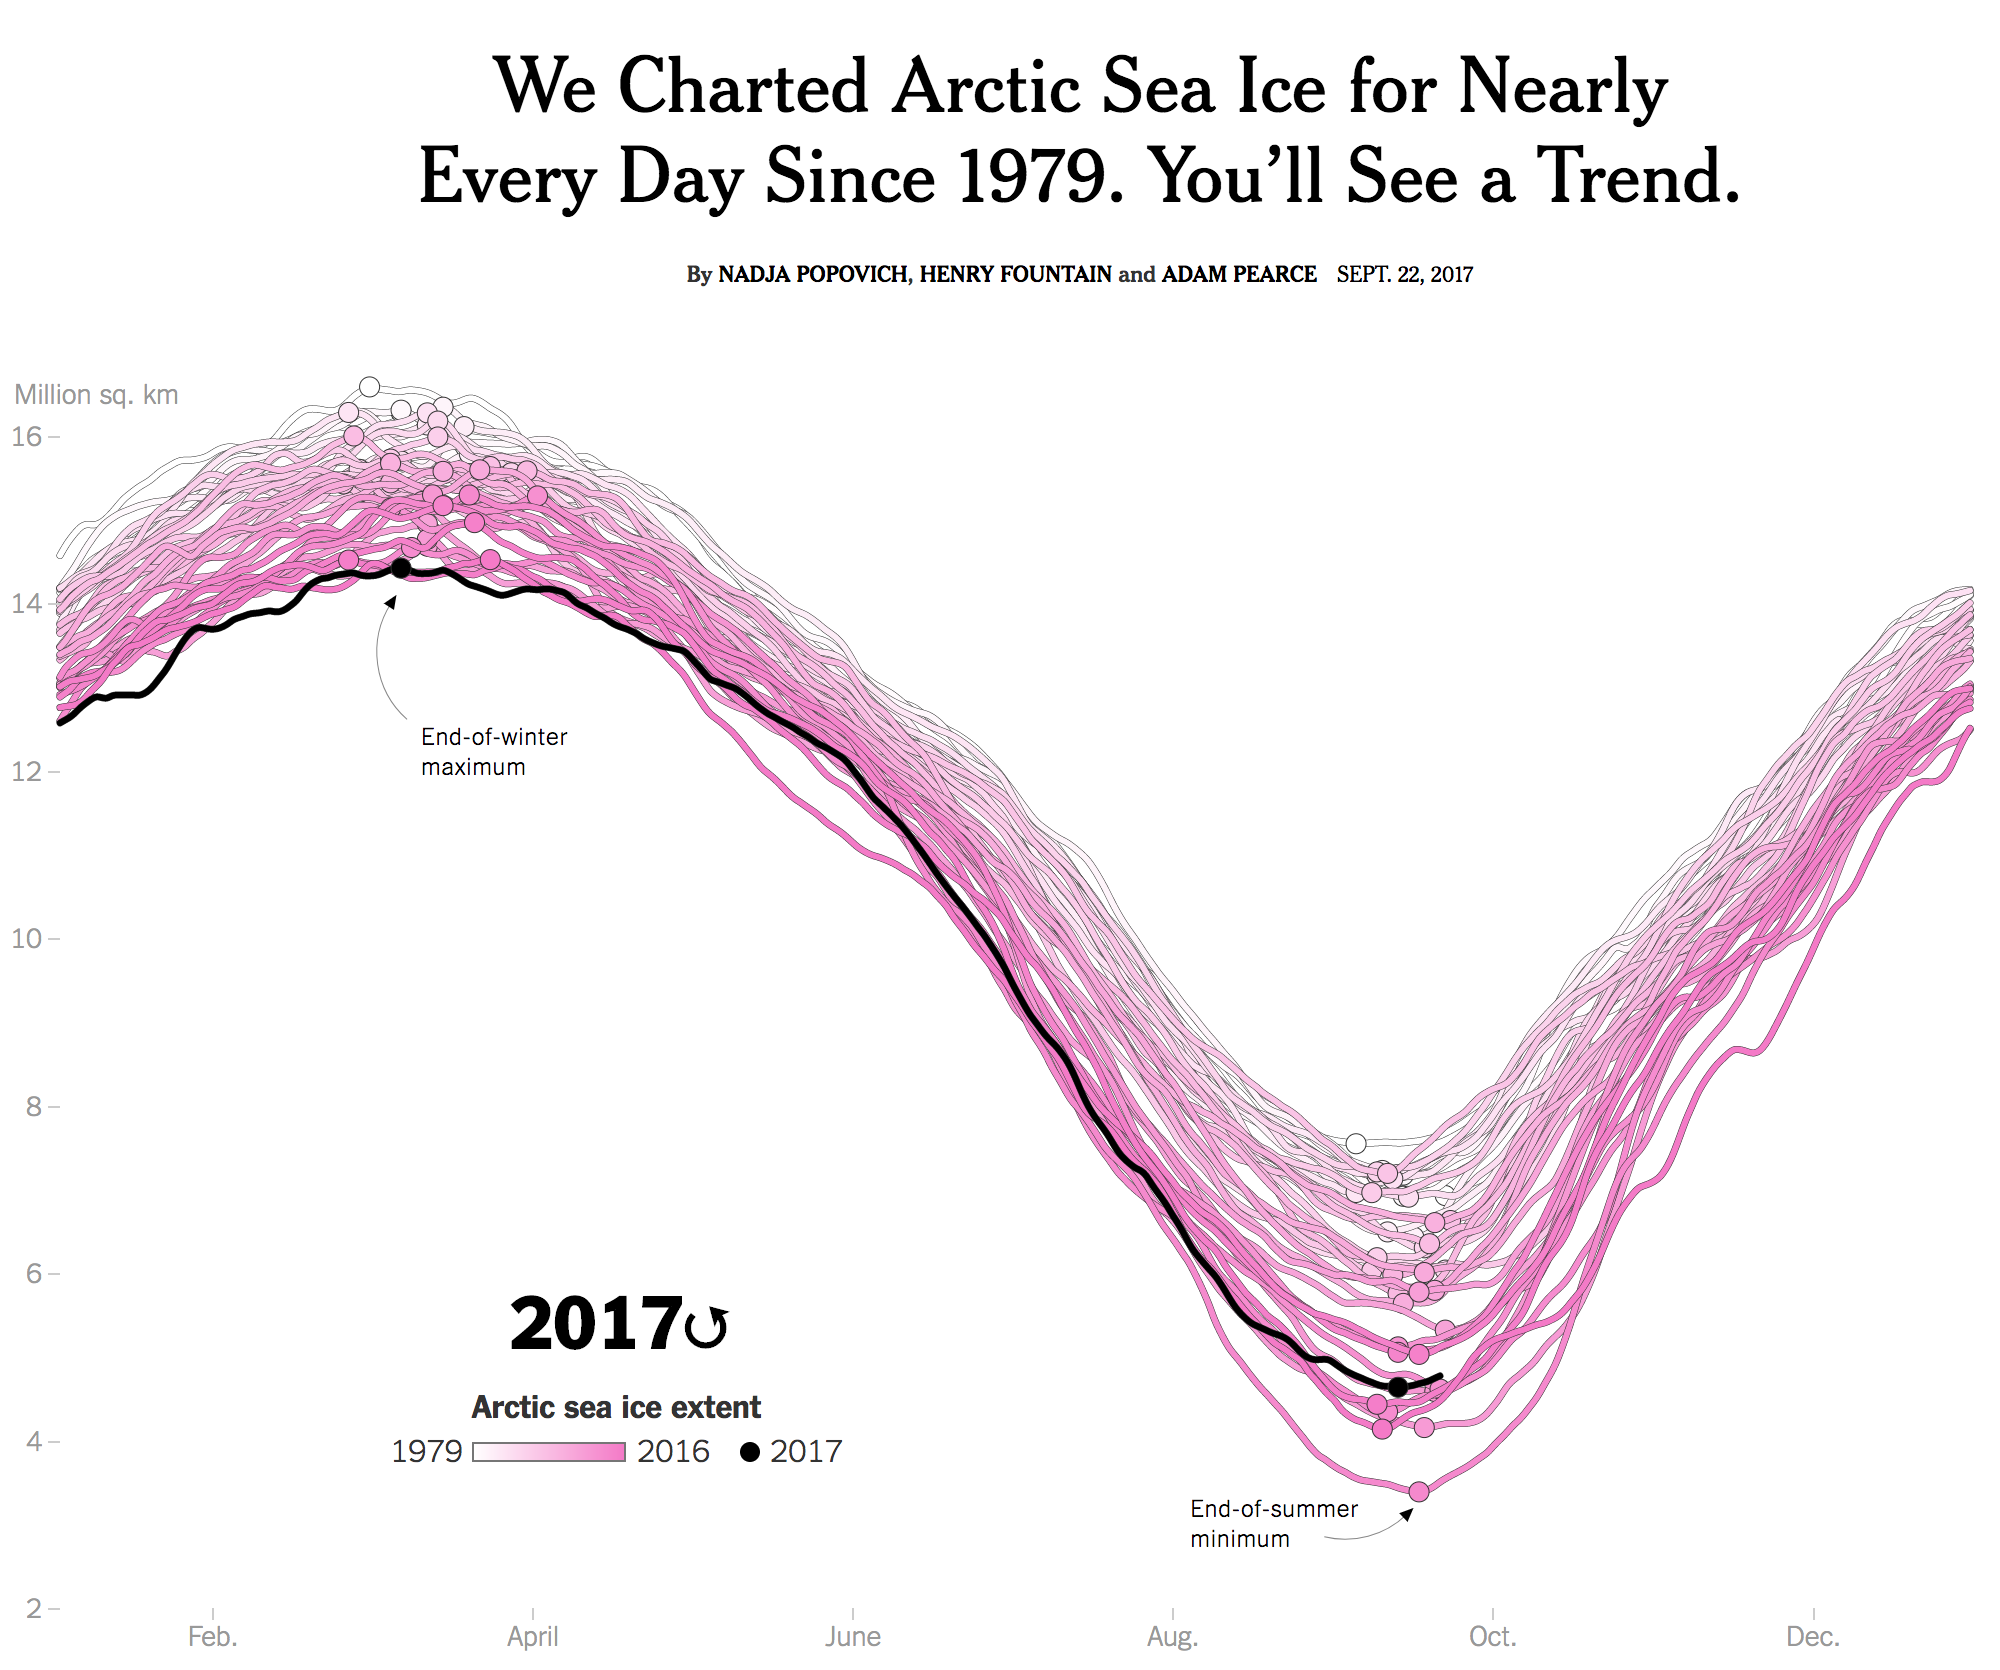
You may recall how over two years ago I posted about a piece from the New York Times that explored the levels of Arctic sea ice. It showed how the winter sea ice of 2015 was the lowest level ever recorded. Well last week the Times updated that piece with new data. And instead of the static graphic we enjoyed last time around, this time the piece began with a nice animation. It really helps you see the pattern, so you should click through and check out the whole piece.

Go hit play and you'll see the trend
Go hit play and you’ll see the trend

But this isn’t just a visually top heavy piece. No, the remainder of the article continues to explore the state of Arctic sea ice through a number of other charts and maps.

Credit for the piece goes to Nadja Popovich, Henry Fountain, and Adam Pearce.

It’s Melting! It’s Melting!

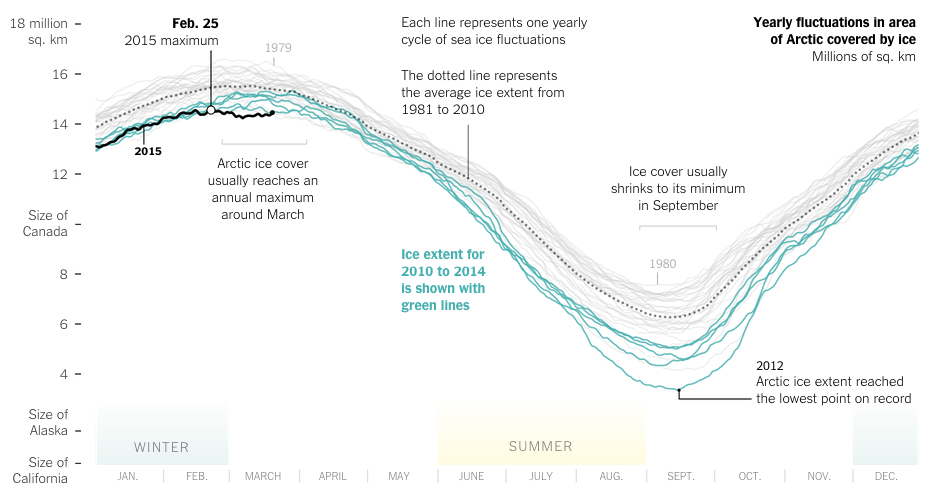
Spring has finally arrived. And that means that far to your humble author’s north, the sea ice in the Arctic is beginning to recede from its annual maximum coverage. However, this year’s coverage was the smallest since satellite records began in 1979. The New York Times covers the story in a nice article with two big data pieces. The first is a really nice map—not shown—that looks at this year’s coverage compared to average extents.

The really nice part, however, is a line chart of historical ice coverage from 1979 through to the current date. While the piece is not interactive, the annotations in the graphic do a nice job explaining the different lines and outliers. Overall, a solid piece.

Annual cycle of Arctic ice coverage

Credit for the piece goes to Derek Watkins.