Rising Rate of US Drug Deaths

While today’s post is not an uplifting story, I did find it remarkable in its presentation. Nothing too fancy or revolutionary to be certain, but remarkable nonetheless. What was it? This morning when I picked up the Times there was a chart in black and red, above the fold, below the cover photo.

The story is about the rising number of deaths in the United States attributed to drugs. And, no, the line chart is not groundbreaking—though I do love the way the designers cut into the space to efficiently set copy and annotations. But as an above-the-fold graphic this morning, it did the trick.
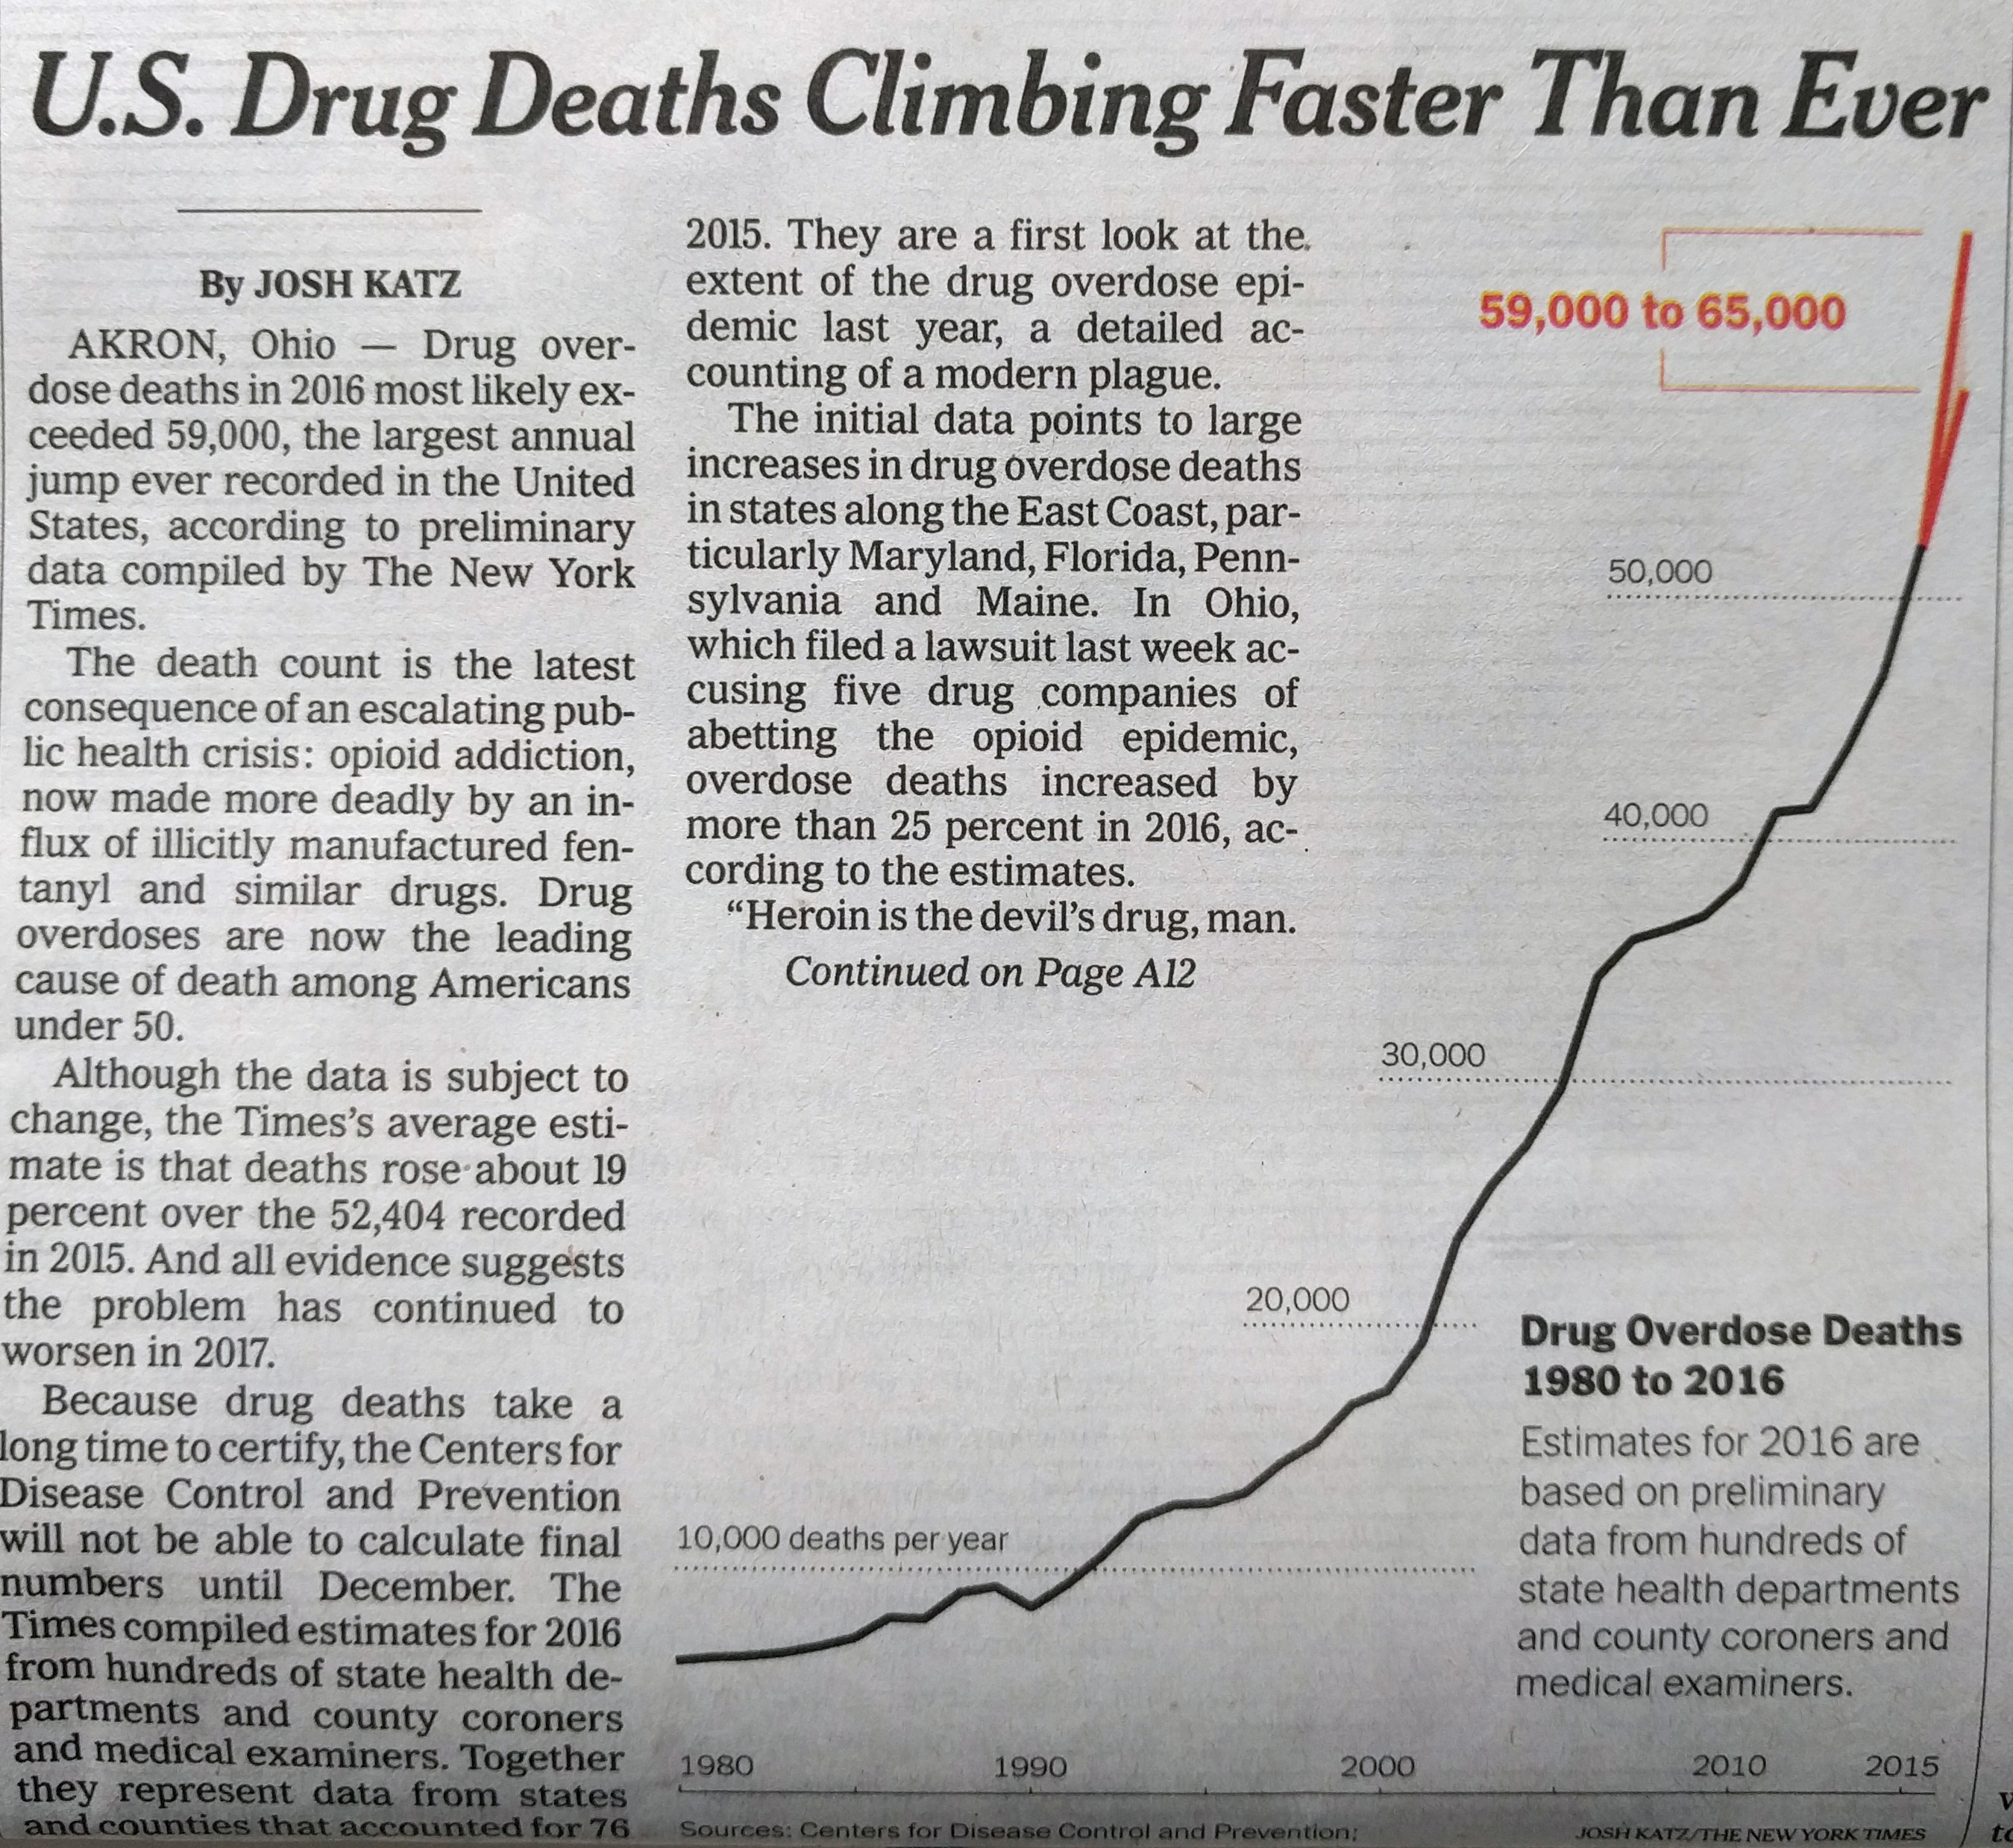
Again, I like the layout of the piece

Credit for the piece goes to Josh Katz.

Mexico: the Land of Many Countries (or Comparisons Thereto)

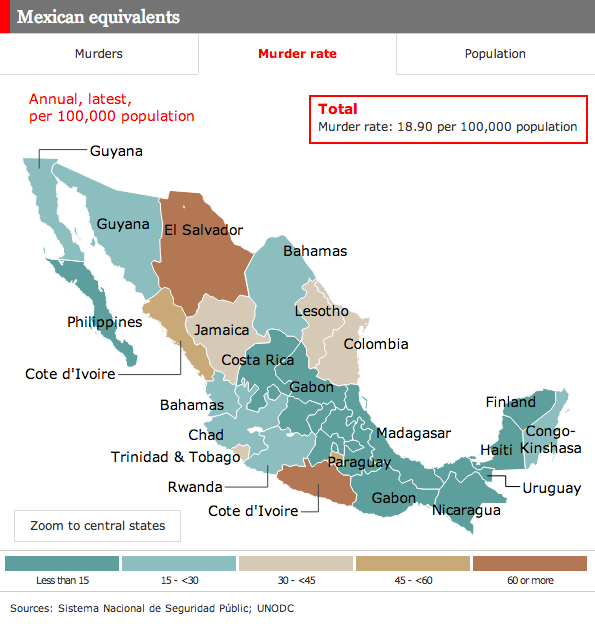
On Thanksgiving, the Economist published an interactive map that looked at Mexico across three metrics: murders, murder rates, and population. Mexico is one of the more populated countries in the world, but it is also one of the most dangerous. In the middle of the previous decade, the Mexican government began to crack down on the drug cartels. But the cartels have violently resisted. Very violently.

The map is nothing new. It labels different Mexican states by comparing their statistics to those of countries across the world. For example, the state of Chihuahua in northern Mexico, one of the “fronts” of this new drug war, has a population of 3.41 million people. The total number of murders so far this year is 2,350. That is only six murders fewer than in the entire country of the Ukraine. Did I mention the population of the Ukraine is over 45 million. More than ten times the size of Chihuahua. And the comparisons go on, though as the map clearly points out the distribution is not uniform.

Murder rates in Mexico

In terms of interactivity, a nice little feature is the filtering of the map by the legend at the bottom. Hover over one of the bars and only those areas appear coloured in the map.